
Abstract
Yam, a staple crop in many tropical regions, has seen significant global production, with Nigeria leading as the largest producer, yielding 61.2 million tonnes in 2022. Historically, yam cultivation has been concentrated in West Africa’s yam belt, accounting for over 90% of global output. Its prominence stems from its adaptability to varied climates, nutritional value, and cultural significance in African diets and rituals. Production trends show steady growth due to improved agricultural practices and rising demand. However, challenges like soil depletion, high labor demands, and post-harvest losses persist. Efforts to improve storage, mechanization, and disease resistance remain key to sustaining growth.
Yam production (worldwide)
Yam production has seen steady growth since 1961, with Nigeria consistently leading global output. In 2022, Nigeria reached its peak production of 61.2 million tonnes, representing 100% of its highest output. Yams are primarily grown in West Africa, where they are a vital food source. The crop’s production trends show gradual increases, driven by improved agricultural practices, better access to seeds, and rising local demand. However, challenges such as post-harvest losses, pests, and soil depletion remain. Despite these, yam cultivation continues to expand due to its cultural and nutritional importance.
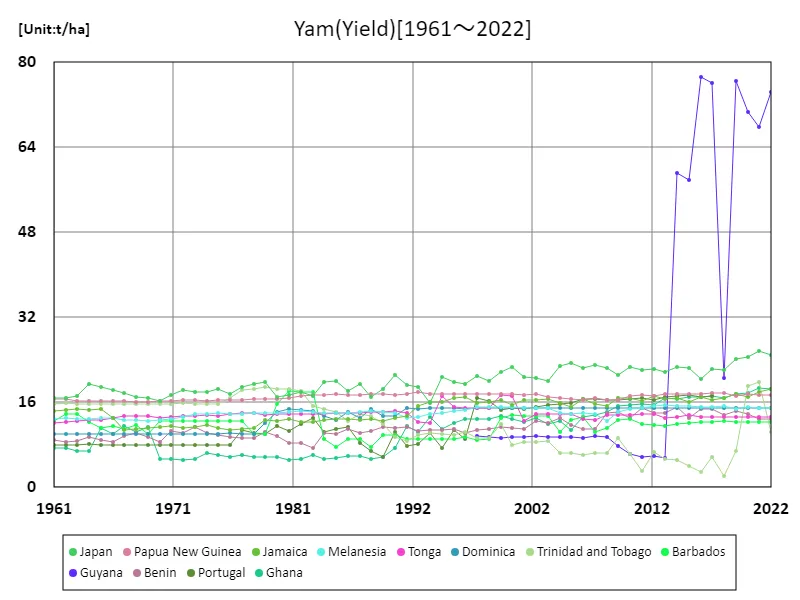
The maximum is 77.1t/ha[2016] of Guyana, and the current value is about 96.4%
Yam production (latest year, countries around the world)
In 2022, global yam production reached 88.7 million tonnes, with Nigeria as the dominant producer, contributing 61.2 million tonnes—nearly 69% of the total. The average global production for the year was 1.48 million tonnes. Yams are primarily grown in West Africa, where they hold significant cultural and nutritional value. Over the years, production has steadily increased, driven by improvements in farming techniques, seed availability, and local consumption. Despite Nigeria’s dominance, other regions, including parts of Asia and the Caribbean, have seen modest growth in yam cultivation. However, challenges like soil depletion and pests continue to affect yields.
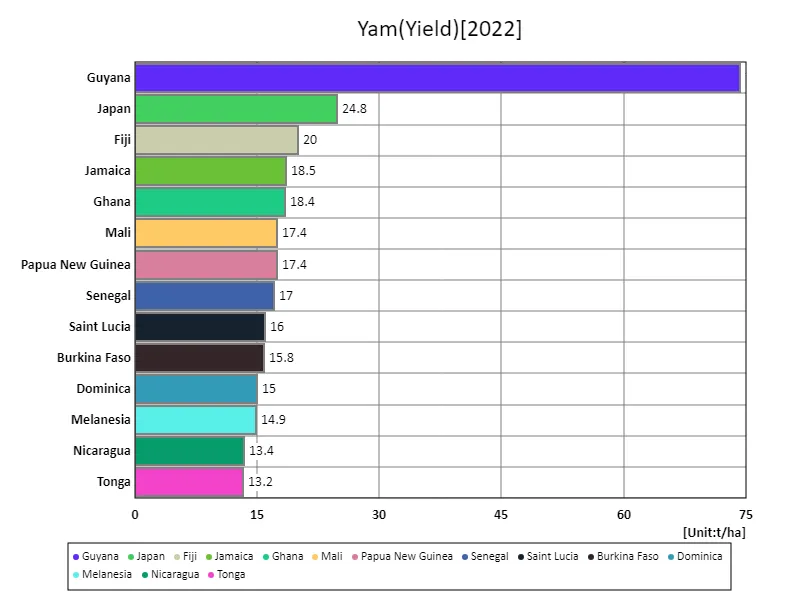
The maximum is 74.3t/ha of Guyana, the average is 10.5t/ha, and the total is 601t/ha
Yam production (continent)
In 2022, global yam production reached a record 88.7 million tonnes, with Africa accounting for the majority at 86.6 million tonnes. This underscores the crop’s central role in the continent’s agriculture, especially in West Africa, where yam is a staple food and vital to local economies. Over the years, yam production has steadily increased due to better agricultural practices, improved access to seeds, and rising demand. While Nigeria remains the largest producer, other African nations are also contributing to growth. Challenges such as pests, soil depletion, and post-harvest losses persist, yet the crop’s cultural and economic importance drives ongoing production expansion.
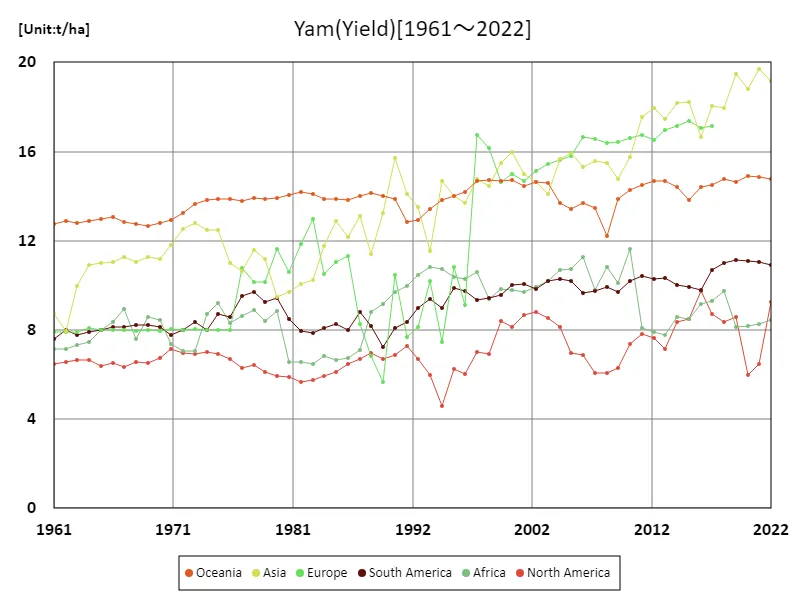
The maximum is 19.7t/ha[2021] of Asia, and the current value is about 97.2%
Yam production (latest year, continent)
In 2022, global yam production reached 88.3 million tonnes, with Africa contributing the largest share at 86.6 million tonnes. This highlights the crop’s significance in the region, especially in West Africa, where it serves as a staple food and a major agricultural product. The global average production was 17.7 million tonnes, reflecting the dominance of African nations in cultivation. Over time, yam production has steadily increased, driven by advancements in farming techniques, greater seed availability, and rising demand. However, challenges such as pests, soil depletion, and post-harvest losses continue to affect yields.
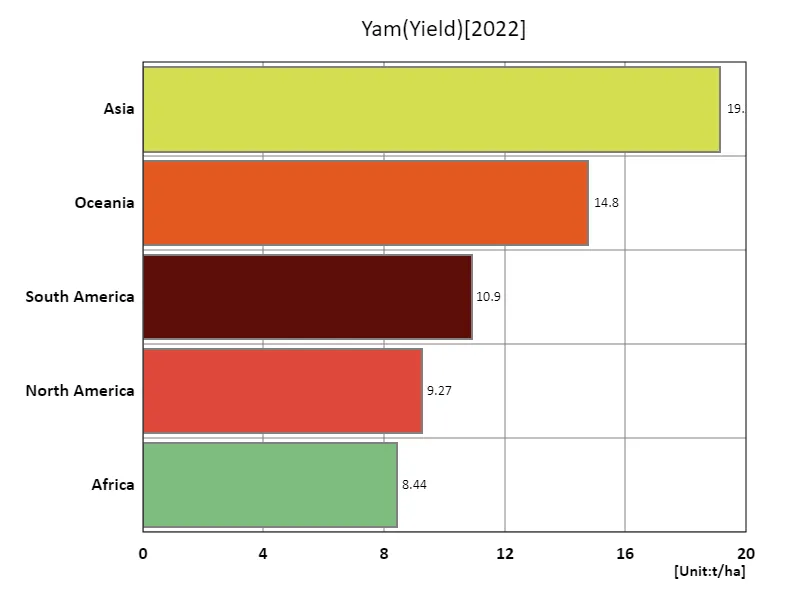
The maximum is 19.2t/ha of Asia, the average is 12.5t/ha, and the total is 62.6t/ha
Main data
| Production(Yam, Yield, t/ha) [t/ha] | ||||||||||
|---|---|---|---|---|---|---|---|---|---|---|
| Guyana | Japan | Eastern Asia | Fiji | Asia | Jamaica | Ghana | Mali | Papua New Guinea | Senegal | |
| 2022 | 74.34 | 24.84 | 24.84 | 20 | 19.16 | 18.46 | 18.42 | 17.39 | 17.36 | 17 |
| 2021 | 67.74 | 25.75 | 25.75 | 19 | 19.71 | 17.97 | 18.65 | 17.68 | 17.46 | 17.38 |
| 2020 | 70.68 | 24.6 | 24.6 | 19 | 18.8 | 17.08 | 17.71 | 17.95 | 17.51 | 17.51 |
| 2019 | 76.44 | 24.22 | 24.22 | 19.27 | 19.47 | 17.65 | 17.51 | 12.89 | 17.12 | 17.65 |
| 2018 | 20.54 | 22.11 | 22.11 | 13.9 | 17.94 | 16.78 | 16.72 | 17.27 | 17.75 | 17.99 |
| 2017 | 76.14 | 22.28 | 22.28 | 14.75 | 18.05 | 16.47 | 17.14 | 16.21 | 17.67 | 19 |
| 2016 | 77.15 | 20.46 | 20.46 | 16.72 | 16.63 | 17.05 | 16.98 | 24.44 | 17.57 | 20 |
| 2015 | 57.91 | 22.45 | 22.45 | 14.44 | 18.22 | 16.05 | 16.96 | 16.15 | 17.5 | 19.02 |
| 2014 | 59.19 | 22.7 | 22.7 | 14.4 | 18.18 | 16.74 | 16.63 | 17.61 | 17.54 | 21 |
| 2013 | 5.51 | 21.74 | 21.74 | 15.55 | 17.46 | 16.55 | 16.78 | 20.58 | 17.5 | |
| 2012 | 5.86 | 22.21 | 22.21 | 14.36 | 17.95 | 17.1 | 15.57 | 21.26 | 17.25 | |
| 2011 | 5.73 | 22.09 | 22.09 | 14.83 | 17.53 | 16.17 | 15.59 | 22.56 | 17.44 | |
| 2010 | 6.28 | 22.7 | 22.7 | 17.89 | 15.77 | 16.81 | 15.48 | 23.49 | 17.11 | |
| 2009 | 7.78 | 21.15 | 21.15 | 11.7 | 14.78 | 16.72 | 15.26 | 20.31 | 16.51 | |
| 2008 | 9.39 | 22.51 | 22.51 | 1.14 | 15.49 | 15.34 | 14.08 | 21.3 | 16.53 | |
| 2007 | 9.62 | 23.08 | 23.08 | 1.82 | 15.59 | 15.64 | 13.52 | 24.99 | 16.76 | |
| 2006 | 9.29 | 22.51 | 22.51 | 2.95 | 15.29 | 16.55 | 13.19 | 25 | 16.5 | |
| 2005 | 9.38 | 23.33 | 23.33 | 2.95 | 15.94 | 15.09 | 10.81 | 16.59 | 16.57 | |
| 2004 | 9.44 | 22.91 | 22.91 | 1.09 | 15.67 | 15.9 | 12.52 | 20.57 | 16.84 | |
| 2003 | 9.52 | 19.99 | 19.99 | 5.43 | 14.08 | 16.59 | 11.86 | 12.8 | 17.06 | |
| 2002 | 9.62 | 20.62 | 20.62 | 6.52 | 14.63 | 16.48 | 13 | 13.21 | 17.5 | |
| 2001 | 9.55 | 20.8 | 20.8 | 6.62 | 14.99 | 16.47 | 12.34 | 10.08 | 17.33 | |
| 2000 | 9.51 | 22.66 | 22.66 | 12.03 | 15.97 | 15.5 | 12.88 | 19.51 | 17.5 | |
| 1999 | 9.33 | 21.75 | 21.75 | 13.34 | 15.5 | 16.38 | 13.39 | 12.24 | 17.51 | |
| 1998 | 9.5 | 20.08 | 20.08 | 17.2 | 14.47 | 15.97 | 12.81 | 2.84 | 17.54 | |
| 1997 | 9.62 | 20.98 | 20.98 | 7.81 | 14.78 | 15.81 | 12.85 | 3.5 | 17.51 | |
| 1996 | 19.45 | 19.45 | 10.28 | 13.69 | 16.9 | 12.78 | 3.71 | 17.5 | ||
| 1995 | 19.77 | 19.77 | 5.4 | 14.01 | 16.8 | 12.07 | 4 | 17.5 | ||
| 1994 | 20.84 | 20.84 | 2.27 | 14.7 | 16.08 | 11.03 | 4.21 | 17.48 | ||
| 1993 | 15.8 | 15.8 | 4.62 | 11.52 | 16.06 | 13.16 | 4.3 | 17.6 | ||
| 1992 | 18.83 | 18.83 | 4.73 | 13.5 | 15.33 | 10.4 | 3.71 | 17.85 | ||
| 1991 | 19.22 | 19.22 | 2.37 | 14.08 | 13.37 | 11.58 | 5.05 | 17.62 | ||
| 1990 | 21.08 | 21.08 | 7.13 | 15.7 | 13.07 | 7.35 | 4.51 | 17.36 | ||
| 1989 | 18.56 | 18.56 | 8.48 | 13.26 | 12.52 | 5.8 | 3.11 | 17.5 | ||
| 1988 | 16.92 | 16.92 | 9.6 | 11.4 | 12.83 | 5.36 | 3.65 | 17.5 | ||
| 1987 | 19.47 | 19.47 | 5.44 | 13.09 | 12.68 | 5.8 | 2.94 | 17.37 | ||
| 1986 | 18.05 | 18.05 | 5.36 | 12.15 | 12.86 | 5.86 | 2.44 | 17.41 | ||
| 1985 | 19.98 | 19.98 | 5 | 12.87 | 12.82 | 5.54 | 2.86 | 17.54 | ||
| 1984 | 19.73 | 19.73 | 8 | 11.76 | 12.65 | 5.28 | 4.61 | 17.35 | ||
| 1983 | 17.12 | 17.12 | 15 | 10.22 | 12.28 | 6.06 | 4 | 17.32 | ||
| 1982 | 18.02 | 18.02 | 14 | 10.05 | 12.37 | 5.3 | 4.05 | 17.12 | ||
| 1981 | 17.43 | 17.43 | 14 | 9.69 | 12.83 | 5.09 | 4.05 | 16.82 | ||
| 1980 | 16.94 | 16.94 | 14 | 9.47 | 12.48 | 5.75 | 4.05 | 16.7 | ||
| 1979 | 19.82 | 19.82 | 14 | 11.18 | 12.62 | 5.73 | 4 | 16.64 | ||
| 1978 | 19.53 | 19.53 | 14 | 11.59 | 11.23 | 5.73 | 3.94 | 16.57 | ||
| 1977 | 18.85 | 18.85 | 0.53 | 10.66 | 10.9 | 6.01 | 4 | 16.5 | ||
| 1976 | 17.59 | 17.59 | 0.6 | 10.98 | 10.79 | 5.75 | 3.93 | 16.44 | ||
| 1975 | 18.48 | 18.48 | 0.63 | 12.48 | 11.23 | 6.06 | 4 | 16.46 | ||
| 1974 | 17.97 | 17.97 | 0.74 | 12.48 | 11.71 | 6.39 | 3.91 | 16.33 | ||
| 1973 | 17.87 | 17.87 | 0.75 | 12.78 | 11.32 | 5.28 | 4.25 | 16.49 | ||
| 1972 | 18.25 | 18.25 | 0.75 | 12.51 | 11.2 | 5.07 | 4.4 | 16.46 | ||
| 1971 | 17.34 | 17.34 | 0.75 | 11.81 | 11.6 | 5.28 | 4.7 | 16.32 | ||
| 1970 | 16.33 | 16.33 | 0.75 | 11.19 | 11.36 | 5.28 | 4.6 | 16.17 | ||
| 1969 | 16.73 | 16.73 | 0.75 | 11.27 | 11.25 | 11.32 | 4.5 | 16.13 | ||
| 1968 | 17 | 17 | 0.75 | 11.05 | 10.89 | 10.39 | 4.45 | 16.11 | ||
| 1967 | 17.78 | 17.78 | 0.72 | 11.28 | 10.85 | 11.45 | 4.35 | 16.32 | ||
| 1966 | 18.38 | 18.38 | 0.79 | 11.03 | 13.06 | 10.05 | 4.25 | 16.24 | ||
| 1965 | 18.95 | 18.95 | 0.79 | 11.02 | 14.66 | 11.11 | 4.15 | 16.22 | ||
| 1964 | 19.38 | 19.38 | 0.79 | 10.9 | 14.64 | 6.74 | 4.05 | 16.25 | ||
| 1963 | 17.14 | 17.14 | 0.79 | 9.97 | 14.67 | 6.78 | 3.85 | 16.28 | ||
| 1962 | 16.88 | 16.88 | 0.79 | 7.95 | 14.57 | 7.33 | 3.7 | 16.67 | ||
| 1961 | 16.88 | 16.88 | 0.8 | 8.73 | 14.31 | 7.33 | 3.5 | 16.57 | ||


Comments