
Abstract
Taiwan’s vegetable production has shown consistent growth, driven by diverse cultivation and efficient land use. Among vegetables, cabbage has traditionally led in production volume, reaching 617 kt in 2022, reflecting its high demand and adaptability to Taiwan’s climate. Tomatoes are another key crop, produced for both fresh consumption and processing, showcasing versatility in uses. Over the years, the balance between production volume and land use efficiency has improved, supported by advancements in agricultural techniques. Notably, leafy greens, including cabbage, dominate due to their short growth cycles and high yield potential, catering to both domestic consumption and export markets.
Production (by vegetables)
Taiwan’s vegetable production has evolved significantly from 1961 to 2022, with cabbage consistently leading as the top crop. In 1999, cabbage production peaked at 758 kt, highlighting its critical role in the market. However, by 2022, production had declined to 81.4% of this peak, reflecting changes in land use, market demand, and agricultural practices. Despite this, cabbage remains a staple due to its adaptability, high yield, and versatility. Overall, production trends show a focus on efficiency and diversification, with leafy greens and high-demand crops maintaining prominence. Advances in technology and shifting consumer preferences continue to shape Taiwan’s vegetable sector.

The maximum is 484kt[1985] of Production volume, and the current value is about 20.7%
Yield(by vegetable)
Tomatoes have been a standout crop in Taiwan’s vegetable production, with a record yield of 43.2 t/ha achieved in 1985. This peak reflected optimal growing conditions and advanced cultivation techniques. However, by 2022, yields had dropped to 54.5% of this level, influenced by factors such as shifting market demands, environmental challenges, and land use changes. Despite the decline, tomatoes remain vital for both fresh consumption and processing, underscoring their economic importance. Over time, Taiwan’s vegetable production has emphasized efficiency and quality, with efforts to adapt to evolving consumer preferences and climate conditions shaping ongoing agricultural practices.
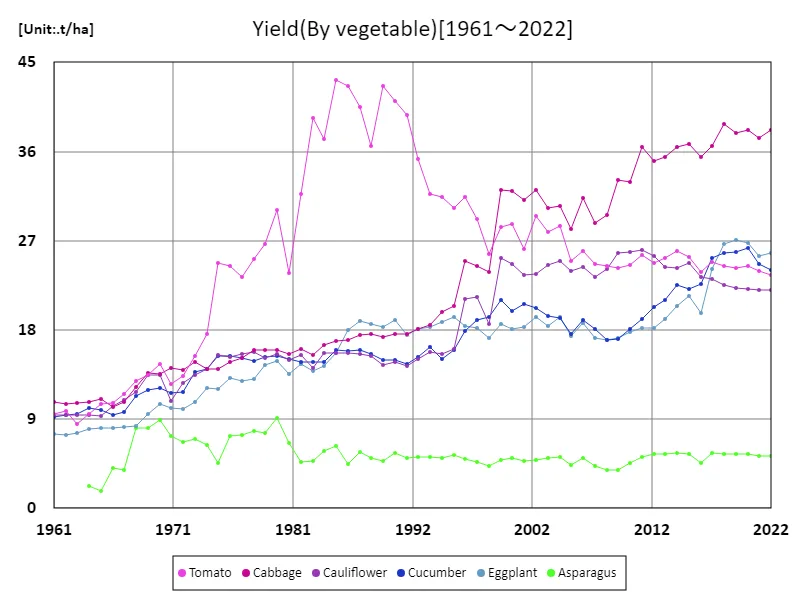
The maximum is 43.2t/ha[1985] of Tomato, and the current value is about 54.5%
Land use (by vegetables)
In 2022, Taiwan’s vegetable production showcased balanced land use, with total production, average production, and the highest production volume all aligning at 99.9 kt. This uniformity reflects efficient agricultural planning and optimized land utilization. Over the years, land use trends have emphasized sustainability and adaptability, with a focus on maximizing output within limited agricultural space. High-demand crops like cabbage and tomatoes dominate cultivated areas, driven by their yield potential and market value. Taiwan’s vegetable sector continues to evolve, leveraging technology and innovation to maintain productivity while addressing environmental and market dynamics.
The maximum is 99.9kt of Production volume, the average is 99.9kt, and the total is 99.9kt
Tomato usage
Tomatoes have played a prominent role in Taiwan’s vegetable production, reaching a record high of 484 kt in 1961—a level that remains unmatched. This peak reflects strong demand for tomatoes, both for fresh consumption and processing. Over the decades, their versatility has solidified their status as a staple crop, despite fluctuations in production. Advances in cultivation techniques have improved quality and efficiency, but environmental factors and shifting market preferences have influenced overall trends. Today, tomatoes continue to be a key crop, balancing historical significance with evolving consumer needs in Taiwan’s dynamic vegetable industry.
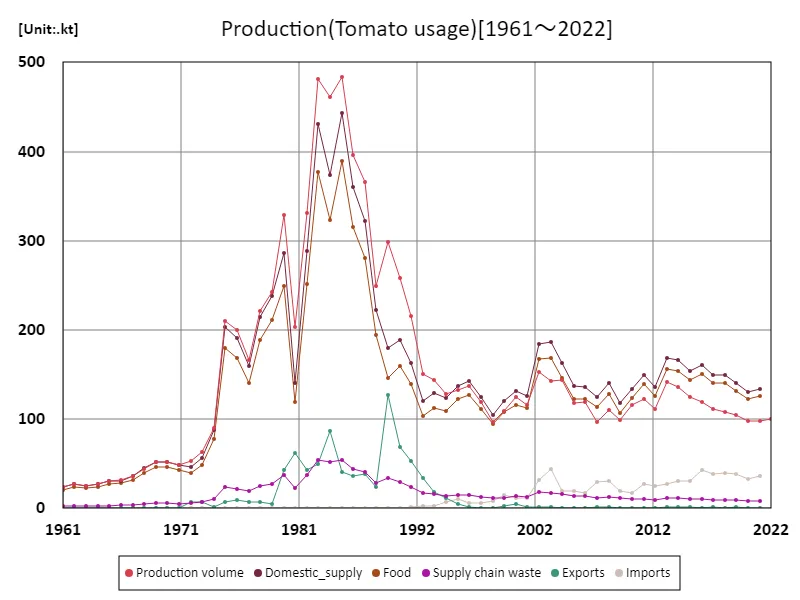
The maximum is 484kt[1985] of Production volume, and the current value is about 20.7%
Main data
| Production(Tomato usage) [kt] | ||||||
|---|---|---|---|---|---|---|
| Domestic_supply | Food | Production volume | Imports | Supply chain waste | Exports | |
| 2022.0 | 99.94 | |||||
| 2021.0 | 134 | 126 | 98.34 | 36 | 8 | |
| 2020.0 | 130 | 122 | 97.6 | 33 | 8 | |
| 2019.0 | 141 | 132 | 104.79 | 38 | 9 | 2 |
| 2018.0 | 149 | 140 | 108.08 | 40 | 9 | |
| 2017.0 | 149 | 140 | 111.13 | 38 | 9 | 1 |
| 2016.0 | 161 | 151 | 118.96 | 43 | 10 | |
| 2015.0 | 154 | 144 | 124.29 | 31 | 10 | 1 |
| 2014.0 | 166 | 154 | 136.07 | 31 | 11 | 1 |
| 2013.0 | 168 | 156 | 141.88 | 27 | 12 | 1 |
| 2012.0 | 136 | 126 | 111.36 | 25 | 9 | |
| 2011.0 | 149 | 139 | 122.87 | 27 | 10 | |
| 2010.0 | 134 | 124 | 116.03 | 17 | 10 | |
| 2009.0 | 118 | 107 | 99.49 | 19 | 12 | |
| 2008.0 | 141 | 128 | 110.66 | 31 | 13 | 1 |
| 2007.0 | 125 | 114 | 96.84 | 29 | 11 | 1 |
| 2006.0 | 136 | 123 | 119.28 | 17 | 14 | |
| 2005.0 | 137 | 123 | 118.42 | 19 | 14 | |
| 2004.0 | 163 | 146 | 143.89 | 19 | 16 | |
| 2003.0 | 186 | 169 | 142.7 | 44 | 17 | 1 |
| 2002.0 | 184 | 167 | 153.08 | 32 | 18 | 1 |
| 2001.0 | 126 | 113 | 116.17 | 11 | 13 | 1 |
| 2000.0 | 131 | 116 | 124.73 | 11 | 14 | 5 |
| 1999.0 | 120 | 108 | 108.55 | 15 | 12 | 3 |
| 1998.0 | 105 | 94 | 96.88 | 8 | 11 | |
| 1997.0 | 125 | 111 | 118.82 | 6 | 13 | |
| 1996.0 | 143 | 127 | 137.39 | 6 | 15 | 1 |
| 1995.0 | 137 | 122 | 132.44 | 10 | 15 | 5 |
| 1994.0 | 124 | 109 | 127.96 | 7 | 14 | 11 |
| 1993.0 | 129 | 113 | 143.69 | 3 | 16 | 18 |
| 1992.0 | 120 | 103 | 151.06 | 3 | 17 | 34 |
| 1991.0 | 163 | 139 | 215.73 | 1 | 24 | 53 |
| 1990.0 | 189 | 160 | 257.92 | 29 | 69 | |
| 1989.0 | 180 | 146 | 299 | 34 | 127 | |
| 1988.0 | 222 | 194 | 249.03 | 28 | 24 | |
| 1987.0 | 322 | 281 | 365.8 | 41 | 39 | |
| 1986.0 | 360 | 315 | 396.2 | 44 | 36 | |
| 1985.0 | 443 | 389 | 483.76 | 54 | 41 | |
| 1984.0 | 374 | 323 | 461.13 | 52 | 87 | |
| 1983.0 | 431 | 377 | 480.95 | 54 | 50 | |
| 1982.0 | 288 | 251 | 331.11 | 37 | 43 | |
| 1981.0 | 141 | 119 | 203.19 | 23 | 62 | |
| 1980.0 | 286 | 249 | 329.23 | 37 | 43 | |
| 1979.0 | 238 | 211 | 243.02 | 27 | 5 | |
| 1978.0 | 214 | 189 | 220.72 | 25 | 7 | |
| 1977.0 | 159 | 140 | 165.92 | 19 | 7 | |
| 1976.0 | 191 | 168 | 199.39 | 22 | 9 | |
| 1975.0 | 203 | 180 | 210.49 | 24 | 7 | |
| 1974.0 | 88 | 78 | 89.69 | 10 | 2 | |
| 1973.0 | 56 | 49 | 63.32 | 7 | 7 | |
| 1972.0 | 46 | 40 | 52.68 | 6 | 7 | |
| 1971.0 | 48 | 43 | 48.34 | 5 | ||
| 1970.0 | 52 | 46 | 52.2 | 6 | ||
| 1969.0 | 52 | 46 | 52.04 | 6 | ||
| 1968.0 | 45 | 40 | 44.55 | 5 | ||
| 1967.0 | 36 | 32 | 35.96 | 4 | ||
| 1966.0 | 31 | 28 | 31.31 | 4 | ||
| 1965.0 | 31 | 27 | 30.91 | 3 | ||
| 1964.0 | 27 | 24 | 27.23 | 3 | ||
| 1963.0 | 25 | 23 | 25.46 | 3 | ||
| 1962.0 | 27 | 24 | 27.09 | 3 | ||
| 1961.0 | 24 | 21 | 24.17 | 3 | ||

Comments