
Abstract
Strawberry production has seen significant growth globally, with China leading as the largest producer, reaching 3.36 million tons in 2022. This dominance can be attributed to favorable climatic conditions, extensive agricultural land, and advancements in farming techniques. Historically, the United States, particularly California, has been a major player in strawberry production, known for its high-quality varieties and robust export market. Over the years, trends have shifted towards increasing greenhouse cultivation and the adoption of sustainable practices to enhance yield and reduce environmental impact. Consumer demand for fresh, locally sourced strawberries continues to drive innovation and diversification in production methods worldwide.
Strawberry production (worldwide)
Strawberry production has evolved significantly from 1961 to 2022, with China emerging as the leading producer, achieving a peak of 3.36 million tons in 2022. This marked a dramatic increase driven by technological advancements, improved agricultural practices, and extensive investment in infrastructure. China’s focus on high-yield varieties and greenhouse cultivation has enabled consistent output growth, reaching full capacity at this peak. Historically, other countries like the U.S. and Mexico also contributed significantly to global production, but China’s rapid rise reflects shifting dynamics in agricultural dominance. Trends indicate a growing emphasis on sustainability, with a focus on reducing pesticide use and enhancing soil health to meet increasing consumer demand for organic and locally sourced strawberries.
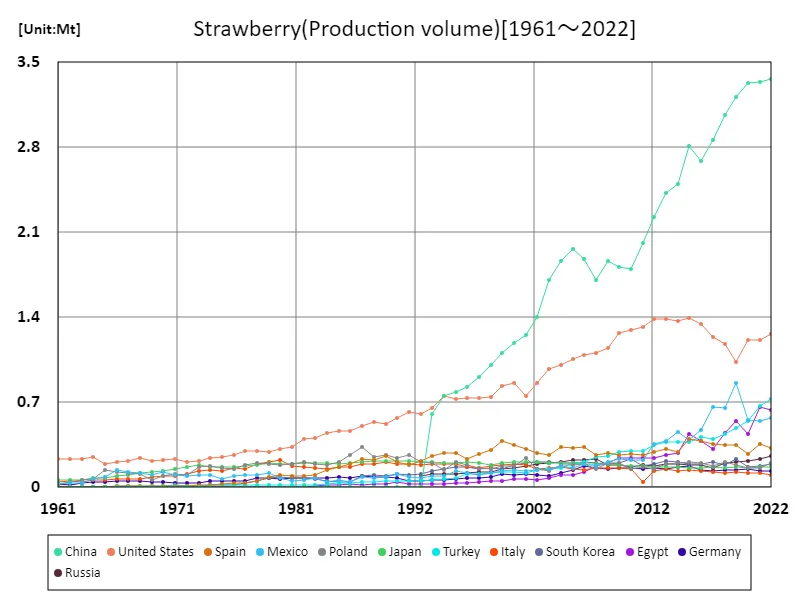
The maximum is the latest one, 3.36Mt of China
Strawberry production (latest year, countries around the world)
In 2022, global strawberry production reached a total of 9.57 million tons, with China leading at 3.36 million tons, marking its peak output. This production surge reflects China’s significant investments in modern agricultural techniques, including greenhouse cultivation and high-yield varieties. The average production across other countries was about 120,000 tons, highlighting the concentration of output in a few key players. Historically, countries like the U.S. and Mexico have also been major contributors, but China’s rapid growth indicates a shift in global agricultural dynamics. Overall, trends show increasing consumer demand for fresh and organic strawberries, prompting a focus on sustainable farming practices and diversification in production methods.
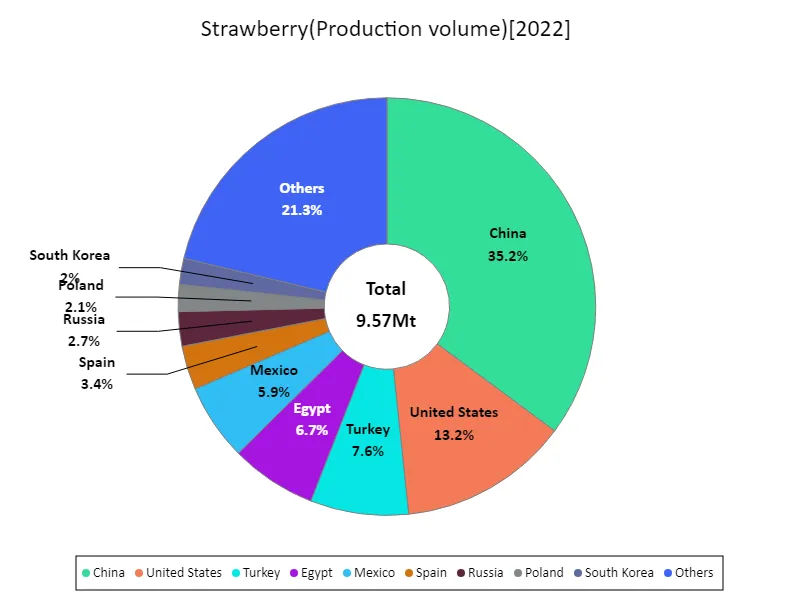
The maximum is 3.36Mt of China, the average is 120kt, and the total is 9.57Mt
Strawberry production (continent)
In 2022, global strawberry production reached an impressive total of 9.57 million tons, with Asia accounting for a maximum of 4.59 million tons. This dominance is primarily driven by China’s substantial output, reflecting advancements in agricultural technology and investment in high-yield cultivation practices. The trend towards greenhouse farming has enhanced productivity, enabling countries in the region to meet rising consumer demand for fresh and high-quality strawberries. Additionally, the increasing preference for organic produce is shaping farming practices, promoting sustainability and reduced chemical use. Overall, Asia’s growth in strawberry production highlights a significant shift in global agricultural dynamics, with an emphasis on innovation and quality.
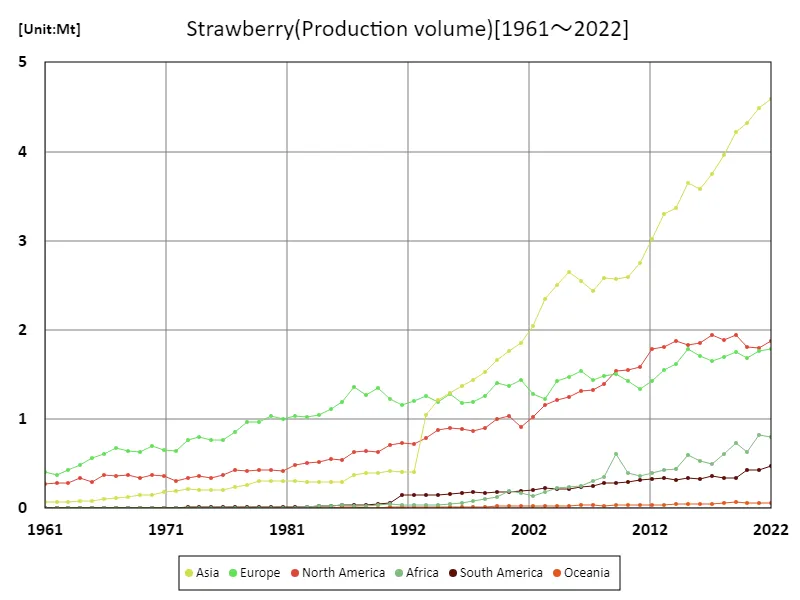
The maximum is the latest one, 4.59Mt of Asia
Strawberry production (latest year, continent)
In 2022, global strawberry production reached a total of 9.57 million tons, with Asia leading at 4.59 million tons. This figure underscores the region’s growing dominance in the market, driven primarily by China’s innovative farming practices and investments in technology. The average production across other regions was 1.59 million tons, indicating a concentration of output within Asia. Trends show a significant shift towards greenhouse cultivation and high-yield varieties, responding to rising consumer demand for fresh, high-quality strawberries. Additionally, there is an increasing emphasis on sustainability, with producers adopting organic farming methods to meet the preferences of health-conscious consumers.
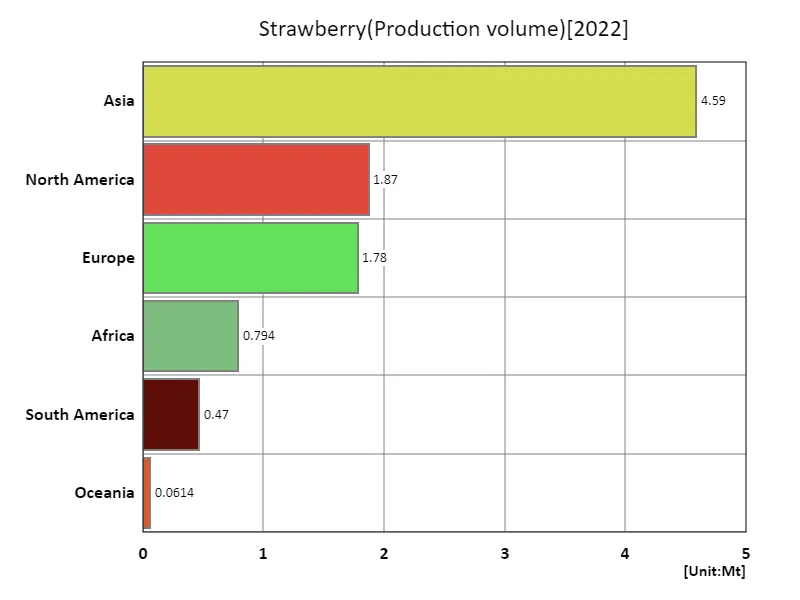
The maximum is 4.59Mt of Asia, the average is 1.59Mt, and the total is 9.57Mt
Main data
| Production(Strawberry, Production volume, t) [Mt] | ||||||||||
|---|---|---|---|---|---|---|---|---|---|---|
| World | Upper-middle-income countries | Asia | Eastern Asia | China | High-income countries | Americas | North America | Europe | Northern America | |
| 2022 | 9.57 | 5.54 | 4.59 | 3.72 | 3.36 | 3.1 | 2.34 | 1.87 | 1.78 | 1.29 |
| 2021 | 9.36 | 5.38 | 4.48 | 3.68 | 3.34 | 3.02 | 2.23 | 1.8 | 1.76 | 1.24 |
| 2020 | 8.94 | 5.23 | 4.32 | 3.65 | 3.33 | 2.94 | 2.24 | 1.81 | 1.68 | 1.23 |
| 2019 | 9.05 | 5.25 | 4.22 | 3.61 | 3.21 | 2.94 | 2.28 | 1.94 | 1.75 | 1.06 |
| 2018 | 8.56 | 4.84 | 3.97 | 3.41 | 3.07 | 2.98 | 2.23 | 1.88 | 1.7 | 1.21 |
| 2017 | 8.25 | 4.58 | 3.75 | 3.23 | 2.86 | 3.04 | 2.3 | 1.94 | 1.65 | 1.27 |
| 2016 | 8.06 | 4.21 | 3.58 | 3.04 | 2.69 | 3.17 | 2.19 | 1.86 | 1.71 | 1.37 |
| 2015 | 8.24 | 4.24 | 3.65 | 3.16 | 2.81 | 3.28 | 2.17 | 1.83 | 1.78 | 1.42 |
| 2014 | 7.66 | 3.93 | 3.37 | 2.87 | 2.5 | 3.14 | 2.19 | 1.87 | 1.61 | 1.39 |
| 2013 | 7.46 | 3.81 | 3.3 | 2.81 | 2.43 | 3.08 | 2.15 | 1.8 | 1.55 | 1.41 |
| 2012 | 6.99 | 3.52 | 3.02 | 2.58 | 2.23 | 2.97 | 2.11 | 1.78 | 1.42 | 1.41 |
| 2011 | 6.39 | 3.14 | 2.75 | 2.36 | 2.02 | 2.79 | 1.9 | 1.58 | 1.34 | 1.34 |
| 2010 | 6.3 | 2.88 | 2.59 | 2.21 | 1.8 | 2.92 | 1.85 | 1.55 | 1.43 | 1.31 |
| 2009 | 6.54 | 2.9 | 2.57 | 2.2 | 1.81 | 2.93 | 1.82 | 1.54 | 1.5 | 1.29 |
| 2008 | 6.11 | 2.88 | 2.58 | 2.25 | 1.86 | 2.8 | 1.67 | 1.39 | 1.48 | 1.17 |
| 2007 | 5.78 | 2.69 | 2.44 | 2.1 | 1.7 | 2.7 | 1.57 | 1.32 | 1.44 | 1.13 |
| 2006 | 5.93 | 2.84 | 2.55 | 2.28 | 1.88 | 2.76 | 1.55 | 1.32 | 1.54 | 1.11 |
| 2005 | 5.85 | 2.82 | 2.65 | 2.36 | 1.96 | 2.68 | 1.46 | 1.25 | 1.47 | 1.08 |
| 2004 | 5.61 | 2.67 | 2.5 | 2.27 | 1.87 | 2.61 | 1.42 | 1.21 | 1.43 | 1.03 |
| 2003 | 5.16 | 2.46 | 2.34 | 2.11 | 1.7 | 2.41 | 1.38 | 1.16 | 1.22 | 1 |
| 2002 | 4.73 | 2.14 | 2.04 | 1.82 | 1.4 | 2.34 | 1.23 | 1.03 | 1.28 | 0.88 |
| 2001 | 4.58 | 1.91 | 1.85 | 1.67 | 1.26 | 2.4 | 1.1 | 0.91 | 1.44 | 0.78 |
| 2000 | 4.58 | 1.84 | 1.76 | 1.57 | 1.19 | 2.46 | 1.22 | 1.04 | 1.38 | 0.89 |
| 1999 | 4.4 | 1.73 | 1.66 | 1.46 | 1.11 | 2.41 | 1.19 | 1.01 | 1.41 | 0.86 |
| 1998 | 3.98 | 1.57 | 1.52 | 1.34 | 1 | 2.17 | 1.07 | 0.9 | 1.25 | 0.77 |
| 1997 | 3.78 | 1.45 | 1.43 | 1.26 | 0.9 | 2.13 | 1.05 | 0.87 | 1.19 | 0.77 |
| 1996 | 3.7 | 1.38 | 1.37 | 1.21 | 0.83 | 2.13 | 1.06 | 0.89 | 1.19 | 0.77 |
| 1995 | 3.68 | 1.29 | 1.29 | 1.15 | 0.78 | 2.23 | 1.06 | 0.9 | 1.28 | 0.76 |
| 1994 | 3.49 | 1.21 | 1.22 | 1.1 | 0.76 | 2.15 | 1.03 | 0.88 | 1.19 | 0.78 |
| 1993 | 3.29 | 1.06 | 1.05 | 0.95 | 0.61 | 2.1 | 0.94 | 0.79 | 1.26 | 0.69 |
| 1992 | 2.52 | 0.44 | 0.41 | 0.32 | 0 | 1.91 | 0.86 | 0.72 | 1.2 | 0.64 |
| 1991 | 2.49 | 0.46 | 0.4 | 0.32 | 0 | 1.95 | 0.88 | 0.74 | 1.16 | 0.64 |
| 1990 | 2.46 | 0.4 | 0.41 | 0.33 | 0 | 1.97 | 0.76 | 0.71 | 1.23 | 0.6 |
| 1989 | 2.46 | 0.4 | 0.4 | 0.32 | 0 | 1.99 | 0.68 | 0.63 | 1.35 | 0.54 |
| 1988 | 2.38 | 0.37 | 0.39 | 0.33 | 0 | 1.95 | 0.68 | 0.64 | 1.27 | 0.57 |
| 1987 | 2.44 | 0.36 | 0.37 | 0.31 | 0.01 | 2.01 | 0.66 | 0.63 | 1.36 | 0.54 |
| 1986 | 2.1 | 0.3 | 0.3 | 0.25 | 0.01 | 1.74 | 0.57 | 0.54 | 1.19 | 0.49 |
| 1985 | 2.02 | 0.31 | 0.29 | 0.25 | 0.01 | 1.67 | 0.58 | 0.55 | 1.11 | 0.5 |
| 1984 | 1.91 | 0.27 | 0.29 | 0.26 | 0.01 | 1.6 | 0.55 | 0.52 | 1.04 | 0.48 |
| 1983 | 1.87 | 0.3 | 0.3 | 0.27 | 0 | 1.53 | 0.53 | 0.51 | 1.02 | 0.43 |
| 1982 | 1.86 | 0.26 | 0.31 | 0.28 | 1.57 | 0.5 | 0.49 | 1.03 | 0.43 | |
| 1981 | 1.75 | 0.27 | 0.3 | 0.27 | 1.45 | 0.43 | 0.42 | 1 | 0.36 | |
| 1980 | 1.8 | 0.28 | 0.31 | 0.28 | 1.49 | 0.44 | 0.42 | 1.03 | 0.35 | |
| 1979 | 1.73 | 0.28 | 0.3 | 0.27 | 1.42 | 0.45 | 0.43 | 0.97 | 0.31 | |
| 1978 | 1.68 | 0.3 | 0.26 | 0.23 | 1.36 | 0.44 | 0.42 | 0.97 | 0.32 | |
| 1977 | 1.54 | 0.31 | 0.24 | 0.21 | 1.21 | 0.44 | 0.42 | 0.86 | 0.32 | |
| 1976 | 1.36 | 0.25 | 0.21 | 0.19 | 1.09 | 0.38 | 0.37 | 0.76 | 0.28 | |
| 1975 | 1.32 | 0.23 | 0.2 | 0.18 | 1.06 | 0.35 | 0.34 | 0.76 | 0.27 | |
| 1974 | 1.39 | 0.27 | 0.21 | 0.18 | 1.09 | 0.37 | 0.36 | 0.8 | 0.26 | |
| 1973 | 1.34 | 0.27 | 0.22 | 0.2 | 1.04 | 0.35 | 0.34 | 0.77 | 0.23 | |
| 1972 | 1.17 | 0.23 | 0.2 | 0.18 | 0.91 | 0.32 | 0.31 | 0.65 | 0.22 | |
| 1971 | 1.22 | 0.28 | 0.18 | 0.16 | 0.9 | 0.37 | 0.36 | 0.66 | 0.26 | |
| 1970 | 1.23 | 0.32 | 0.15 | 0.14 | 0.88 | 0.38 | 0.37 | 0.69 | 0.24 | |
| 1969 | 1.13 | 0.26 | 0.15 | 0.13 | 0.83 | 0.34 | 0.34 | 0.63 | 0.24 | |
| 1968 | 1.15 | 0.29 | 0.13 | 0.12 | 0.84 | 0.38 | 0.37 | 0.64 | 0.26 | |
| 1967 | 1.16 | 0.29 | 0.12 | 0.11 | 0.84 | 0.37 | 0.36 | 0.68 | 0.23 | |
| 1966 | 1.1 | 0.27 | 0.11 | 0.1 | 0.8 | 0.38 | 0.37 | 0.61 | 0.23 | |
| 1965 | 0.96 | 0.19 | 0.09 | 0.08 | 0.74 | 0.3 | 0.29 | 0.57 | 0.21 | |
| 1964 | 0.91 | 0.17 | 0.08 | 0.08 | 0.72 | 0.34 | 0.34 | 0.48 | 0.27 | |
| 1963 | 0.79 | 0.14 | 0.07 | 0.06 | 0.63 | 0.28 | 0.28 | 0.43 | 0.25 | |
| 1962 | 0.74 | 0.12 | 0.07 | 0.06 | 0.6 | 0.29 | 0.28 | 0.38 | 0.25 | |
| 1961 | 0.75 | 0.14 | 0.07 | 0.06 | 0.59 | 0.27 | 0.27 | 0.41 | 0.24 | |


Comments