
Abstract
In terms of banana crop production, Turkey’s 70.2t/ha in 2022 is a noteworthy figure. This achievement suggests that Turkey has high technology and experience in banana cultivation and has developed effective agricultural policies. Meanwhile, other major banana producing countries are affected by different factors. For example, Latin American countries such as Ecuador and Colombia boast high production volumes due to favorable climatic conditions and soil suitability, and have large plantations. On the other hand, some countries in Africa and Asia face challenges such as a lack of technology and infrastructure, as well as climate change, limiting production. Under these circumstances, global demand for bananas remains stable, and producing countries are focusing on developing sustainable production methods and market strategies to remain competitive. In the future, the banana industry will continue to evolve toward sustainable growth, with environmental considerations and technological innovation being given importance.
Banana production (worldwide)
Banana production has fluctuated greatly over the past 60 years. In 1995, Indonesia recorded an astounding figure of 77.6 t/ha, which was the peak. Since then, production has declined and is currently at 63.2% of the peak. This fluctuation is due to various factors. For example, changes in climatic conditions, advances in agricultural technology, and fluctuations in market demand. In addition, banana cultivation requires land and water resources, and problems with the supply and management of these may also have an impact. On the other hand, bananas are an important food crop worldwide, and demand has been steadily increasing. Therefore, despite fluctuations in production, banana cultivation remains an important industry in many countries. In the future, sustainable cultivation methods and technological innovations that meet market needs will be important.
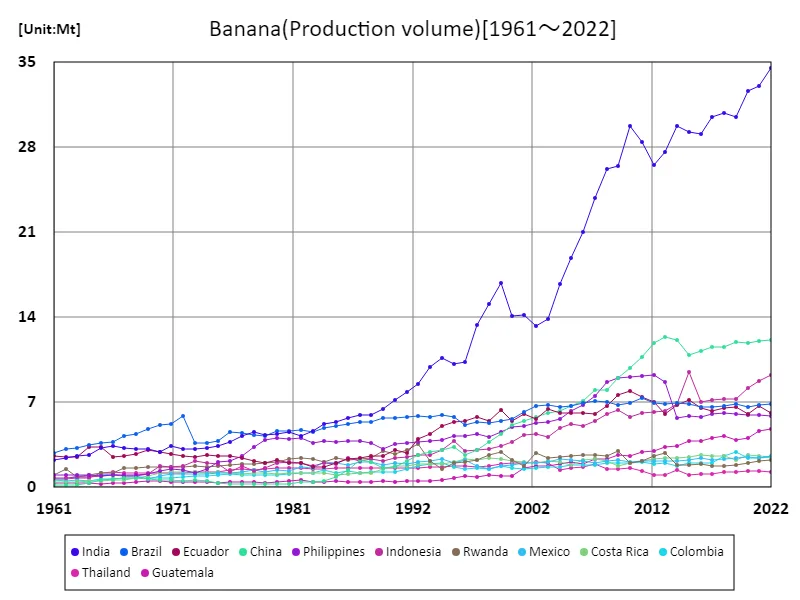
The maximum is the latest one, 34.5Mt of India
Banana production (latest year, countries around the world)
In 2022, Turkey recorded a high banana production of 70.2 t/ha, with an overall average of 21.2 t/ha. This shows Turkey’s high technology and effective agricultural policies in banana cultivation. In addition, the overall total production was 2.56 kt/ha, indicating that bananas are an important agricultural crop globally. In the past decades, banana cultivation has been dependent on climatic conditions and soil suitability, and different countries have recorded different production volumes. Some countries have boasted high production volumes, while others have been limited by factors such as lack of technology and infrastructure and climate change. However, the demand for bananas has remained stable, and producing countries are focusing on developing sustainable production methods and market strategies. In the future, environmental considerations and technological innovation will become even more important, and the banana industry will evolve toward sustainable growth.
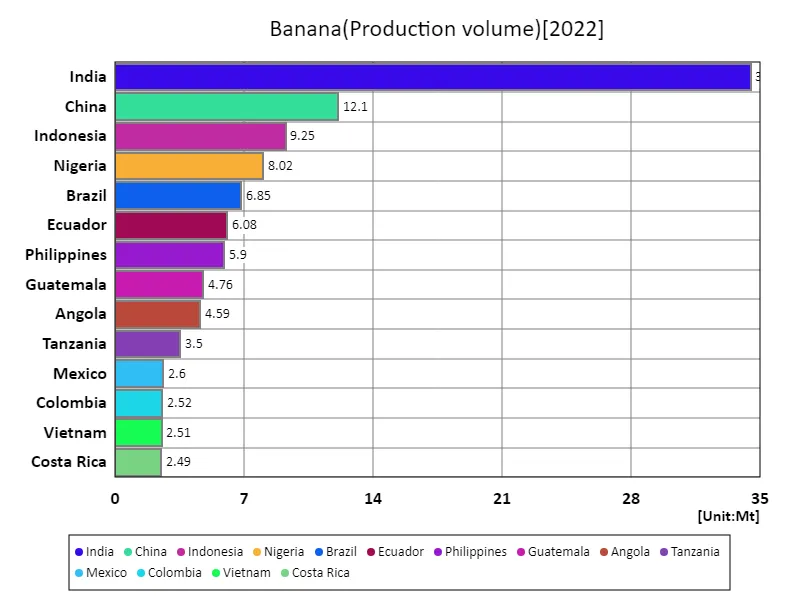
The maximum is 34.5Mt of India, the average is 911kt, and the total is 136Mt
Banana production (continent)
The 2022 banana production data is noteworthy. Of particular note is that Europe recorded the highest overall production, with a high figure of 44.3t/ha. This may reflect the progress of banana cultivation techniques and the effectiveness of agricultural policies in Europe. Historical trends have shown that major banana-producing countries are mainly located in Latin America and Africa, where many areas have favorable climatic conditions and soil suitability. However, Europe’s achievement of the largest production in 2022 suggests that new regions are beginning to play an important role in banana production. This may reflect the expansion of global demand for bananas and the development of new production areas. In the future, it will be important to diversify banana production areas and promote sustainable agriculture.
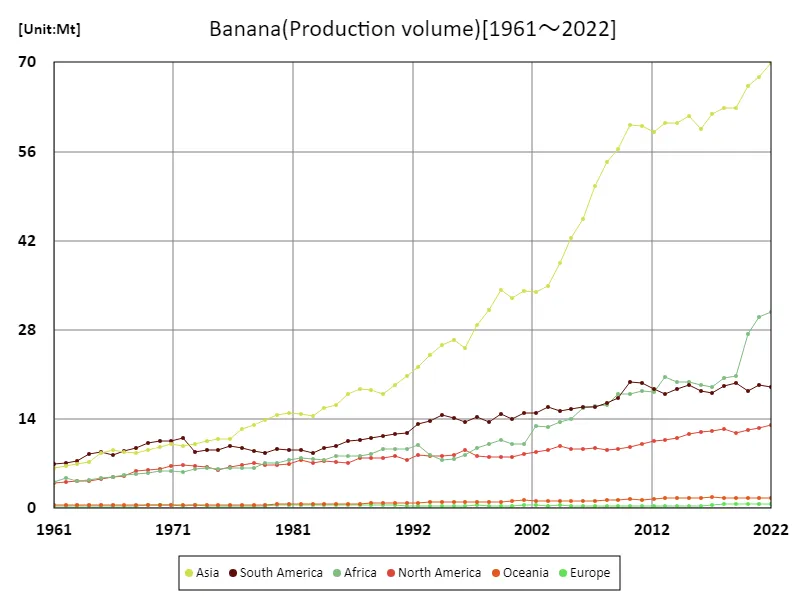
The maximum is the latest one, 70Mt of Asia
Banana production (latest year, continent)
The 2022 banana production data is noteworthy. Of particular note is that North America recorded the highest overall value. The high production of 35.1t/ha suggests the efficiency of banana cultivation in North America and the adoption of advanced technologies. Historically, major banana-producing regions have been mainly in Latin America and Africa, where many areas have favorable climatic conditions and soil suitability. However, North America’s achievement of the largest production in 2022 suggests that new regions are beginning to play an important role in banana production. This reflects the global expansion of demand for bananas and the development of new production areas. The average figure of 24.3t/ha also indicates the high efficiency and productivity of banana cultivation. The total production of 146t/ha reaffirms that bananas are an important food crop globally. In the future, it will become increasingly important to diversify banana production areas and promote sustainable agriculture.
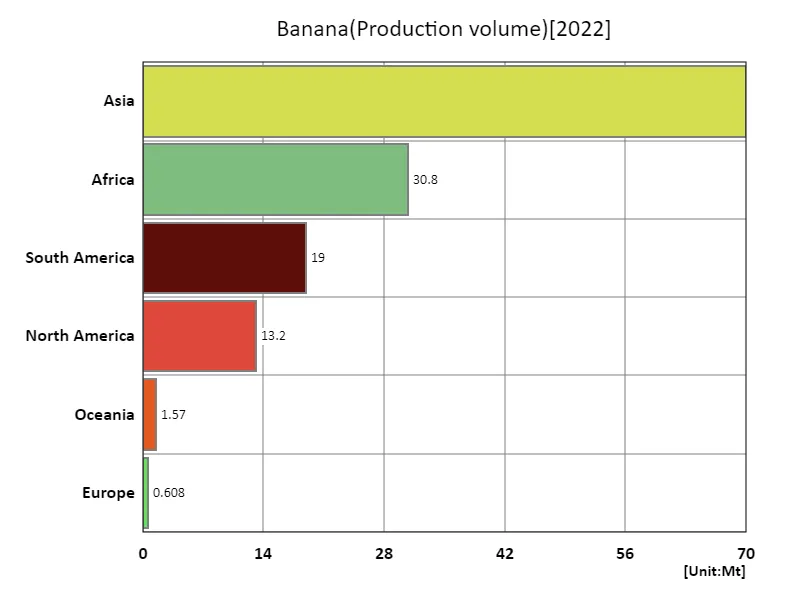
The maximum is 70Mt of Asia, the average is 22.5Mt, and the total is 135Mt
Main data
| Production(Banana, Production volume, t) [Mt] | ||||||||||
|---|---|---|---|---|---|---|---|---|---|---|
| World | Asia | Lower-middle-income countries | Upper-middle-income countries | Southern Asia | India | Americas | Africa | Net Food Importing Developing Countries | South-eastern Asia | |
| 2022 | 135.11 | 69.95 | 69.85 | 54.61 | 36.02 | 34.53 | 32.13 | 30.85 | 29.16 | 20.33 |
| 2021 | 132.08 | 67.75 | 67.26 | 53.88 | 34.48 | 33.06 | 32.01 | 30.03 | 28.73 | 19.83 |
| 2020 | 126.74 | 66.3 | 65.09 | 51.52 | 33.96 | 32.6 | 30.83 | 27.29 | 27.99 | 19.31 |
| 2019 | 117.34 | 62.9 | 56.81 | 51.27 | 31.84 | 30.46 | 31.47 | 20.73 | 26.62 | 18.11 |
| 2018 | 117.2 | 62.85 | 56.68 | 50.88 | 32.15 | 30.81 | 31.68 | 20.43 | 26.5 | 18.24 |
| 2017 | 113.19 | 61.9 | 55.55 | 48.86 | 31.8 | 30.48 | 30.14 | 19.01 | 24.77 | 17.82 |
| 2016 | 111.35 | 59.52 | 54.01 | 48.65 | 30.44 | 29.14 | 30.44 | 19.31 | 24.98 | 17.14 |
| 2015 | 114.39 | 61.61 | 54.35 | 51.46 | 30.48 | 29.22 | 31.03 | 19.78 | 25.32 | 19.56 |
| 2014 | 112 | 60.47 | 54 | 49.13 | 30.95 | 29.72 | 29.7 | 19.81 | 24.91 | 16.78 |
| 2013 | 111.71 | 60.43 | 53.66 | 47.49 | 28.77 | 27.58 | 28.73 | 20.54 | 24.95 | 18.7 |
| 2012 | 108.63 | 59.12 | 52.36 | 47.29 | 27.61 | 26.51 | 29.38 | 18.22 | 22.74 | 19.02 |
| 2011 | 109.99 | 60.07 | 54.16 | 46.93 | 29.62 | 28.46 | 29.79 | 18.4 | 22.78 | 19.1 |
| 2010 | 109.43 | 60.17 | 54.92 | 45.61 | 30.95 | 29.78 | 29.45 | 17.98 | 22.36 | 18.73 |
| 2009 | 102.5 | 56.32 | 50.99 | 42.56 | 27.67 | 26.47 | 26.54 | 17.96 | 20.13 | 19.03 |
| 2008 | 97.88 | 54.29 | 49.22 | 40.24 | 27.45 | 26.22 | 25.67 | 16.28 | 18.41 | 18.21 |
| 2007 | 93.57 | 50.63 | 45.4 | 39.54 | 25.16 | 23.82 | 25.35 | 16 | 18.71 | 16.82 |
| 2006 | 88.03 | 45.42 | 41.59 | 37.85 | 22.2 | 21 | 25.31 | 15.77 | 18.24 | 15.52 |
| 2005 | 83.04 | 42.42 | 37.52 | 37.07 | 20.07 | 18.89 | 25.02 | 14.01 | 16.79 | 15.17 |
| 2004 | 78.79 | 38.54 | 34.35 | 36.08 | 17.75 | 16.74 | 25.06 | 13.55 | 16.36 | 14.03 |
| 2003 | 74.33 | 34.93 | 30.11 | 35.85 | 14.76 | 13.86 | 25.06 | 12.72 | 15.36 | 13.6 |
| 2002 | 72.3 | 34 | 29.3 | 34.44 | 14.21 | 13.3 | 23.64 | 12.99 | 15.51 | 13.55 |
| 2001 | 69.44 | 34.17 | 28 | 34.1 | 15.05 | 14.21 | 23.52 | 10.06 | 12.51 | 13.23 |
| 2000 | 66.6 | 33.02 | 27.4 | 31.53 | 14.95 | 14.14 | 21.97 | 10.06 | 12.45 | 12.56 |
| 1999 | 69.35 | 34.28 | 29.89 | 31.14 | 17.59 | 16.81 | 22.88 | 10.74 | 13.04 | 11.86 |
| 1998 | 64.32 | 31.05 | 28.24 | 28.61 | 15.91 | 15.1 | 21.67 | 10.14 | 12.78 | 11.03 |
| 1997 | 62.17 | 28.8 | 26.44 | 28.31 | 14.12 | 13.34 | 22.54 | 9.39 | 12.48 | 11.2 |
| 1996 | 57.44 | 25.16 | 22.42 | 27.9 | 11.08 | 10.3 | 22.6 | 8.3 | 11.3 | 11.01 |
| 1995 | 58.16 | 26.43 | 21.88 | 29.44 | 10.97 | 10.18 | 22.56 | 7.81 | 10.59 | 11.77 |
| 1994 | 57.47 | 25.69 | 22.24 | 28.79 | 11.48 | 10.69 | 22.86 | 7.59 | 10.63 | 10.76 |
| 1993 | 55.79 | 24.1 | 21.57 | 27.04 | 10.72 | 9.95 | 22.02 | 8.36 | 11.66 | 10.18 |
| 1992 | 55.05 | 22.2 | 20.03 | 26.33 | 9.28 | 8.52 | 21.73 | 9.87 | 13.34 | 10.02 |
| 1991 | 50.62 | 20.74 | 18.94 | 23.51 | 8.59 | 7.85 | 19.38 | 9.27 | 12.29 | 9.69 |
| 1990 | 49.94 | 19.38 | 18.07 | 23.05 | 8.03 | 7.15 | 19.92 | 9.35 | 12.85 | 9.43 |
| 1989 | 47.83 | 17.98 | 16.95 | 21.83 | 7.26 | 6.41 | 19.3 | 9.29 | 12.8 | 8.85 |
| 1988 | 47.24 | 18.54 | 16.88 | 21.94 | 6.81 | 5.99 | 18.95 | 8.54 | 12.19 | 9.39 |
| 1987 | 46.72 | 18.65 | 16.89 | 21.56 | 6.81 | 5.92 | 18.59 | 8.27 | 11.82 | 9.34 |
| 1986 | 45.09 | 17.97 | 16.69 | 20.66 | 6.68 | 5.71 | 17.74 | 8.22 | 11.61 | 9.66 |
| 1985 | 42.51 | 16.13 | 15.93 | 18.69 | 6.22 | 5.39 | 17.02 | 8.24 | 11.41 | 8.86 |
| 1984 | 41.38 | 15.75 | 15.61 | 18.42 | 6.08 | 5.25 | 16.95 | 7.53 | 10.65 | 8.97 |
| 1983 | 39.25 | 14.52 | 14.76 | 16.82 | 5.46 | 4.65 | 15.79 | 7.8 | 11.07 | 8.47 |
| 1982 | 40.54 | 14.82 | 15.06 | 17.76 | 5.06 | 4.22 | 16.76 | 7.83 | 11.31 | 9.17 |
| 1981 | 39.87 | 14.99 | 15.14 | 17.16 | 5.4 | 4.58 | 16.09 | 7.63 | 11.07 | 9.11 |
| 1980 | 39.1 | 14.65 | 14.98 | 17.12 | 5.14 | 4.35 | 16.17 | 7.14 | 10.5 | 9.05 |
| 1979 | 37.55 | 13.83 | 14.52 | 15.96 | 5.02 | 4.27 | 15.61 | 7.09 | 10.52 | 8.35 |
| 1978 | 36.54 | 13.09 | 13.35 | 16.22 | 5.29 | 4.56 | 16.14 | 6.3 | 9.69 | 7.38 |
| 1977 | 36.09 | 12.4 | 12.11 | 16.8 | 4.96 | 4.25 | 16.3 | 6.39 | 9.75 | 6.98 |
| 1976 | 34.33 | 10.8 | 10.97 | 16.4 | 4.46 | 3.76 | 16.31 | 6.26 | 9.47 | 5.94 |
| 1975 | 33.14 | 10.91 | 10.02 | 16.23 | 4.11 | 3.41 | 15.16 | 6.14 | 9.01 | 6.27 |
| 1974 | 33.51 | 10.52 | 10.1 | 16.38 | 3.97 | 3.27 | 15.66 | 6.31 | 9.79 | 5.92 |
| 1973 | 32.87 | 10.14 | 9.61 | 16.19 | 3.86 | 3.17 | 15.57 | 6.17 | 9.84 | 5.56 |
| 1972 | 34.53 | 9.86 | 9.86 | 17.94 | 3.88 | 3.19 | 17.93 | 5.77 | 9.72 | 5.36 |
| 1971 | 34.24 | 10.16 | 9.99 | 17.33 | 4.06 | 3.37 | 17.19 | 5.87 | 9.66 | 5.35 |
| 1970 | 33.14 | 9.63 | 9.23 | 17.14 | 3.58 | 2.9 | 16.69 | 5.79 | 9.46 | 5.28 |
| 1969 | 31.91 | 9.09 | 9.34 | 15.63 | 3.97 | 3.17 | 16.18 | 5.62 | 9.52 | 4.31 |
| 1968 | 30.39 | 8.75 | 9.01 | 14.58 | 3.94 | 3.13 | 15.23 | 5.41 | 9.3 | 3.95 |
| 1967 | 29.13 | 8.89 | 8.91 | 13.89 | 4 | 3.2 | 14.05 | 5.23 | 8.95 | 4 |
| 1966 | 28.09 | 9.08 | 8.8 | 13.51 | 4.22 | 3.41 | 13.24 | 4.84 | 8.28 | 4.08 |
| 1965 | 27.74 | 8.68 | 8.13 | 14 | 3.94 | 3.27 | 13.42 | 4.72 | 7.81 | 4.01 |
| 1964 | 25.62 | 7.33 | 7.54 | 13 | 3.3 | 2.68 | 12.86 | 4.5 | 7.39 | 3.56 |
| 1963 | 23.84 | 7 | 7.23 | 11.93 | 3.11 | 2.6 | 11.71 | 4.25 | 6.95 | 3.6 |
| 1962 | 23.34 | 6.59 | 7.01 | 11.17 | 2.95 | 2.43 | 11.19 | 4.72 | 7.34 | 3.35 |
| 1961 | 22.42 | 6.38 | 6.81 | 10.99 | 2.73 | 2.26 | 11.01 | 4.19 | 6.91 | 3.37 |


Comments