
Abstract
Banana production has seen consistent growth globally, with India leading as the top producer, recording 34.5 million metric tons (Mt) in 2022. Historically, countries in tropical and subtropical regions, such as India, Ecuador, and the Philippines, have dominated banana cultivation due to favorable climates. India’s success stems from its extensive agricultural land and reliance on smallholder farms, contributing to both domestic consumption and exports. Over the years, banana production has been affected by climate change, disease outbreaks like Panama disease, and increasing demand, especially in developing regions, making it a crucial global staple crop.
Banana production (worldwide)
Banana production has steadily increased from 1961 to 2022, with India reaching a record 34.5 million metric tons (Mt) in 2022, marking 100% of its peak. This growth reflects improvements in farming techniques, expansion of cultivation areas, and rising global demand. India has consistently led production, benefiting from its tropical climate and vast agricultural land. Other key producers include China, Ecuador, and the Philippines. Trends show that despite challenges like climate change and disease, particularly Panama disease, global output has been resilient. Bananas remain a staple food, driving ongoing production increases, especially in developing regions.
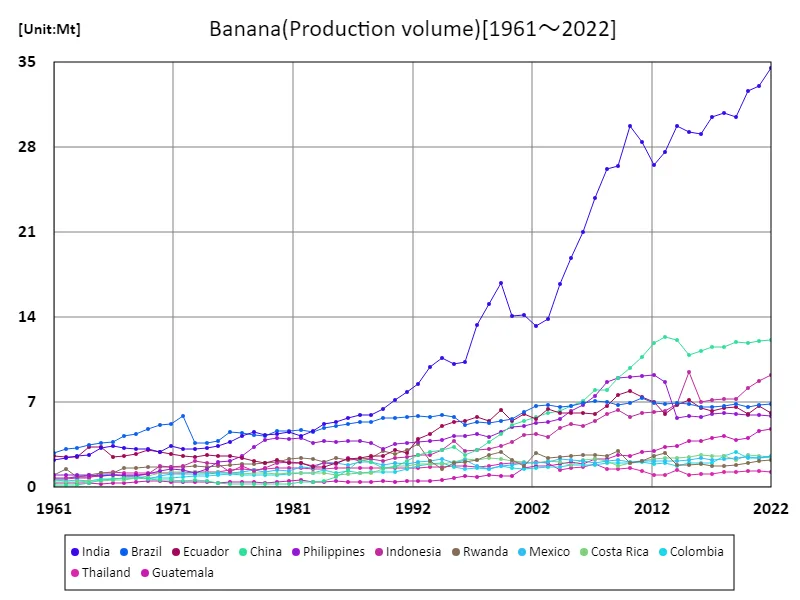
The maximum is the latest one, 34.5Mt of India
Banana production (latest year, world)
In 2022, global banana production reached 136 million metric tons (Mt), with India leading at 34.5Mt. The average production among banana-growing countries was 908,000 tons (kt), highlighting a significant disparity between leading producers and smaller contributors. Over time, banana output has seen steady growth due to rising global demand, particularly in tropical regions. While large producers like India, China, and Ecuador dominate the market, smaller countries contribute notably to regional trade. Despite challenges such as climate change and disease threats like Panama disease, bananas remain a key global crop, with production continuing to expand.
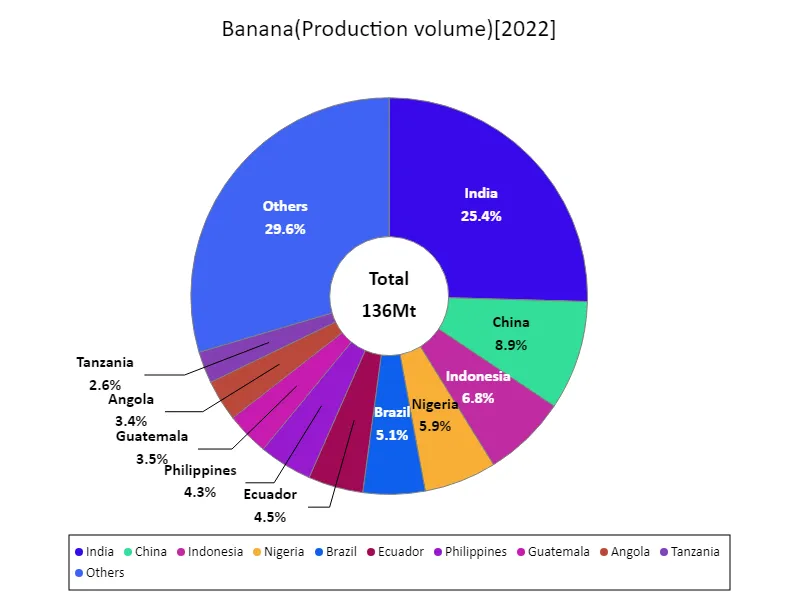
The maximum is 34.5Mt of India, the average is 911kt, and the total is 136Mt
Banana production (continent)
In 2022, Asia led global banana production with 70 million metric tons (Mt), representing over half of the world’s total output. This dominance is driven by top producers like India and China, benefiting from favorable climates and extensive agricultural infrastructure. Asian countries have consistently increased production to meet both domestic and international demand. Trends show sustained growth in the region despite challenges such as disease outbreaks and climate-related impacts. Asia’s role in global banana supply remains crucial, with continuous innovation in farming practices helping to maintain high output and secure its leadership position in the industry.
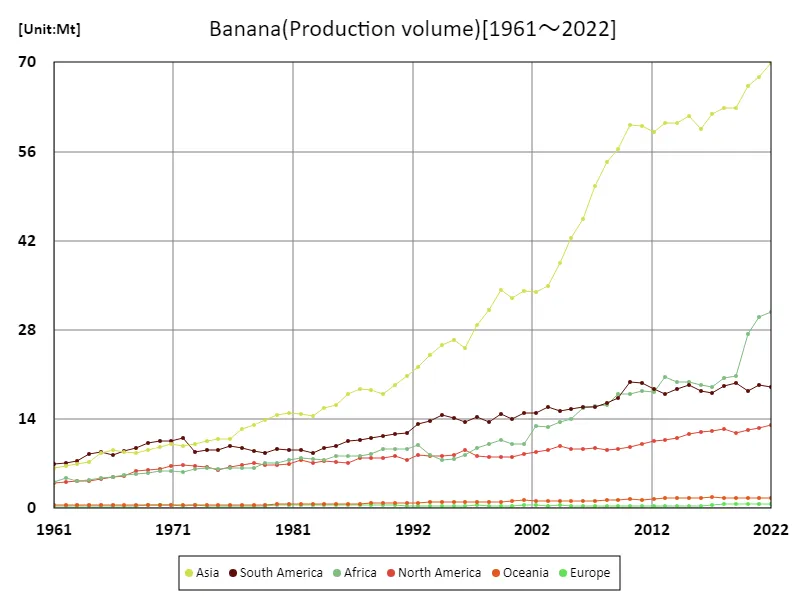
The maximum is the latest one, 70Mt of Asia
Banana production (latest year, continent)
In 2022, global banana production totaled 135 million metric tons (Mt), with Asia leading at 70Mt. The regional average was 22.5Mt, reflecting Asia’s dominance in banana cultivation, driven by major producers like India and China. Over time, the global banana market has grown steadily due to rising consumption, especially in developing countries. Key characteristics include Asia’s large-scale production and tropical climate advantages. Despite challenges such as plant diseases and climate change, the industry has shown resilience, with innovations in farming techniques and increasing demand driving continued growth.
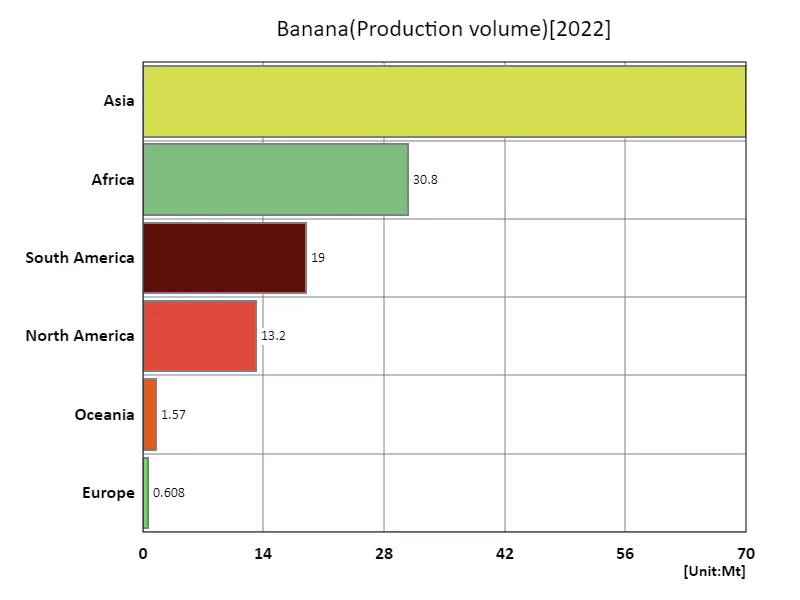
The maximum is 70Mt of Asia, the average is 22.5Mt, and the total is 135Mt
Main data
| Production(Banana, Production volume, t) [Mt] | ||||||||||
|---|---|---|---|---|---|---|---|---|---|---|
| World | Asia | Lower-middle-income countries | Upper-middle-income countries | Southern Asia | India | Americas | Africa | Net Food Importing Developing Countries | South-eastern Asia | |
| 2022 | 135.11 | 69.95 | 69.85 | 54.61 | 36.02 | 34.53 | 32.13 | 30.85 | 29.16 | 20.33 |
| 2021 | 132.08 | 67.75 | 67.26 | 53.88 | 34.48 | 33.06 | 32.01 | 30.03 | 28.73 | 19.83 |
| 2020 | 126.74 | 66.3 | 65.09 | 51.52 | 33.96 | 32.6 | 30.83 | 27.29 | 27.99 | 19.31 |
| 2019 | 117.34 | 62.9 | 56.81 | 51.27 | 31.84 | 30.46 | 31.47 | 20.73 | 26.62 | 18.11 |
| 2018 | 117.2 | 62.85 | 56.68 | 50.88 | 32.15 | 30.81 | 31.68 | 20.43 | 26.5 | 18.24 |
| 2017 | 113.19 | 61.9 | 55.55 | 48.86 | 31.8 | 30.48 | 30.14 | 19.01 | 24.77 | 17.82 |
| 2016 | 111.35 | 59.52 | 54.01 | 48.65 | 30.44 | 29.14 | 30.44 | 19.31 | 24.98 | 17.14 |
| 2015 | 114.39 | 61.61 | 54.35 | 51.46 | 30.48 | 29.22 | 31.03 | 19.78 | 25.32 | 19.56 |
| 2014 | 112 | 60.47 | 54 | 49.13 | 30.95 | 29.72 | 29.7 | 19.81 | 24.91 | 16.78 |
| 2013 | 111.71 | 60.43 | 53.66 | 47.49 | 28.77 | 27.58 | 28.73 | 20.54 | 24.95 | 18.7 |
| 2012 | 108.63 | 59.12 | 52.36 | 47.29 | 27.61 | 26.51 | 29.38 | 18.22 | 22.74 | 19.02 |
| 2011 | 109.99 | 60.07 | 54.16 | 46.93 | 29.62 | 28.46 | 29.79 | 18.4 | 22.78 | 19.1 |
| 2010 | 109.43 | 60.17 | 54.92 | 45.61 | 30.95 | 29.78 | 29.45 | 17.98 | 22.36 | 18.73 |
| 2009 | 102.5 | 56.32 | 50.99 | 42.56 | 27.67 | 26.47 | 26.54 | 17.96 | 20.13 | 19.03 |
| 2008 | 97.88 | 54.29 | 49.22 | 40.24 | 27.45 | 26.22 | 25.67 | 16.28 | 18.41 | 18.21 |
| 2007 | 93.57 | 50.63 | 45.4 | 39.54 | 25.16 | 23.82 | 25.35 | 16 | 18.71 | 16.82 |
| 2006 | 88.03 | 45.42 | 41.59 | 37.85 | 22.2 | 21 | 25.31 | 15.77 | 18.24 | 15.52 |
| 2005 | 83.04 | 42.42 | 37.52 | 37.07 | 20.07 | 18.89 | 25.02 | 14.01 | 16.79 | 15.17 |
| 2004 | 78.79 | 38.54 | 34.35 | 36.08 | 17.75 | 16.74 | 25.06 | 13.55 | 16.36 | 14.03 |
| 2003 | 74.33 | 34.93 | 30.11 | 35.85 | 14.76 | 13.86 | 25.06 | 12.72 | 15.36 | 13.6 |
| 2002 | 72.3 | 34 | 29.3 | 34.44 | 14.21 | 13.3 | 23.64 | 12.99 | 15.51 | 13.55 |
| 2001 | 69.44 | 34.17 | 28 | 34.1 | 15.05 | 14.21 | 23.52 | 10.06 | 12.51 | 13.23 |
| 2000 | 66.6 | 33.02 | 27.4 | 31.53 | 14.95 | 14.14 | 21.97 | 10.06 | 12.45 | 12.56 |
| 1999 | 69.35 | 34.28 | 29.89 | 31.14 | 17.59 | 16.81 | 22.88 | 10.74 | 13.04 | 11.86 |
| 1998 | 64.32 | 31.05 | 28.24 | 28.61 | 15.91 | 15.1 | 21.67 | 10.14 | 12.78 | 11.03 |
| 1997 | 62.17 | 28.8 | 26.44 | 28.31 | 14.12 | 13.34 | 22.54 | 9.39 | 12.48 | 11.2 |
| 1996 | 57.44 | 25.16 | 22.42 | 27.9 | 11.08 | 10.3 | 22.6 | 8.3 | 11.3 | 11.01 |
| 1995 | 58.16 | 26.43 | 21.88 | 29.44 | 10.97 | 10.18 | 22.56 | 7.81 | 10.59 | 11.77 |
| 1994 | 57.47 | 25.69 | 22.24 | 28.79 | 11.48 | 10.69 | 22.86 | 7.59 | 10.63 | 10.76 |
| 1993 | 55.79 | 24.1 | 21.57 | 27.04 | 10.72 | 9.95 | 22.02 | 8.36 | 11.66 | 10.18 |
| 1992 | 55.05 | 22.2 | 20.03 | 26.33 | 9.28 | 8.52 | 21.73 | 9.87 | 13.34 | 10.02 |
| 1991 | 50.62 | 20.74 | 18.94 | 23.51 | 8.59 | 7.85 | 19.38 | 9.27 | 12.29 | 9.69 |
| 1990 | 49.94 | 19.38 | 18.07 | 23.05 | 8.03 | 7.15 | 19.92 | 9.35 | 12.85 | 9.43 |
| 1989 | 47.83 | 17.98 | 16.95 | 21.83 | 7.26 | 6.41 | 19.3 | 9.29 | 12.8 | 8.85 |
| 1988 | 47.24 | 18.54 | 16.88 | 21.94 | 6.81 | 5.99 | 18.95 | 8.54 | 12.19 | 9.39 |
| 1987 | 46.72 | 18.65 | 16.89 | 21.56 | 6.81 | 5.92 | 18.59 | 8.27 | 11.82 | 9.34 |
| 1986 | 45.09 | 17.97 | 16.69 | 20.66 | 6.68 | 5.71 | 17.74 | 8.22 | 11.61 | 9.66 |
| 1985 | 42.51 | 16.13 | 15.93 | 18.69 | 6.22 | 5.39 | 17.02 | 8.24 | 11.41 | 8.86 |
| 1984 | 41.38 | 15.75 | 15.61 | 18.42 | 6.08 | 5.25 | 16.95 | 7.53 | 10.65 | 8.97 |
| 1983 | 39.25 | 14.52 | 14.76 | 16.82 | 5.46 | 4.65 | 15.79 | 7.8 | 11.07 | 8.47 |
| 1982 | 40.54 | 14.82 | 15.06 | 17.76 | 5.06 | 4.22 | 16.76 | 7.83 | 11.31 | 9.17 |
| 1981 | 39.87 | 14.99 | 15.14 | 17.16 | 5.4 | 4.58 | 16.09 | 7.63 | 11.07 | 9.11 |
| 1980 | 39.1 | 14.65 | 14.98 | 17.12 | 5.14 | 4.35 | 16.17 | 7.14 | 10.5 | 9.05 |
| 1979 | 37.55 | 13.83 | 14.52 | 15.96 | 5.02 | 4.27 | 15.61 | 7.09 | 10.52 | 8.35 |
| 1978 | 36.54 | 13.09 | 13.35 | 16.22 | 5.29 | 4.56 | 16.14 | 6.3 | 9.69 | 7.38 |
| 1977 | 36.09 | 12.4 | 12.11 | 16.8 | 4.96 | 4.25 | 16.3 | 6.39 | 9.75 | 6.98 |
| 1976 | 34.33 | 10.8 | 10.97 | 16.4 | 4.46 | 3.76 | 16.31 | 6.26 | 9.47 | 5.94 |
| 1975 | 33.14 | 10.91 | 10.02 | 16.23 | 4.11 | 3.41 | 15.16 | 6.14 | 9.01 | 6.27 |
| 1974 | 33.51 | 10.52 | 10.1 | 16.38 | 3.97 | 3.27 | 15.66 | 6.31 | 9.79 | 5.92 |
| 1973 | 32.87 | 10.14 | 9.61 | 16.19 | 3.86 | 3.17 | 15.57 | 6.17 | 9.84 | 5.56 |
| 1972 | 34.53 | 9.86 | 9.86 | 17.94 | 3.88 | 3.19 | 17.93 | 5.77 | 9.72 | 5.36 |
| 1971 | 34.24 | 10.16 | 9.99 | 17.33 | 4.06 | 3.37 | 17.19 | 5.87 | 9.66 | 5.35 |
| 1970 | 33.14 | 9.63 | 9.23 | 17.14 | 3.58 | 2.9 | 16.69 | 5.79 | 9.46 | 5.28 |
| 1969 | 31.91 | 9.09 | 9.34 | 15.63 | 3.97 | 3.17 | 16.18 | 5.62 | 9.52 | 4.31 |
| 1968 | 30.39 | 8.75 | 9.01 | 14.58 | 3.94 | 3.13 | 15.23 | 5.41 | 9.3 | 3.95 |
| 1967 | 29.13 | 8.89 | 8.91 | 13.89 | 4 | 3.2 | 14.05 | 5.23 | 8.95 | 4 |
| 1966 | 28.09 | 9.08 | 8.8 | 13.51 | 4.22 | 3.41 | 13.24 | 4.84 | 8.28 | 4.08 |
| 1965 | 27.74 | 8.68 | 8.13 | 14 | 3.94 | 3.27 | 13.42 | 4.72 | 7.81 | 4.01 |
| 1964 | 25.62 | 7.33 | 7.54 | 13 | 3.3 | 2.68 | 12.86 | 4.5 | 7.39 | 3.56 |
| 1963 | 23.84 | 7 | 7.23 | 11.93 | 3.11 | 2.6 | 11.71 | 4.25 | 6.95 | 3.6 |
| 1962 | 23.34 | 6.59 | 7.01 | 11.17 | 2.95 | 2.43 | 11.19 | 4.72 | 7.34 | 3.35 |
| 1961 | 22.42 | 6.38 | 6.81 | 10.99 | 2.73 | 2.26 | 11.01 | 4.19 | 6.91 | 3.37 |


Comments