
Abstract
As of 2022, Jordan has the highest melon production in world agriculture at 64.3 tons/hectare. Looking at past trends, melon production is heavily influenced by climatic conditions and technological innovation. For example, warm regions are more likely to have an environment suitable for melon growth, and high yields are expected. In addition, advances in agricultural technology have improved the efficient use of fertilizer and water, pest management, and other areas, improving productivity. On the other hand, issues such as water and climate shortages and declining soil quality are affecting production in some regions. In addition, changes in agricultural policies and market demand are also affecting melon production, making it important to cultivate varieties that meet demand and to develop export strategies. Overall, melon production varies greatly depending on regional environmental conditions, technological levels, and market needs, and the adoption of sustainable agricultural practices is becoming increasingly important in the future.
Melon production (worldwide)
Looking at data from 1961 to 2022, melon production has fluctuated. In 1980, Puerto Rico achieved an astounding production of 482 tons/hectare, but since then, it has been on the decline. Compared to the peak, Puerto Rico’s current production has fallen to 2.73%. This fluctuation is due to multiple factors. One is due to improvements in agricultural techniques and cultivation methods. At the peak, Puerto Rico introduced advanced agricultural techniques and achieved high yields. However, in subsequent eras, production has declined due to technological advances and lack of investment. Climate change and poor weather have also affected production. In tropical regions like Puerto Rico, climatic conditions are suitable for melon growth, but extreme weather events and changes in temperature affect the yield. In addition, changes in agricultural policies and market demand have also affected production. The combination of these factors has caused melon production to fluctuate. In the future, it is expected that the adoption of sustainable agricultural practices and adaptation to climate change will play an important role in stabilizing and improving production.
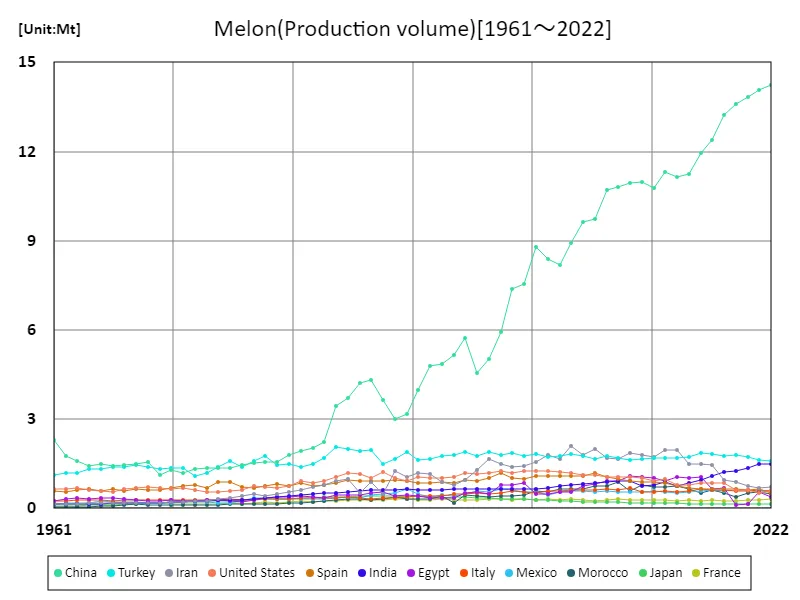
The maximum is the latest one, 14.3Mt of China
Melon production (latest year, world)
Data on the 2022 production of melons reveals several characteristics and trends. First, Jordan recorded the highest production of 64.3 tons/hectare, which indicates that high yields are achieved through suitable climatic conditions and the introduction of agricultural technologies. On the other hand, the overall average of 20.3 tons/hectare suggests that production varies between regions and that some regions have not achieved high yields. In addition, the total of 1.91 kilotons/hectare suggests that melon production is relatively small. This may be because melons tend to be grown in certain regions, with limited production areas compared to other major grains and vegetables. Furthermore, the difference in production is likely due to differences in climatic conditions, agricultural infrastructure, and policies in each region. The spread of sustainable agricultural practices and the promotion of technological innovation may contribute to improving production in each region. In summary, melon production varies by region, and the introduction of appropriate agricultural policies and technologies is necessary to achieve high yields.
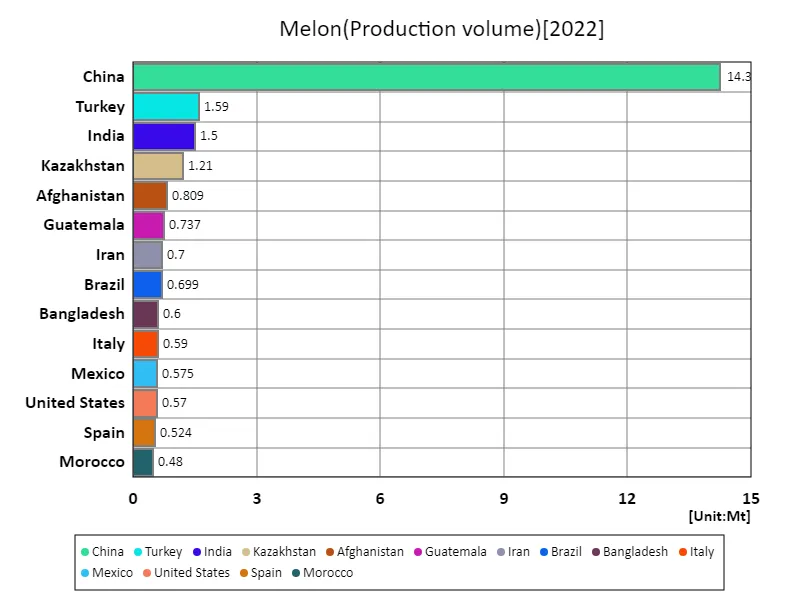
The maximum is 14.3Mt of China, the average is 264kt, and the total is 28.6Mt
Melon production (continent)
From the data on the production of agricultural melons in 2022, several features emerge. First, it is noteworthy that Oceania recorded the largest production of 39.2 tons/hectare, which is the highest value ever. This achievement is likely due to improvements in agricultural techniques and cultivation methods in the Oceania region, favorable climatic conditions, and the introduction of effective agricultural policies. In addition, since the current value is the highest ever, melon production in Oceania may be steadily expanding. This trend is likely due to increased demand, improved access to markets, and the spread of sustainable agricultural practices. On the other hand, since specific data is not provided on the production volume of other regions, it is difficult to grasp the trends in regions other than Oceania, but it is assumed that differences in climatic conditions and agricultural infrastructure in each region affect the production volume. In summary, melon production is increasing in regions including Oceania, and the promotion of sustainable agriculture and technological innovation contribute to this.
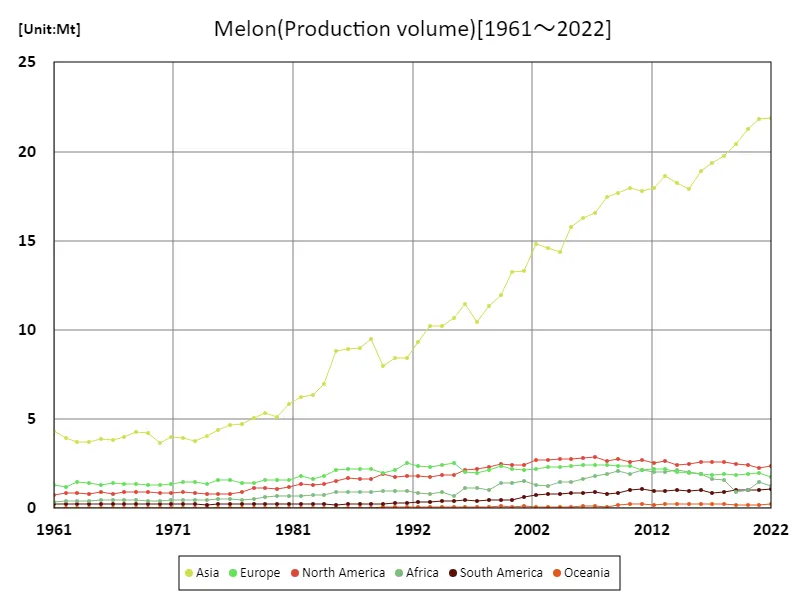
The maximum is the latest one, 21.9Mt of Asia
Melon production (latest year, continent)
Based on the 2022 melon production data, several interesting features emerge. First, it is noteworthy that Oceania recorded the largest production of 30.6 tons/hectare, the highest value overall. Oceania’s high production suggests that the region has suitable climatic conditions for melon cultivation and employs effective agricultural techniques. In addition, the average of 24.6 tons/hectare suggests that high-yield melons are grown in multiple regions, including Oceania. This suggests that improved agricultural productivity, improved varieties, and proper water management are being implemented. In addition, the overall production of 148 kilotons/hectare suggests that melons are produced widely and are in demand globally. However, there are variations in production from region to region, which is likely due to differences in climatic conditions, soil, and agricultural techniques. In summary, the production of melons in 2022 was confirmed to be a crop in global demand, with high yields recorded mainly in Oceania.
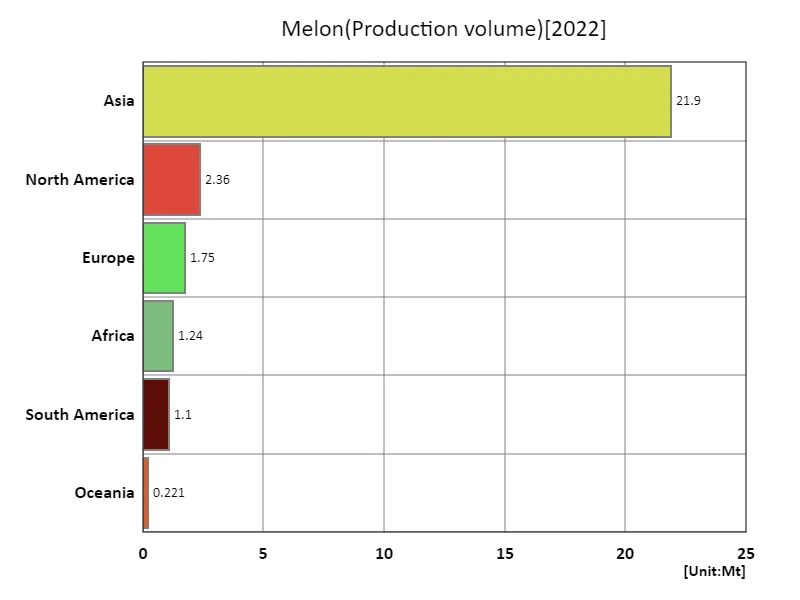
The maximum is 21.9Mt of Asia, the average is 4.76Mt, and the total is 28.6Mt
Main data
| Production(Melon, Production volume, t) [Mt] | ||||||||||
|---|---|---|---|---|---|---|---|---|---|---|
| World | Asia | Upper-middle-income countries | Eastern Asia | China | Lower-middle-income countries | Southern Asia | Americas | Net Food Importing Developing Countries | High-income countries | |
| 2022 | 28.56 | 21.9 | 20.05 | 14.68 | 14.25 | 4.33 | 3.61 | 3.46 | 3.27 | 2.99 |
| 2021 | 28.73 | 21.81 | 20.01 | 14.51 | 14.07 | 4.36 | 3.35 | 3.27 | 3.3 | 3.12 |
| 2020 | 27.91 | 21.28 | 19.72 | 14.22 | 13.84 | 3.84 | 3.3 | 3.46 | 2.8 | 3.11 |
| 2019 | 26.9 | 20.4 | 19.36 | 13.98 | 13.59 | 3.63 | 2.85 | 3.5 | 2.22 | 3.08 |
| 2018 | 27 | 19.76 | 18.59 | 13.59 | 13.22 | 4.35 | 2.85 | 3.51 | 2.74 | 3.35 |
| 2017 | 26.63 | 19.34 | 17.65 | 12.8 | 12.4 | 4.72 | 3.3 | 3.49 | 2.89 | 3.46 |
| 2016 | 26.62 | 18.88 | 17.47 | 12.35 | 11.95 | 4.89 | 3.19 | 3.61 | 3.22 | 3.45 |
| 2015 | 25.63 | 17.92 | 16.61 | 11.66 | 11.26 | 4.93 | 2.92 | 3.42 | 3.18 | 3.47 |
| 2014 | 26.08 | 18.21 | 16.56 | 11.55 | 11.13 | 5.46 | 3.28 | 3.46 | 3.29 | 3.48 |
| 2013 | 26.72 | 18.64 | 16.5 | 11.73 | 11.3 | 5.63 | 3.51 | 3.6 | 3.23 | 4.05 |
| 2012 | 25.9 | 17.94 | 16.05 | 11.22 | 10.77 | 5.43 | 3.26 | 3.54 | 3.33 | 3.91 |
| 2011 | 25.99 | 17.77 | 15.89 | 11.42 | 10.97 | 5.47 | 3.25 | 3.76 | 3.6 | 4.05 |
| 2010 | 26.09 | 17.95 | 15.62 | 11.44 | 10.93 | 5.49 | 3.65 | 3.61 | 3.37 | 4.31 |
| 2009 | 25.95 | 17.7 | 15.48 | 11.37 | 10.82 | 5.36 | 3.46 | 3.61 | 3.47 | 4.34 |
| 2008 | 25.36 | 17.45 | 15.17 | 11.26 | 10.71 | 5.23 | 3.35 | 3.44 | 3.21 | 4.37 |
| 2007 | 24.79 | 16.58 | 14.36 | 10.26 | 9.72 | 5.26 | 3.5 | 3.83 | 2.97 | 4.51 |
| 2006 | 24.16 | 16.29 | 14.11 | 10.18 | 9.63 | 4.92 | 3.28 | 3.67 | 2.74 | 4.52 |
| 2005 | 23.33 | 15.76 | 13.43 | 9.49 | 8.92 | 4.9 | 3.32 | 3.64 | 2.52 | 4.57 |
| 2004 | 21.8 | 14.35 | 12.33 | 8.8 | 8.19 | 4.46 | 2.8 | 3.56 | 2.48 | 4.64 |
| 2003 | 21.74 | 14.57 | 12.41 | 9 | 8.37 | 4.28 | 2.9 | 3.5 | 2.3 | 4.61 |
| 2002 | 21.86 | 14.8 | 12.79 | 9.45 | 8.8 | 4.09 | 2.63 | 3.45 | 2.2 | 4.62 |
| 2001 | 20.11 | 13.32 | 11.18 | 8.25 | 7.56 | 4.09 | 2.43 | 3.04 | 2.29 | 4.56 |
| 2000 | 19.85 | 13.27 | 10.96 | 8.15 | 7.39 | 3.95 | 2.43 | 2.87 | 2.12 | 4.68 |
| 1999 | 18.77 | 11.97 | 9.54 | 6.68 | 5.94 | 4.12 | 2.61 | 2.92 | 2.21 | 4.85 |
| 1998 | 17.4 | 11.34 | 8.61 | 5.77 | 5.02 | 3.94 | 2.75 | 2.8 | 1.87 | 4.56 |
| 1997 | 16.29 | 10.45 | 7.96 | 5.32 | 4.56 | 3.65 | 2.39 | 2.62 | 1.84 | 4.42 |
| 1996 | 17.34 | 11.47 | 9.29 | 6.5 | 5.74 | 3.33 | 2.02 | 2.59 | 1.89 | 4.47 |
| 1995 | 16.25 | 10.65 | 8.52 | 5.96 | 5.16 | 2.65 | 1.84 | 2.3 | 1.39 | 4.82 |
| 1994 | 15.95 | 10.24 | 8.14 | 5.56 | 4.84 | 2.93 | 1.93 | 2.29 | 1.6 | 4.61 |
| 1993 | 15.56 | 10.24 | 7.71 | 5.49 | 4.78 | 3.07 | 2.21 | 2.1 | 1.43 | 4.53 |
| 1992 | 14.82 | 9.34 | 6.91 | 4.68 | 3.97 | 3.12 | 2.23 | 2.14 | 1.46 | 4.54 |
| 1991 | 14.1 | 8.43 | 6.28 | 3.86 | 3.18 | 3.05 | 2.08 | 2.12 | 1.52 | 4.53 |
| 1990 | 13.66 | 8.42 | 5.96 | 3.72 | 3.02 | 3.25 | 2.28 | 2.05 | 1.56 | 4.21 |
| 1989 | 13.16 | 7.98 | 6.24 | 4.34 | 3.63 | 2.45 | 1.47 | 2.17 | 1.52 | 4.21 |
| 1988 | 14.53 | 9.47 | 7.24 | 4.99 | 4.33 | 2.77 | 1.88 | 1.89 | 1.42 | 4.23 |
| 1987 | 14.03 | 8.97 | 7.01 | 4.86 | 4.22 | 2.43 | 1.51 | 1.89 | 1.5 | 4.29 |
| 1986 | 14.02 | 8.94 | 6.68 | 4.26 | 3.7 | 2.73 | 1.86 | 1.93 | 1.35 | 4.27 |
| 1985 | 13.62 | 8.8 | 6.48 | 4 | 3.43 | 2.63 | 1.8 | 1.73 | 1.34 | 4.16 |
| 1984 | 11.14 | 6.95 | 4.74 | 2.81 | 2.22 | 2.39 | 1.7 | 1.59 | 1.22 | 3.73 |
| 1983 | 10.31 | 6.36 | 4.3 | 2.6 | 2.04 | 2.24 | 1.53 | 1.52 | 1.21 | 3.39 |
| 1982 | 10.36 | 6.24 | 4.15 | 2.53 | 1.92 | 2.06 | 1.4 | 1.6 | 1.12 | 3.72 |
| 1981 | 9.56 | 5.83 | 4.01 | 2.3 | 1.8 | 1.91 | 1.28 | 1.43 | 1.1 | 3.14 |
| 1980 | 8.8 | 5.15 | 3.6 | 2.08 | 1.56 | 1.72 | 1.1 | 1.37 | 1 | 3.14 |
| 1979 | 8.97 | 5.37 | 3.84 | 2.1 | 1.54 | 1.61 | 1.03 | 1.37 | 0.98 | 3.16 |
| 1978 | 8.48 | 5.09 | 3.66 | 2.02 | 1.52 | 1.54 | 1.06 | 1.42 | 0.84 | 2.97 |
| 1977 | 7.79 | 4.72 | 3.3 | 1.94 | 1.46 | 1.4 | 0.97 | 1.14 | 0.76 | 2.8 |
| 1976 | 7.82 | 4.65 | 3.35 | 1.81 | 1.37 | 1.38 | 0.92 | 1.04 | 0.84 | 2.83 |
| 1975 | 7.58 | 4.41 | 3.13 | 1.77 | 1.35 | 1.34 | 0.87 | 1.02 | 0.87 | 2.8 |
| 1974 | 6.95 | 4.06 | 2.95 | 1.74 | 1.35 | 1.23 | 0.79 | 1.01 | 0.8 | 2.56 |
| 1973 | 6.82 | 3.74 | 2.87 | 1.72 | 1.34 | 1.16 | 0.74 | 1.11 | 0.77 | 2.68 |
| 1972 | 7.09 | 3.96 | 3.01 | 1.57 | 1.2 | 1.11 | 0.7 | 1.16 | 0.76 | 2.76 |
| 1971 | 6.98 | 4.02 | 3.08 | 1.63 | 1.27 | 1.1 | 0.67 | 1.08 | 0.76 | 2.64 |
| 1970 | 6.54 | 3.67 | 2.85 | 1.43 | 1.11 | 1.03 | 0.64 | 1.11 | 0.69 | 2.56 |
| 1969 | 7.1 | 4.22 | 3.37 | 1.84 | 1.55 | 1.01 | 0.64 | 1.14 | 0.68 | 2.57 |
| 1968 | 7.3 | 4.27 | 3.4 | 1.76 | 1.5 | 1.09 | 0.66 | 1.16 | 0.79 | 2.57 |
| 1967 | 6.99 | 4.01 | 3.3 | 1.68 | 1.45 | 1.02 | 0.58 | 1.14 | 0.72 | 2.48 |
| 1966 | 6.71 | 3.82 | 3.28 | 1.63 | 1.43 | 0.96 | 0.54 | 1.04 | 0.68 | 2.38 |
| 1965 | 6.79 | 3.87 | 3.31 | 1.66 | 1.48 | 1 | 0.51 | 1.16 | 0.74 | 2.3 |
| 1964 | 6.67 | 3.74 | 3.13 | 1.58 | 1.41 | 0.95 | 0.51 | 1.09 | 0.68 | 2.43 |
| 1963 | 6.75 | 3.72 | 3.14 | 1.72 | 1.58 | 0.94 | 0.49 | 1.13 | 0.69 | 2.49 |
| 1962 | 6.68 | 3.93 | 3.3 | 1.89 | 1.76 | 0.89 | 0.49 | 1.12 | 0.65 | 2.23 |
| 1961 | 6.99 | 4.35 | 3.69 | 2.42 | 2.3 | 0.8 | 0.47 | 1 | 0.57 | 2.28 |


Comments