
Abstract
Regarding strawberry production in global agriculture, the latest data for 2022 shows that the United States boasts the largest production, achieving an average of 59.3 tons per hectare. This figure is a high level globally, suggesting that the American strawberry industry is strong. On the other hand, such high production is not seen in other countries. This shows that the United States effectively utilizes strawberry production techniques and agricultural infrastructure to achieve high yields. In other parts of the world, production tends to vary due to differences in climatic conditions and soil, as well as differences in agricultural technology levels. For example, strawberries can be grown throughout the year in warm regions and tend to have relatively high production, while in cold regions, seasonal cultivation is the norm, which can limit production. Overall, it appears that some countries, including the United States, are increasing strawberry production due to sustainable agricultural techniques and investments, while other countries are facing challenges in improving techniques and infrastructure. In the future, it is expected that strawberry production in countries around the world will move toward balance through the spread of sustainable agricultural practices and the sharing of techniques.
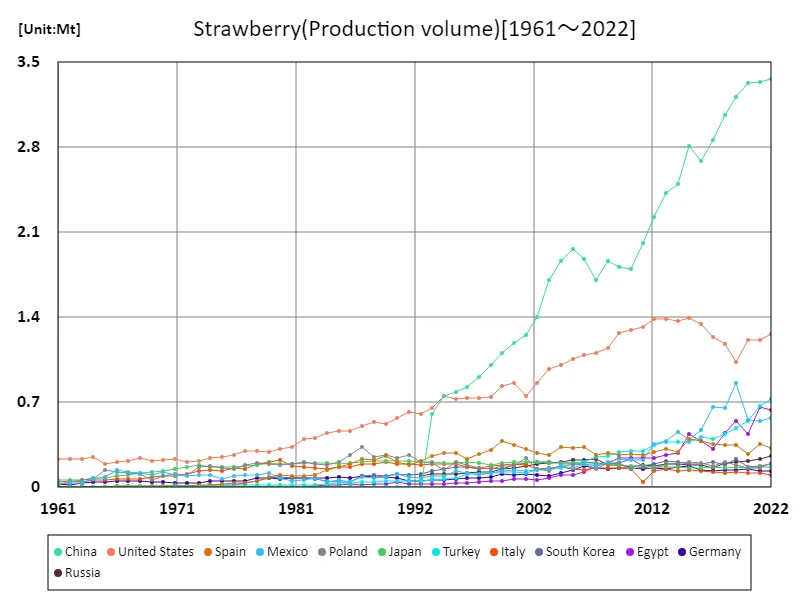
Strawberry production (worldwide)
Looking at data from 1961 to 2022, strawberry production fluctuates. Among them, Morocco achieved an astounding production of 110 tons/hectare in 2009. This was the peak of global strawberry production and shows the strength of Morocco’s strawberry industry. However, current data shows that Morocco’s production has fallen to 43.8% of its peak. This decline is due to various factors. For example, climate change, changes in land use, and changes in agricultural policies may be the cause. In addition, the development and competition of the strawberry industry in other countries may be factors that shake Morocco’s position. On the other hand, there is a certain upward trend in strawberry production worldwide. This is likely due to advances in agricultural technology and increased global demand. However, production may fluctuate in individual countries and regions due to various factors. The spread of sustainable agricultural practices and responses to climate change will be important efforts to stabilize and increase strawberry production in the future.
The maximum is the latest one, 3.36Mt of China
Strawberry production (latest year, countries around the world)
Based on 2022 data on the yield of agricultural strawberries, the Netherlands has the highest average yield, achieving an astounding 60.5 tons per hectare. This shows that the Netherlands is a global leader in strawberry cultivation. Meanwhile, the average yield is 19.3 tons/hectare, reaching a total of 1.51 kilotons/hectare. This suggests that global strawberry production is stable at a certain level, but other countries tend to have lower yields compared to developed countries like the Netherlands. This trend is influenced by differences in climatic conditions, land use, and the degree of development of agricultural technology. For example, countries with warm climates and advanced agricultural infrastructure are more likely to achieve high yields. It is also possible that countries with high demand for strawberries are making efforts to increase production. In the future, the spread of sustainable agricultural practices and the sharing of technologies may lead to an equilibrium in strawberry production around the world. However, there are also challenges such as climate change and resource constraints, and efforts are needed to overcome these.
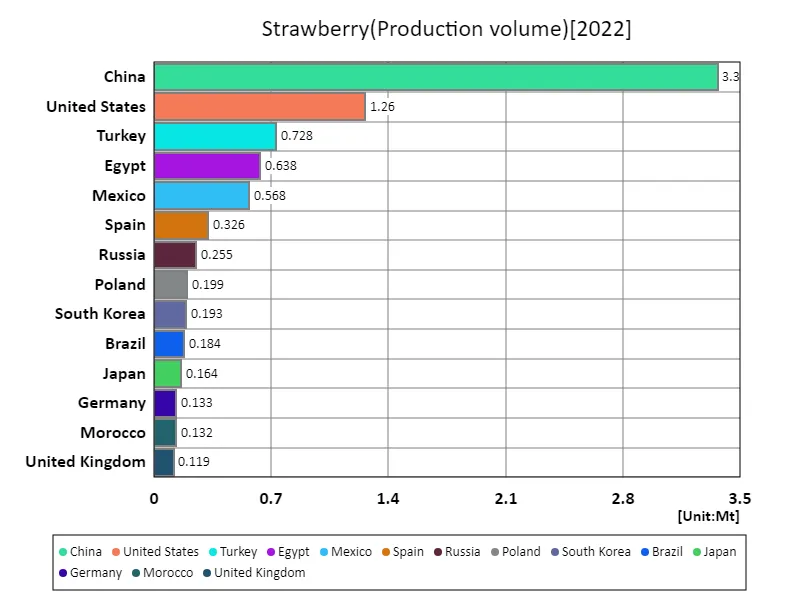
The maximum is 3.36Mt of China, the average is 120kt, and the total is 9.57Mt
Strawberry production (continent)
The 2022 data on strawberry yields is interesting. The largest yield was recorded in Africa, with an astounding figure of 61.6 tons per hectare. This figure shows that Africa has become one of the strawberry production centers globally. The trend so far is that the strawberry industry in Africa has grown steadily and achieved high productivity. This achievement is largely due to the suitability of the region’s climatic conditions and land use, as well as improved agricultural technology. On the other hand, there are notable features about the strawberry yields of other regions and countries. In response to Africa’s success, other regions and countries are also trying to improve production through improvements in agricultural infrastructure and technology. They also face challenges such as climate change and resource constraints, but there are also efforts to address these challenges by disseminating sustainable agricultural practices and sharing technology. Overall, it can be said that strawberry yields are increasing globally, but different factors affect each region. Looking forward, the promotion of sustainable agricultural models and international cooperation will be required. It is expected that this will increase strawberry production to sustainable levels around the world, contributing to food security and economic development.
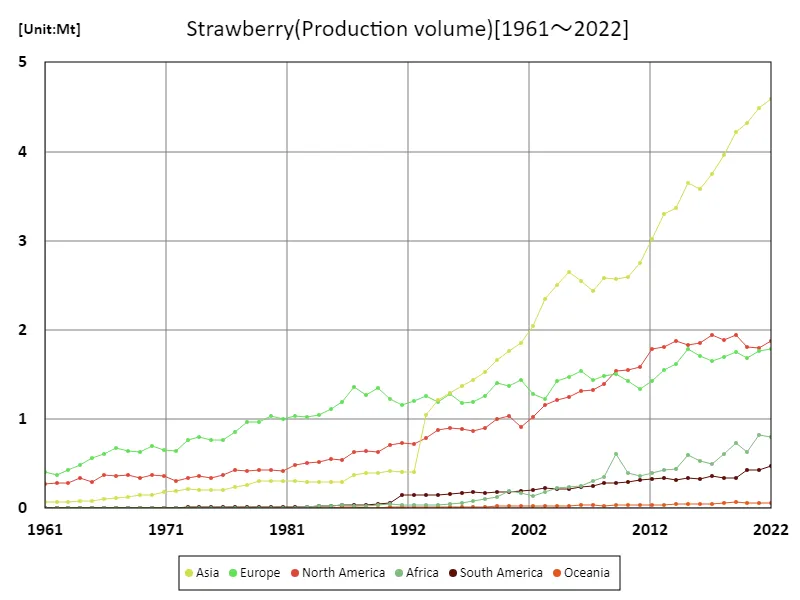
The maximum is the latest one, 4.59Mt of Asia
Strawberry production (latest year, continent)
Looking at the 2022 crop strawberry production data, North America boasts the largest production, achieving a high figure of 49.7 tons per hectare. This shows that North America is the leader in global strawberry production. Meanwhile, the overall average production is 30.3 tons/hectare, totaling 182 kilotons/hectare. This data suggests that strawberry production is stable worldwide and meets demand at a certain level. While North America boasts a high average production, other regions and countries are also focusing on strawberry production. Countries with particularly warm regions and advanced agricultural infrastructure are more likely to achieve high productivity and remain competitive. On the other hand, production may be limited in areas with low climatic conditions and technology levels, but productivity may increase in these regions as sustainable agricultural practices are disseminated and technology is shared. Overall, global strawberry production is stable and well-positioned to meet demand. However, despite challenges such as climate change and resource constraints, sustainable agricultural development and technological innovation are progressing. It is hoped that these efforts will be further promoted in the future, leading to increased, sustainable strawberry production around the world.
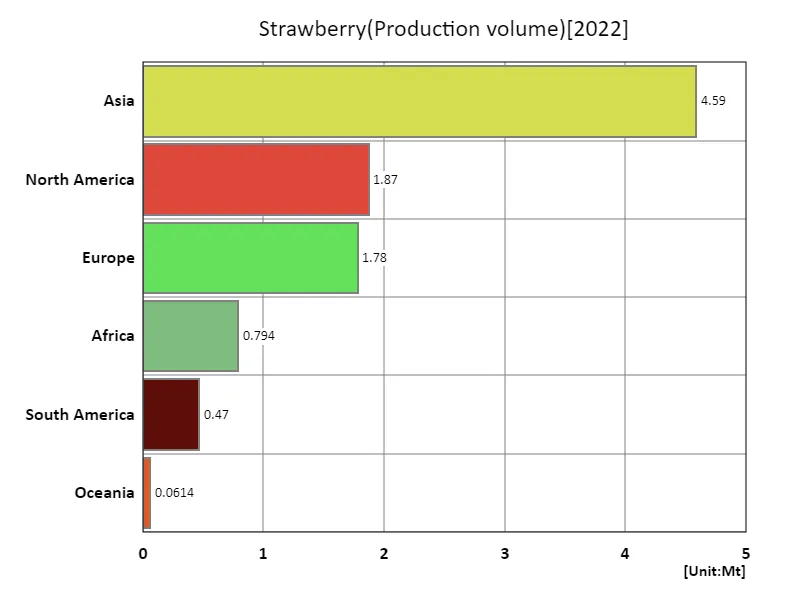
The maximum is 4.59Mt of Asia, the average is 1.59Mt, and the total is 9.57Mt
Main data
| Production(Strawberry, Production volume, t) [Mt] | ||||||||||
|---|---|---|---|---|---|---|---|---|---|---|
| World | Upper-middle-income countries | Asia | Eastern Asia | China | High-income countries | Americas | North America | Europe | Northern America | |
| 2022 | 9.57 | 5.54 | 4.59 | 3.72 | 3.36 | 3.1 | 2.34 | 1.87 | 1.78 | 1.29 |
| 2021 | 9.36 | 5.38 | 4.48 | 3.68 | 3.34 | 3.02 | 2.23 | 1.8 | 1.76 | 1.24 |
| 2020 | 8.94 | 5.23 | 4.32 | 3.65 | 3.33 | 2.94 | 2.24 | 1.81 | 1.68 | 1.23 |
| 2019 | 9.05 | 5.25 | 4.22 | 3.61 | 3.21 | 2.94 | 2.28 | 1.94 | 1.75 | 1.06 |
| 2018 | 8.56 | 4.84 | 3.97 | 3.41 | 3.07 | 2.98 | 2.23 | 1.88 | 1.7 | 1.21 |
| 2017 | 8.25 | 4.58 | 3.75 | 3.23 | 2.86 | 3.04 | 2.3 | 1.94 | 1.65 | 1.27 |
| 2016 | 8.06 | 4.21 | 3.58 | 3.04 | 2.69 | 3.17 | 2.19 | 1.86 | 1.71 | 1.37 |
| 2015 | 8.24 | 4.24 | 3.65 | 3.16 | 2.81 | 3.28 | 2.17 | 1.83 | 1.78 | 1.42 |
| 2014 | 7.66 | 3.93 | 3.37 | 2.87 | 2.5 | 3.14 | 2.19 | 1.87 | 1.61 | 1.39 |
| 2013 | 7.46 | 3.81 | 3.3 | 2.81 | 2.43 | 3.08 | 2.15 | 1.8 | 1.55 | 1.41 |
| 2012 | 6.99 | 3.52 | 3.02 | 2.58 | 2.23 | 2.97 | 2.11 | 1.78 | 1.42 | 1.41 |
| 2011 | 6.39 | 3.14 | 2.75 | 2.36 | 2.02 | 2.79 | 1.9 | 1.58 | 1.34 | 1.34 |
| 2010 | 6.3 | 2.88 | 2.59 | 2.21 | 1.8 | 2.92 | 1.85 | 1.55 | 1.43 | 1.31 |
| 2009 | 6.54 | 2.9 | 2.57 | 2.2 | 1.81 | 2.93 | 1.82 | 1.54 | 1.5 | 1.29 |
| 2008 | 6.11 | 2.88 | 2.58 | 2.25 | 1.86 | 2.8 | 1.67 | 1.39 | 1.48 | 1.17 |
| 2007 | 5.78 | 2.69 | 2.44 | 2.1 | 1.7 | 2.7 | 1.57 | 1.32 | 1.44 | 1.13 |
| 2006 | 5.93 | 2.84 | 2.55 | 2.28 | 1.88 | 2.76 | 1.55 | 1.32 | 1.54 | 1.11 |
| 2005 | 5.85 | 2.82 | 2.65 | 2.36 | 1.96 | 2.68 | 1.46 | 1.25 | 1.47 | 1.08 |
| 2004 | 5.61 | 2.67 | 2.5 | 2.27 | 1.87 | 2.61 | 1.42 | 1.21 | 1.43 | 1.03 |
| 2003 | 5.16 | 2.46 | 2.34 | 2.11 | 1.7 | 2.41 | 1.38 | 1.16 | 1.22 | 1 |
| 2002 | 4.73 | 2.14 | 2.04 | 1.82 | 1.4 | 2.34 | 1.23 | 1.03 | 1.28 | 0.88 |
| 2001 | 4.58 | 1.91 | 1.85 | 1.67 | 1.26 | 2.4 | 1.1 | 0.91 | 1.44 | 0.78 |
| 2000 | 4.58 | 1.84 | 1.76 | 1.57 | 1.19 | 2.46 | 1.22 | 1.04 | 1.38 | 0.89 |
| 1999 | 4.4 | 1.73 | 1.66 | 1.46 | 1.11 | 2.41 | 1.19 | 1.01 | 1.41 | 0.86 |
| 1998 | 3.98 | 1.57 | 1.52 | 1.34 | 1 | 2.17 | 1.07 | 0.9 | 1.25 | 0.77 |
| 1997 | 3.78 | 1.45 | 1.43 | 1.26 | 0.9 | 2.13 | 1.05 | 0.87 | 1.19 | 0.77 |
| 1996 | 3.7 | 1.38 | 1.37 | 1.21 | 0.83 | 2.13 | 1.06 | 0.89 | 1.19 | 0.77 |
| 1995 | 3.68 | 1.29 | 1.29 | 1.15 | 0.78 | 2.23 | 1.06 | 0.9 | 1.28 | 0.76 |
| 1994 | 3.49 | 1.21 | 1.22 | 1.1 | 0.76 | 2.15 | 1.03 | 0.88 | 1.19 | 0.78 |
| 1993 | 3.29 | 1.06 | 1.05 | 0.95 | 0.61 | 2.1 | 0.94 | 0.79 | 1.26 | 0.69 |
| 1992 | 2.52 | 0.44 | 0.41 | 0.32 | 0 | 1.91 | 0.86 | 0.72 | 1.2 | 0.64 |
| 1991 | 2.49 | 0.46 | 0.4 | 0.32 | 0 | 1.95 | 0.88 | 0.74 | 1.16 | 0.64 |
| 1990 | 2.46 | 0.4 | 0.41 | 0.33 | 0 | 1.97 | 0.76 | 0.71 | 1.23 | 0.6 |
| 1989 | 2.46 | 0.4 | 0.4 | 0.32 | 0 | 1.99 | 0.68 | 0.63 | 1.35 | 0.54 |
| 1988 | 2.38 | 0.37 | 0.39 | 0.33 | 0 | 1.95 | 0.68 | 0.64 | 1.27 | 0.57 |
| 1987 | 2.44 | 0.36 | 0.37 | 0.31 | 0.01 | 2.01 | 0.66 | 0.63 | 1.36 | 0.54 |
| 1986 | 2.1 | 0.3 | 0.3 | 0.25 | 0.01 | 1.74 | 0.57 | 0.54 | 1.19 | 0.49 |
| 1985 | 2.02 | 0.31 | 0.29 | 0.25 | 0.01 | 1.67 | 0.58 | 0.55 | 1.11 | 0.5 |
| 1984 | 1.91 | 0.27 | 0.29 | 0.26 | 0.01 | 1.6 | 0.55 | 0.52 | 1.04 | 0.48 |
| 1983 | 1.87 | 0.3 | 0.3 | 0.27 | 0 | 1.53 | 0.53 | 0.51 | 1.02 | 0.43 |
| 1982 | 1.86 | 0.26 | 0.31 | 0.28 | 1.57 | 0.5 | 0.49 | 1.03 | 0.43 | |
| 1981 | 1.75 | 0.27 | 0.3 | 0.27 | 1.45 | 0.43 | 0.42 | 1 | 0.36 | |
| 1980 | 1.8 | 0.28 | 0.31 | 0.28 | 1.49 | 0.44 | 0.42 | 1.03 | 0.35 | |
| 1979 | 1.73 | 0.28 | 0.3 | 0.27 | 1.42 | 0.45 | 0.43 | 0.97 | 0.31 | |
| 1978 | 1.68 | 0.3 | 0.26 | 0.23 | 1.36 | 0.44 | 0.42 | 0.97 | 0.32 | |
| 1977 | 1.54 | 0.31 | 0.24 | 0.21 | 1.21 | 0.44 | 0.42 | 0.86 | 0.32 | |
| 1976 | 1.36 | 0.25 | 0.21 | 0.19 | 1.09 | 0.38 | 0.37 | 0.76 | 0.28 | |
| 1975 | 1.32 | 0.23 | 0.2 | 0.18 | 1.06 | 0.35 | 0.34 | 0.76 | 0.27 | |
| 1974 | 1.39 | 0.27 | 0.21 | 0.18 | 1.09 | 0.37 | 0.36 | 0.8 | 0.26 | |
| 1973 | 1.34 | 0.27 | 0.22 | 0.2 | 1.04 | 0.35 | 0.34 | 0.77 | 0.23 | |
| 1972 | 1.17 | 0.23 | 0.2 | 0.18 | 0.91 | 0.32 | 0.31 | 0.65 | 0.22 | |
| 1971 | 1.22 | 0.28 | 0.18 | 0.16 | 0.9 | 0.37 | 0.36 | 0.66 | 0.26 | |
| 1970 | 1.23 | 0.32 | 0.15 | 0.14 | 0.88 | 0.38 | 0.37 | 0.69 | 0.24 | |
| 1969 | 1.13 | 0.26 | 0.15 | 0.13 | 0.83 | 0.34 | 0.34 | 0.63 | 0.24 | |
| 1968 | 1.15 | 0.29 | 0.13 | 0.12 | 0.84 | 0.38 | 0.37 | 0.64 | 0.26 | |
| 1967 | 1.16 | 0.29 | 0.12 | 0.11 | 0.84 | 0.37 | 0.36 | 0.68 | 0.23 | |
| 1966 | 1.1 | 0.27 | 0.11 | 0.1 | 0.8 | 0.38 | 0.37 | 0.61 | 0.23 | |
| 1965 | 0.96 | 0.19 | 0.09 | 0.08 | 0.74 | 0.3 | 0.29 | 0.57 | 0.21 | |
| 1964 | 0.91 | 0.17 | 0.08 | 0.08 | 0.72 | 0.34 | 0.34 | 0.48 | 0.27 | |
| 1963 | 0.79 | 0.14 | 0.07 | 0.06 | 0.63 | 0.28 | 0.28 | 0.43 | 0.25 | |
| 1962 | 0.74 | 0.12 | 0.07 | 0.06 | 0.6 | 0.29 | 0.28 | 0.38 | 0.25 | |
| 1961 | 0.75 | 0.14 | 0.07 | 0.06 | 0.59 | 0.27 | 0.27 | 0.41 | 0.24 | |


Comments