
Abstract
Watermelon production in agriculture varies greatly depending on cultivation techniques and climatic conditions in each country around the world. According to the latest data for 2022, the Dominican Republic has the largest watermelon yield, achieving an astounding figure of 312 tons per hectare. This figure is supported by the region’s warm climate and the introduction of appropriate agricultural techniques. Several trends and characteristics can be seen in the production of watermelons around the world. First, tropical and subtropical regions are suitable for watermelon production. These regions have a warm climate throughout the year and provide suitable conditions for watermelon cultivation. There is also a trend toward improved yields due to the introduction of effective agricultural techniques and the development of irrigation facilities. In addition, watermelon production can vary greatly from region to region. In some countries and regions, watermelon is cultivated as a major agricultural product and high yields have been recorded. On the other hand, production may be limited in some regions due to climatic conditions and lack of technology. Thus, regional characteristics and conditions affect the production of watermelons around the world, and effective agricultural techniques and appropriate environmental conditions lead to increased yields.
Watermelon production (worldwide)
Looking at the watermelon production data from 1961 to 2022, there are significant changes worldwide. Of particular note is the astounding yield of 422 t/ha recorded in the Dominican Republic in 2019. Given this peak, it is suggested that current production is about 73.9% of the peak. There are several trends and characteristics in watermelon production. First, technological innovation and agricultural modernization have led to improvements in watermelon cultivation techniques and increased production. Environmental factors such as climatic conditions and proper use of soil also affect production. On the other hand, the decrease in production from its peak is likely due to various factors. These factors include climate change, natural disasters, or changes in agricultural policies. In particular, climate change may have a direct impact on watermelon growth. Overall, watermelon production is changing over time, while being influenced by technological innovation and environmental factors. Future efforts such as promoting sustainable agriculture and taking measures against climate change will be required.
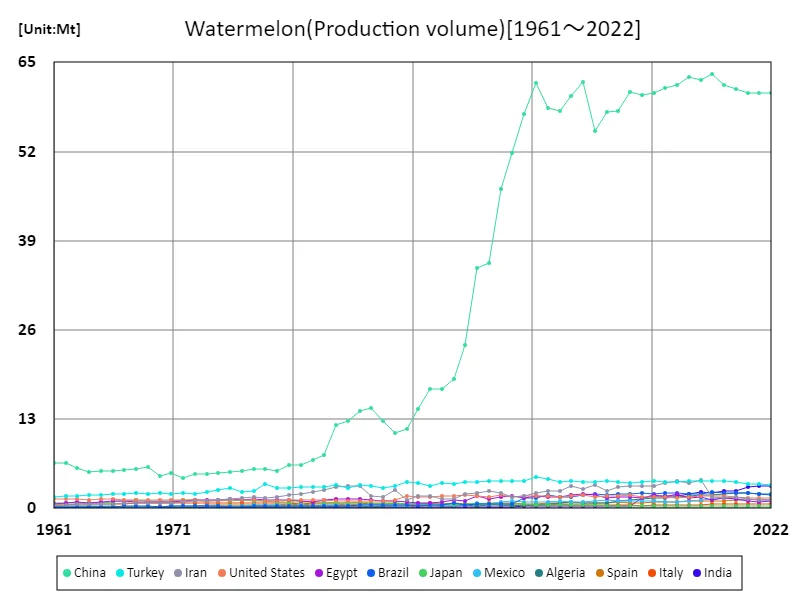
The maximum is 63.4Mt[2017] of China, and the current value is about 95.6%
Watermelon production (latest year, countries around the world)
According to data from 2022, watermelon production in global agriculture is cultivated in various countries. The Dominican Republic boasts the largest production, with an astounding figure of 312 tons per hectare. Meanwhile, the overall average is 29 tons/hectare, with a total production of 3.51 kilotons. Considering the trends and characteristics to date, the introduction of appropriate climatic conditions and agricultural techniques in each region is important for watermelon production. Tropical and subtropical regions are often suitable for watermelon cultivation, and high production volumes are recorded in these regions. Advances in agricultural techniques, such as effective irrigation facilities and the use of fertilizers, also contribute to improved production. On the other hand, production volumes may be affected in some regions due to factors such as climate change and environmental changes. In particular, with the increasing importance of sustainable agriculture, the efficient use of water resources and proper management of pesticides are attracting attention. In summary, watermelon production in the world is growing under the framework of sustainable agriculture, despite being affected by different conditions and technologies in each region. In the future, adaptation to climate change and efforts toward agricultural sustainability will become even more important.
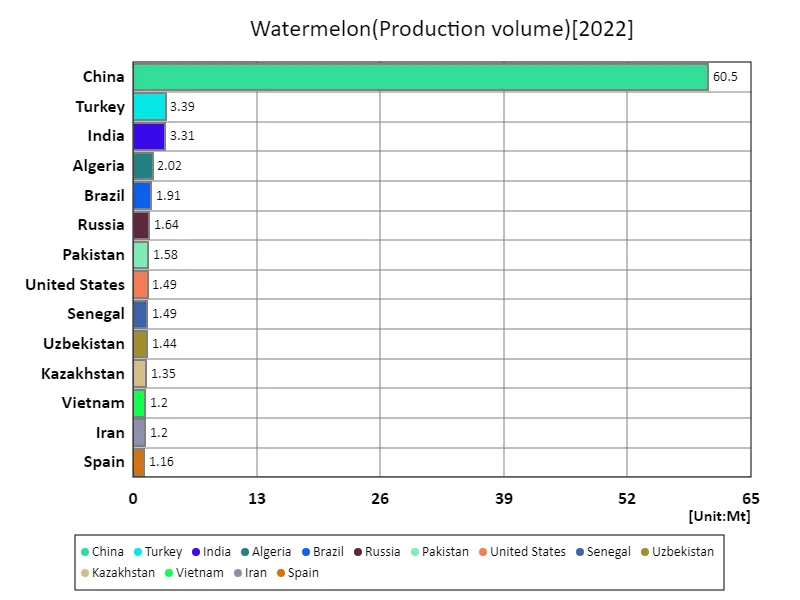
The maximum is 60.5Mt of China, the average is 740kt, and the total is 100Mt
Watermelon production (continent)
Looking at the 2022 watermelon production data, North America boasts the largest production. The production per hectare is 41 tons, which is the current maximum. Given this data, it is suggested that the North American region is very successful in cultivating watermelons. Considering the characteristics and trends in watermelon production, the success in North America can be attributed to the region’s climatic conditions and advances in agricultural technology. Some parts of North America have a warm climate, which is suitable for growing watermelons. Another factor is that efforts are being made to improve productivity, such as the introduction of advanced agricultural technologies and the development of irrigation facilities. In addition, efforts such as the promotion of sustainable agriculture and breeding have also contributed to the increase in watermelon production in North America. With an emphasis on improving agricultural efficiency and productivity, technological innovation and the introduction of best practices are considered important. In summary, it is shown that the North American region is a global leader in watermelon production. The region’s climatic conditions and development of agricultural technology have enabled high production. With the continued promotion of sustainable agriculture and technological innovation in the future, watermelon production is expected to grow further.
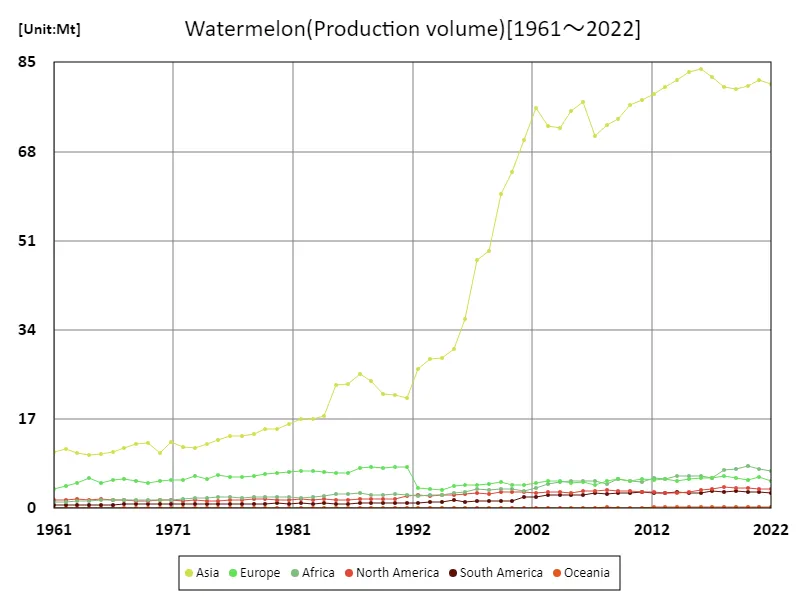
The maximum is 83.8Mt[2016] of Asia, and the current value is about 96.4%
Watermelon production (latest year, continent)
Looking at the watermelon production data for 2022, North America boasts the largest production. The average production per hectare is 30.4 tons, with a maximum value of 41 tons. This forms the overall total production. Given this data, it is clear that North America is the leading region in watermelon production. Considering the characteristics and trends in watermelon production, it can be said that the success in North America is due to several factors. First of all, some parts of North America are blessed with warm climatic conditions, which are suitable for growing watermelons. In addition, productivity has improved due to advances in agricultural technology and the promotion of sustainable agriculture. Breeding and the use of efficient irrigation facilities have also contributed to the increase in production. On the other hand, production in other regions varies depending on climatic conditions and technology. Watermelon production may be limited in some areas. Factors such as climate change and natural disasters may also affect production. Overall, North America is the leading region in watermelon production and boasts high production. It is expected that the promotion of sustainable agriculture and technological innovation will continue to contribute to the increase in watermelon production in the future.
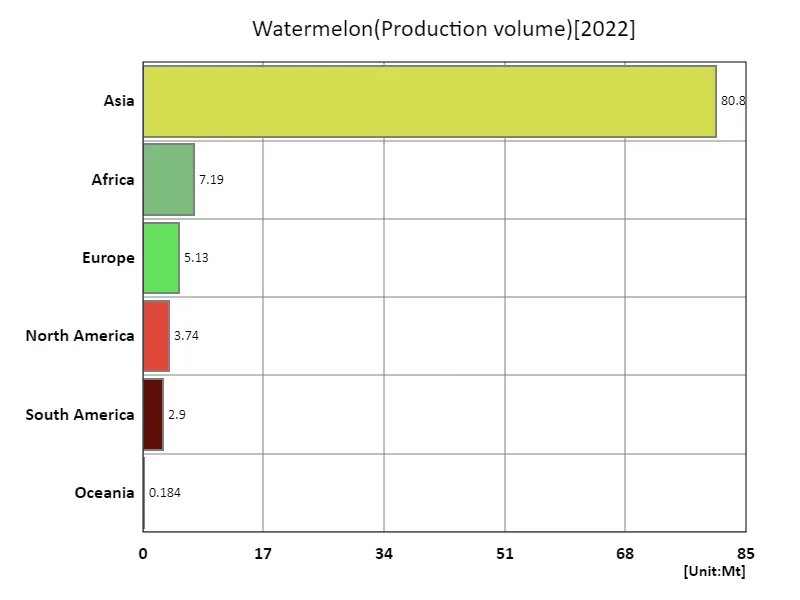
The maximum is 80.8Mt of Asia, the average is 16.7Mt, and the total is 100Mt
Main data
| Production(Watermelon, Production volume, t) [Mt] | ||||||||||
|---|---|---|---|---|---|---|---|---|---|---|
| World | Asia | Upper-middle-income countries | Eastern Asia | China | Lower-middle-income countries | Net Food Importing Developing Countries | Africa | Southern Asia | Land Locked Developing Countries | |
| 2022 | 99.96 | 80.81 | 74.85 | 61.41 | 60.54 | 16.6 | 8.83 | 7.19 | 7 | 6.88 |
| 2021 | 102.17 | 81.6 | 75.37 | 61.49 | 60.59 | 17.66 | 9.72 | 7.57 | 7.76 | 6.63 |
| 2020 | 100.98 | 80.39 | 75.16 | 61.4 | 60.53 | 16.99 | 8.6 | 7.97 | 6.57 | 6.75 |
| 2019 | 100.8 | 79.97 | 76.34 | 61.93 | 61.04 | 15.65 | 7.7 | 7.56 | 5.54 | 6.34 |
| 2018 | 101.01 | 80.23 | 76.86 | 62.65 | 61.76 | 15.74 | 6.87 | 7.24 | 4.86 | 6.03 |
| 2017 | 100.94 | 82.28 | 78.21 | 64.29 | 63.36 | 14.17 | 5.65 | 5.71 | 5.22 | 6.66 |
| 2016 | 102.39 | 83.79 | 76.63 | 63.42 | 62.41 | 17.06 | 6.18 | 6.14 | 7.82 | 6.91 |
| 2015 | 101 | 83.1 | 76.7 | 63.96 | 62.89 | 16.51 | 5.66 | 6.07 | 6.72 | 5.95 |
| 2014 | 99.22 | 81.68 | 75.29 | 62.84 | 61.7 | 16.39 | 5.98 | 6.15 | 6.66 | 5.28 |
| 2013 | 97.55 | 80.26 | 74.46 | 62.34 | 61.22 | 15.17 | 5.38 | 5.6 | 6.21 | 5.04 |
| 2012 | 96.19 | 78.98 | 73.85 | 61.64 | 60.53 | 14.34 | 5.28 | 5.71 | 5.5 | 4.67 |
| 2011 | 94.58 | 77.79 | 73.79 | 61.31 | 60.25 | 12.7 | 4.91 | 5 | 5.23 | 4.51 |
| 2010 | 93.52 | 76.8 | 73.48 | 61.89 | 60.74 | 11.53 | 5.16 | 5.17 | 4.26 | 4.51 |
| 2009 | 91.51 | 74.1 | 71.1 | 59.28 | 57.93 | 11.11 | 5.82 | 5.64 | 4.1 | 4.38 |
| 2008 | 89.26 | 73.03 | 71.17 | 59.08 | 57.71 | 9.92 | 5.06 | 4.69 | 3.53 | 3.52 |
| 2007 | 86.71 | 70.99 | 67.8 | 56.24 | 54.97 | 10.61 | 5.45 | 5.13 | 4.24 | 3.49 |
| 2006 | 93.65 | 77.4 | 74.88 | 63.38 | 62.08 | 10.32 | 5.38 | 5.13 | 3.77 | 3.1 |
| 2005 | 91.18 | 75.66 | 72.18 | 61.57 | 60.11 | 10.08 | 5.29 | 5.13 | 4.06 | 2.91 |
| 2004 | 88.21 | 72.43 | 69.62 | 59.21 | 57.83 | 9.23 | 5.16 | 4.95 | 3.29 | 2.76 |
| 2003 | 88.57 | 72.94 | 70.58 | 59.71 | 58.34 | 9.11 | 4.87 | 4.69 | 3.28 | 2.83 |
| 2002 | 90.45 | 76.32 | 73.94 | 63.52 | 62.04 | 8.04 | 4.31 | 3.92 | 2.98 | 2.6 |
| 2001 | 83.46 | 70.26 | 68.52 | 59.14 | 57.51 | 6.76 | 3.65 | 3.39 | 2.57 | 2.36 |
| 2000 | 76.68 | 64.13 | 61.93 | 53.43 | 51.82 | 6.74 | 3.94 | 3.6 | 2.46 | 2.24 |
| 1999 | 73.24 | 59.86 | 56.77 | 48.19 | 46.55 | 7.9 | 4.2 | 3.76 | 3.06 | 2.27 |
| 1998 | 61.28 | 49.06 | 45.1 | 37.31 | 35.8 | 7.69 | 4.01 | 3.47 | 3.33 | 1.94 |
| 1997 | 59.83 | 47.37 | 43.81 | 36.72 | 35 | 7.57 | 4.26 | 3.7 | 3.03 | 1.56 |
| 1996 | 47.64 | 36.02 | 32.37 | 25.42 | 23.82 | 6.9 | 3.53 | 3.07 | 2.86 | 1.73 |
| 1995 | 41.63 | 30.35 | 27.4 | 20.66 | 18.83 | 6.2 | 3.41 | 2.94 | 2.16 | 1.67 |
| 1994 | 38.4 | 28.61 | 25.44 | 19.02 | 17.4 | 5.56 | 3.09 | 2.62 | 2.05 | 1.72 |
| 1993 | 38.25 | 28.54 | 24.94 | 18.95 | 17.35 | 5.95 | 2.77 | 2.46 | 2.48 | 1.81 |
| 1992 | 36.3 | 26.54 | 22.72 | 16.22 | 14.54 | 6.13 | 2.63 | 2.39 | 2.44 | 2.17 |
| 1991 | 35.08 | 21.04 | 23.56 | 13.06 | 11.55 | 4.25 | 2.88 | 2.61 | 1.9 | 0.44 |
| 1990 | 34.87 | 21.55 | 22.51 | 12.4 | 10.96 | 5.79 | 3.15 | 2.64 | 3.37 | 0.42 |
| 1989 | 34.96 | 21.8 | 24.18 | 14.14 | 12.73 | 4.56 | 2.96 | 2.51 | 2.29 | 0.39 |
| 1988 | 37.56 | 24.27 | 26.13 | 16 | 14.58 | 4.68 | 3.02 | 2.53 | 2.38 | 0.39 |
| 1987 | 38.95 | 25.54 | 25.5 | 15.57 | 14.16 | 6.5 | 3.22 | 2.89 | 3.83 | 0.38 |
| 1986 | 35.61 | 23.67 | 22.47 | 14.16 | 12.75 | 6.31 | 3.01 | 2.69 | 3.85 | 0.42 |
| 1985 | 35.3 | 23.41 | 22.54 | 13.55 | 12.18 | 5.96 | 2.9 | 2.66 | 3.56 | 0.42 |
| 1984 | 29.57 | 17.61 | 18 | 9.17 | 7.84 | 5.22 | 2.65 | 2.35 | 3.18 | 0.41 |
| 1983 | 28.84 | 16.99 | 17.37 | 8.26 | 7.02 | 4.63 | 2.36 | 2.06 | 2.86 | 0.4 |
| 1982 | 28.75 | 16.93 | 17.15 | 7.63 | 6.27 | 4.54 | 2.33 | 2.05 | 2.58 | 0.39 |
| 1981 | 27.72 | 16.03 | 16.4 | 7.61 | 6.29 | 4.39 | 2.41 | 2.19 | 2.37 | 0.36 |
| 1980 | 26.41 | 15.04 | 15.42 | 6.84 | 5.47 | 4.12 | 2.34 | 2.11 | 2.17 | 0.34 |
| 1979 | 26.44 | 15.03 | 15.85 | 7.13 | 5.69 | 4.08 | 2.39 | 2.14 | 1.98 | 0.32 |
| 1978 | 25.15 | 14.18 | 14.72 | 7.11 | 5.72 | 4.07 | 2.41 | 2.17 | 2.06 | 0.31 |
| 1977 | 24.24 | 13.7 | 13.9 | 6.82 | 5.43 | 3.72 | 2.23 | 2.02 | 1.87 | 0.29 |
| 1976 | 24.39 | 13.75 | 14.27 | 6.61 | 5.23 | 3.7 | 2.48 | 2.22 | 1.78 | 0.34 |
| 1975 | 23.77 | 13.04 | 13.71 | 6.52 | 5.19 | 3.63 | 2.28 | 2.17 | 1.68 | 0.3 |
| 1974 | 21.99 | 12.17 | 13.07 | 6.27 | 4.99 | 3.42 | 2.28 | 2.03 | 1.58 | 0.29 |
| 1973 | 21.93 | 11.48 | 13.24 | 6.42 | 5.03 | 3.18 | 2.15 | 1.89 | 1.47 | 0.28 |
| 1972 | 21.12 | 11.68 | 12.23 | 5.81 | 4.49 | 2.92 | 1.98 | 1.72 | 1.32 | 0.27 |
| 1971 | 22.15 | 12.72 | 12.85 | 6.44 | 5.15 | 2.65 | 1.8 | 1.58 | 1.25 | 0.27 |
| 1970 | 19.58 | 10.61 | 11.84 | 5.78 | 4.64 | 2.6 | 1.79 | 1.59 | 1.16 | 0.26 |
| 1969 | 21.11 | 12.41 | 13.44 | 7.19 | 6.03 | 2.57 | 1.8 | 1.56 | 1.14 | 0.25 |
| 1968 | 21.26 | 12.22 | 13.41 | 7.13 | 5.79 | 2.53 | 1.82 | 1.53 | 1.16 | 0.24 |
| 1967 | 20.89 | 11.51 | 13.41 | 6.74 | 5.59 | 2.4 | 1.75 | 1.51 | 1.03 | 0.22 |
| 1966 | 20.09 | 10.68 | 13.17 | 6.43 | 5.5 | 2.47 | 1.83 | 1.63 | 0.98 | 0.22 |
| 1965 | 19.15 | 10.43 | 12.47 | 6.29 | 5.48 | 2.37 | 1.73 | 1.52 | 0.92 | 0.21 |
| 1964 | 19.62 | 10.22 | 12.89 | 6.08 | 5.25 | 2.22 | 1.61 | 1.36 | 0.9 | 0.2 |
| 1963 | 19.18 | 10.52 | 12.43 | 6.67 | 5.9 | 2.12 | 1.54 | 1.35 | 0.86 | 0.19 |
| 1962 | 19.14 | 11.21 | 12.83 | 7.34 | 6.58 | 2.01 | 1.47 | 1.29 | 0.82 | 0.19 |
| 1961 | 17.85 | 10.76 | 11.97 | 7.4 | 6.55 | 1.76 | 1.28 | 1.12 | 0.75 | 0.19 |


Comments