
Abstract
To further explore this trend and its implications, it would be beneficial to delve into the trends of other major importing countries, such as Canada, Mexico, and European countries like Germany and the UK. Understanding their import volumes and any fluctuations over recent years can provide insights into broader market dynamics, including agricultural policies, health trends, and economic factors influencing oat consumption.Additionally, tracking global oat production trends alongside import data can offer a comprehensive view of supply and demand dynamics. This information is crucial for stakeholders in the agriculture and food industry to make informed decisions regarding production, pricing, and market strategies.Continued analysis of oat import and export data, coupled with market research on consumer preferences and health trends, will indeed support strategic decision-making in the evolving oat market.
Oat import volume (worldwide)
From 1961 to 2021, U.S. oat production has seen notable fluctuations, peaking at 2.48 million tons in 2008. Since then, production has declined but remains robust, with the latest figure reaching 2.31 million tons, or 93.1% of its peak. The trend reflects a gradual decrease in production levels, likely due to shifting agricultural priorities and market conditions. Despite this decline, the U.S. continues to be a major producer of oats, maintaining significant output compared to historical levels.

The maximum is 1.46G[2021] of China, and the current value is about 97.8%
Oat imports (latest year, world)
In 2021, global oat production reached a total of 6.32 million tons, with the United States contributing the highest single amount at 2.31 million tons. This figure is significantly above the global average of 36.6 thousand tons per country. Historically, oat production has varied widely, but recent data highlights the U.S.’s dominant role. The overall trend indicates concentrated production with a few major players, while many countries contribute minimally to the global total.

The maximum is 1.43G of China, the average is 49.5M, and the total is 4.01G
Oat imports (continent)
As of 1961, North America recorded the highest oat import figure of 2.52 million tons, marking the peak in historical data. This region has traditionally been a major player in oat imports, reflecting its significant demand. Since this peak, import levels have fluctuated but have generally been influenced by domestic production trends and global market conditions. The trend indicates North America’s leading role in global oat trade, with a substantial share of the total import volume.
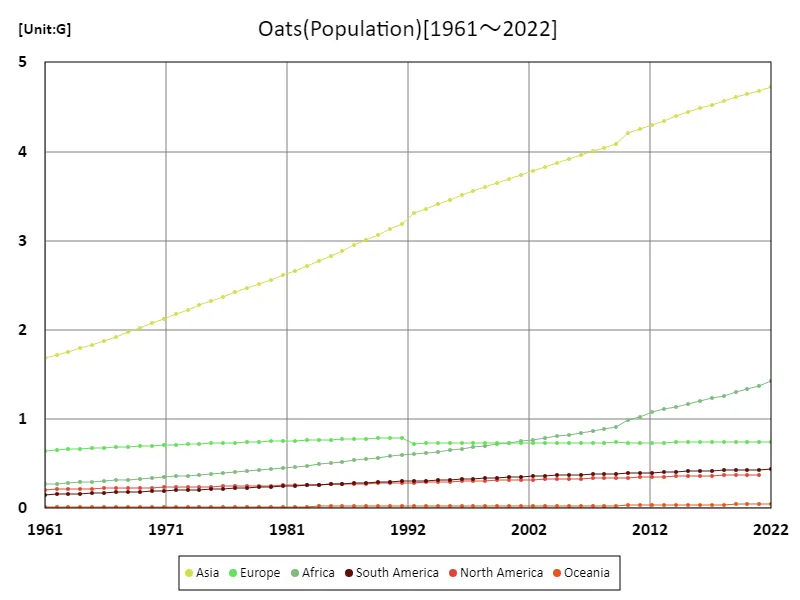
The maximum is the latest one, 4.72G of Asia
Oat imports (latest year, continental)
In 2021, global oat production totaled 6.07 million tons, with North America leading at 2.34 million tons, significantly above the average of 1.01 million tons per region. This demonstrates North America’s dominant role in global production. The data highlights a trend where major producers contribute a substantial share of the total output, with North America’s high production reflecting both strong domestic demand and capacity. The distribution of production remains uneven, with a few key regions accounting for most of the global total.

The maximum is 4.72G of Asia, the average is 1.47G, and the total is 7.37G
Main data
| Others(Oats, Population) [G] | ||||||||||
|---|---|---|---|---|---|---|---|---|---|---|
| World | Asia | Lower-middle-income countries | Upper-middle-income countries | Southern Asia | Net Food Importing Developing Countries | Eastern Asia | China | India | Africa | |
| 2022 | 7.98 | 4.72 | 3.45 | 2.56 | 1.43 | 1.43 | ||||
| 2021 | 7.91 | 4.68 | 3.41 | 2.55 | 1.99 | 1.7 | 1.66 | 1.46 | 1.41 | 1.37 |
| 2020 | 7.84 | 4.65 | 3.37 | 2.54 | 1.97 | 1.67 | 1.66 | 1.46 | 1.4 | 1.34 |
| 2019 | 7.76 | 4.61 | 3.33 | 2.53 | 1.95 | 1.63 | 1.66 | 1.45 | 1.38 | 1.3 |
| 2018 | 7.68 | 4.57 | 3.28 | 2.52 | 1.93 | 1.59 | 1.66 | 1.45 | 1.37 | 1.26 |
| 2017 | 7.6 | 4.53 | 3.24 | 2.5 | 1.9 | 1.56 | 1.65 | 1.44 | 1.35 | 1.23 |
| 2016 | 7.51 | 4.48 | 3.19 | 2.48 | 1.88 | 1.53 | 1.64 | 1.43 | 1.34 | 1.2 |
| 2015 | 7.43 | 4.44 | 3.14 | 2.46 | 1.86 | 1.5 | 1.63 | 1.43 | 1.32 | 1.17 |
| 2014 | 7.34 | 4.39 | 3.1 | 2.44 | 1.83 | 1.46 | 1.62 | 1.42 | 1.31 | 1.14 |
| 2013 | 7.25 | 4.35 | 3.05 | 2.42 | 1.81 | 1.43 | 1.61 | 1.41 | 1.29 | 1.11 |
| 2012 | 7.16 | 4.3 | 3.01 | 2.4 | 1.79 | 1.4 | 1.6 | 1.4 | 1.27 | 1.08 |
| 2011 | 7.07 | 4.25 | 2.96 | 2.38 | 1.76 | 1.34 | 1.59 | 1.39 | 1.26 | 1.02 |
| 2010 | 6.99 | 4.2 | 2.91 | 2.36 | 1.74 | 1.31 | 1.58 | 1.38 | 1.24 | 0.99 |
| 2009 | 6.9 | 4.09 | 2.87 | 2.35 | 1.66 | 1.21 | 1.58 | 1.38 | 1.22 | 0.91 |
| 2008 | 6.81 | 4.04 | 2.82 | 2.33 | 1.64 | 1.19 | 1.58 | 1.37 | 1.21 | 0.89 |
| 2007 | 6.73 | 4 | 2.78 | 2.31 | 1.61 | 1.17 | 1.57 | 1.36 | 1.19 | 0.87 |
| 2006 | 6.64 | 3.96 | 2.74 | 2.29 | 1.59 | 1.14 | 1.56 | 1.36 | 1.17 | 0.85 |
| 2005 | 6.56 | 3.91 | 2.69 | 2.28 | 1.57 | 1.12 | 1.55 | 1.35 | 1.15 | 0.83 |
| 2004 | 6.48 | 3.87 | 2.65 | 2.26 | 1.55 | 1.1 | 1.54 | 1.34 | 1.14 | 0.81 |
| 2003 | 6.39 | 3.83 | 2.6 | 2.24 | 1.52 | 1.08 | 1.53 | 1.33 | 1.12 | 0.79 |
| 2002 | 6.31 | 3.78 | 2.56 | 2.23 | 1.5 | 1.06 | 1.52 | 1.32 | 1.1 | 0.77 |
| 2001 | 6.23 | 3.74 | 2.51 | 2.21 | 1.47 | 1.03 | 1.51 | 1.32 | 1.08 | 0.75 |
| 2000 | 6.15 | 3.69 | 2.47 | 2.19 | 1.45 | 1.01 | 1.51 | 1.31 | 1.06 | 0.74 |
| 1999 | 6.07 | 3.65 | 2.42 | 2.17 | 1.42 | 0.99 | 1.5 | 1.3 | 1.04 | 0.72 |
| 1998 | 5.99 | 3.6 | 2.38 | 2.16 | 1.4 | 0.97 | 1.49 | 1.29 | 1.02 | 0.7 |
| 1997 | 5.91 | 3.56 | 2.33 | 2.14 | 1.37 | 0.95 | 1.48 | 1.29 | 1 | 0.68 |
| 1996 | 5.83 | 3.51 | 2.29 | 2.12 | 1.35 | 0.93 | 1.47 | 1.28 | 0.98 | 0.67 |
| 1995 | 5.74 | 3.46 | 2.24 | 2.1 | 1.32 | 0.9 | 1.46 | 1.27 | 0.96 | 0.65 |
| 1994 | 5.66 | 3.41 | 2.2 | 2.08 | 1.29 | 0.88 | 1.45 | 1.25 | 0.95 | 0.64 |
| 1993 | 5.58 | 3.36 | 2.15 | 2.05 | 1.27 | 0.86 | 1.43 | 1.24 | 0.93 | 0.62 |
| 1992 | 5.49 | 3.31 | 2.11 | 2.03 | 1.24 | 0.85 | 1.42 | 1.23 | 0.91 | 0.61 |
| 1991 | 5.41 | 3.18 | 2.07 | 2.01 | 1.22 | 0.82 | 1.4 | 1.21 | 0.89 | 0.6 |
| 1990 | 5.32 | 3.13 | 2.02 | 1.98 | 1.19 | 0.8 | 1.38 | 1.19 | 0.87 | 0.58 |
| 1989 | 5.22 | 3.07 | 1.98 | 1.95 | 1.17 | 0.78 | 1.36 | 1.17 | 0.85 | 0.57 |
| 1988 | 5.13 | 3.01 | 1.93 | 1.92 | 1.14 | 0.76 | 1.34 | 1.15 | 0.83 | 0.55 |
| 1987 | 5.04 | 2.95 | 1.89 | 1.88 | 1.11 | 0.74 | 1.31 | 1.13 | 0.82 | 0.54 |
| 1986 | 4.95 | 2.89 | 1.84 | 1.85 | 1.09 | 0.72 | 1.29 | 1.11 | 0.8 | 0.52 |
| 1985 | 4.86 | 2.83 | 1.8 | 1.82 | 1.06 | 0.71 | 1.27 | 1.09 | 0.78 | 0.51 |
| 1984 | 4.78 | 2.77 | 1.76 | 1.79 | 1.04 | 0.69 | 1.25 | 1.07 | 0.76 | 0.49 |
| 1983 | 4.69 | 2.72 | 1.72 | 1.76 | 1.01 | 0.67 | 1.23 | 1.05 | 0.75 | 0.48 |
| 1982 | 4.61 | 2.67 | 1.67 | 1.73 | 0.99 | 0.65 | 1.21 | 1.04 | 0.73 | 0.47 |
| 1981 | 4.52 | 2.61 | 1.63 | 1.71 | 0.97 | 0.63 | 1.2 | 1.02 | 0.71 | 0.45 |
| 1980 | 4.44 | 2.56 | 1.59 | 1.68 | 0.94 | 0.62 | 1.18 | 1.01 | 0.7 | 0.44 |
| 1979 | 4.37 | 2.51 | 1.55 | 1.65 | 0.92 | 0.6 | 1.16 | 0.99 | 0.68 | 0.43 |
| 1978 | 4.29 | 2.47 | 1.51 | 1.63 | 0.9 | 0.59 | 1.15 | 0.98 | 0.67 | 0.42 |
| 1977 | 4.22 | 2.42 | 1.48 | 1.6 | 0.88 | 0.57 | 1.13 | 0.97 | 0.65 | 0.41 |
| 1976 | 4.14 | 2.37 | 1.44 | 1.58 | 0.86 | 0.56 | 1.12 | 0.95 | 0.64 | 0.4 |
| 1975 | 4.07 | 2.32 | 1.41 | 1.55 | 0.83 | 0.55 | 1.1 | 0.93 | 0.62 | 0.39 |
| 1974 | 4 | 2.27 | 1.38 | 1.52 | 0.82 | 0.53 | 1.08 | 0.92 | 0.61 | 0.38 |
| 1973 | 3.92 | 2.22 | 1.35 | 1.49 | 0.8 | 0.52 | 1.06 | 0.9 | 0.6 | 0.37 |
| 1972 | 3.84 | 2.17 | 1.32 | 1.46 | 0.78 | 0.51 | 1.03 | 0.88 | 0.58 | 0.36 |
| 1971 | 3.77 | 2.12 | 1.29 | 1.43 | 0.76 | 0.49 | 1.01 | 0.85 | 0.57 | 0.35 |
| 1970 | 3.7 | 2.07 | 1.26 | 1.4 | 0.74 | 0.48 | 0.98 | 0.83 | 0.56 | 0.34 |
| 1969 | 3.62 | 2.02 | 1.23 | 1.37 | 0.73 | 0.47 | 0.96 | 0.81 | 0.55 | 0.33 |
| 1968 | 3.55 | 1.97 | 1.2 | 1.34 | 0.71 | 0.46 | 0.93 | 0.79 | 0.53 | 0.32 |
| 1967 | 3.48 | 1.92 | 1.17 | 1.31 | 0.69 | 0.45 | 0.91 | 0.77 | 0.52 | 0.31 |
| 1966 | 3.41 | 1.88 | 1.14 | 1.28 | 0.68 | 0.44 | 0.89 | 0.75 | 0.51 | 0.31 |
| 1965 | 3.34 | 1.83 | 1.12 | 1.25 | 0.66 | 0.42 | 0.87 | 0.73 | 0.5 | 0.3 |
| 1964 | 3.27 | 1.79 | 1.09 | 1.22 | 0.65 | 0.41 | 0.85 | 0.71 | 0.49 | 0.29 |
| 1963 | 3.2 | 1.75 | 1.07 | 1.18 | 0.63 | 0.4 | 0.83 | 0.7 | 0.48 | 0.28 |
| 1962 | 3.13 | 1.72 | 1.04 | 1.15 | 0.62 | 0.39 | 0.82 | 0.69 | 0.47 | 0.28 |
| 1961 | 3.07 | 1.69 | 1.02 | 1.13 | 0.61 | 0.38 | 0.81 | 0.68 | 0.46 | 0.27 |


Comments