
Abstract
Banana imports are driven by high global demand, with the United States being its central market. In the latest data for 2021, the United States had the largest import volume at 4.64 Mt, and its demand is stable. As can be seen from past trends, bananas are in high demand as a food item and have become established as a basic food item in many countries. In the United States in particular, bananas are a common fruit and are deeply rooted in the food culture. As a result, import volumes are stable and demand remains high. On the other hand, factors such as climate change and disease may affect producing countries and transportation routes, and the impact of these factors requires attention. However, demand for bananas is expected to continue in the future and will occupy an important position in the global agricultural market.
Banana imports (worldwide)
Banana imports have been growing for a long time, but U.S. imports peaked at 4.81 Mt in 2017. It has since declined slightly and is now at 96.3% of its peak. This trend indicates that while demand for bananas is stable, it is a mature market. Bananas are a common fruit around the world and demand is stable, but growth rates tend to slow in mature markets. The diversification of producing countries and improvements in transportation technology also contribute to the stability of banana supply. However, factors such as climate change and disease can affect production volume and quality. Demand for bananas is expected to remain strong in the future, but market maturity and external factors will require changes in demand and adjustments to import volume.
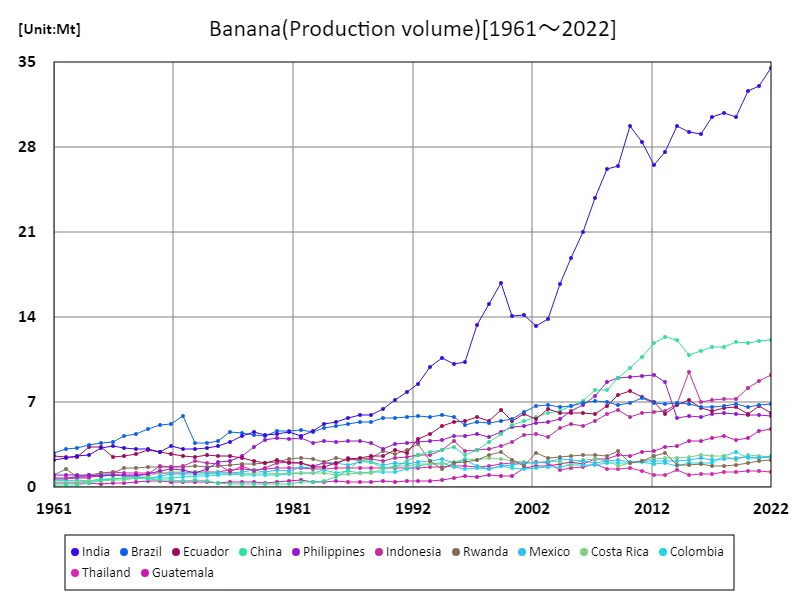
The maximum is the latest one, 34.5Mt of India
Banana imports (latest year, countries around the world)
Banana imports have remained stable globally, and the latest data for 2021 shows that the United States is the largest importer. The average import volume is 143kt, with total imports reaching 23.2Mt. This data shows that bananas are widely consumed worldwide and have become a common food in many countries. The largest import volume from the United States also shows that bananas are deeply rooted in American food culture and continue to enjoy stable demand. Banana imports have a high demand as a common fruit and have established themselves as a daily necessity. However, factors such as climate change and disease can affect production volume and quality. In order to meet the demand for bananas while addressing these factors, it is necessary to diversify producing countries and transportation routes and adopt sustainable production methods. It is expected that bananas will continue to occupy an important position in the global agricultural market in the future.
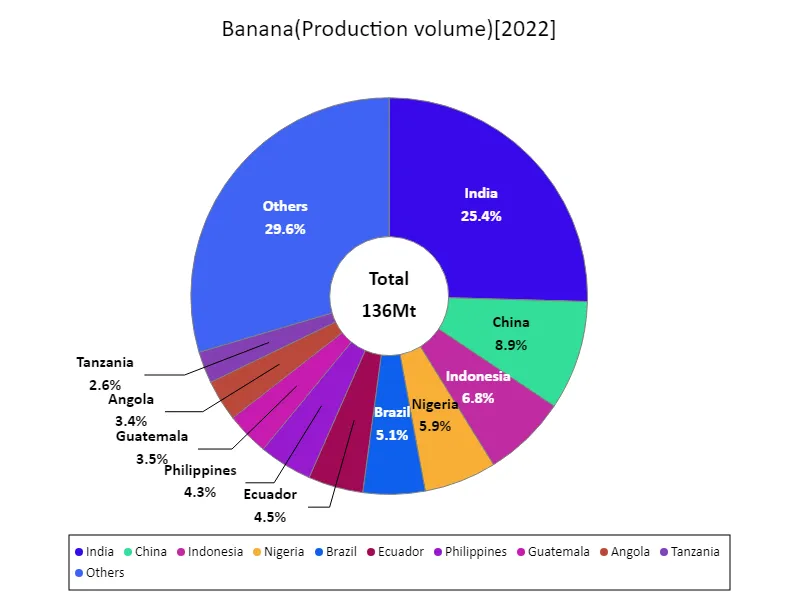
The maximum is 34.5Mt of India, the average is 911kt, and the total is 136Mt
Banana imports (continent)
Europe recorded the largest banana import volume of 11.4 Mt in 2021, and demand is increasing significantly. This trend suggests that bananas are recognized as an important food in Europe and are becoming more popular among consumers. In addition, bananas are a common food, highly nutritious and easy to consume, so demand is also stable. In addition, one of the factors that contribute to the increase in banana imports in Europe is the expansion of global food supply chains and advances in transportation technology. This has made it possible to transport bananas from producing countries to European markets efficiently and meet demand. However, risk factors such as climate change and disease still exist and may affect the stability of supply. In order to meet the demand for bananas while addressing these factors, it is important to adopt sustainable production methods and ensure diverse supply sources. Demand for bananas in Europe will continue to increase and will occupy an important position in the global agricultural market.
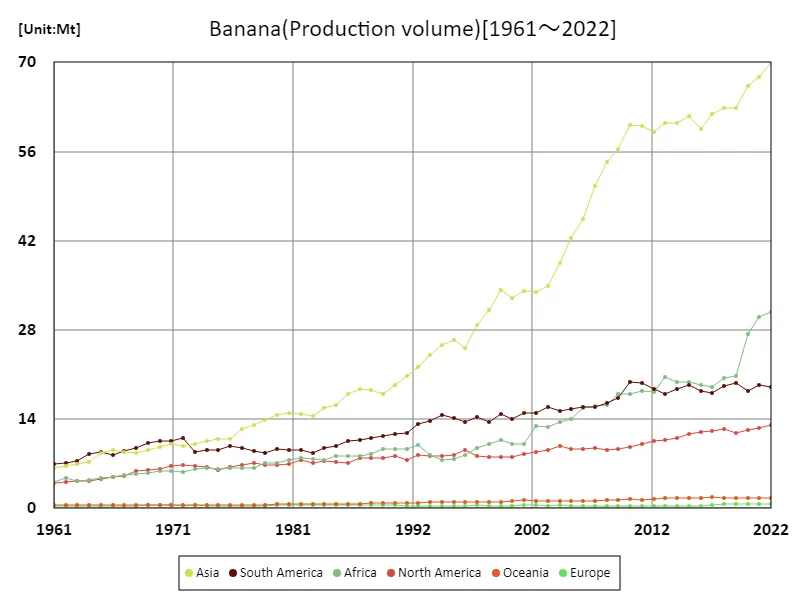
The maximum is the latest one, 70Mt of Asia
Banana imports (latest year, continent)
Europe recorded the largest overall banana imports in 2021, with an average of 3.87 Mt and a total of 23.2 Mt. This data highlights the importance of bananas as a food in Europe. Bananas are a common fruit, highly nutritious, and easy to consume, which has led to stable demand. The increase in European imports is due to the expansion of global food supply chains and advances in transportation technology. This has made it possible to transport bananas from producing countries efficiently and meet demand. On the other hand, risk factors such as climate change and disease may affect the stability of supply. It is important to adopt sustainable production methods and ensure diverse supply sources while addressing these factors. Demand for bananas is expected to continue to increase and will occupy an important position in the global agricultural market.
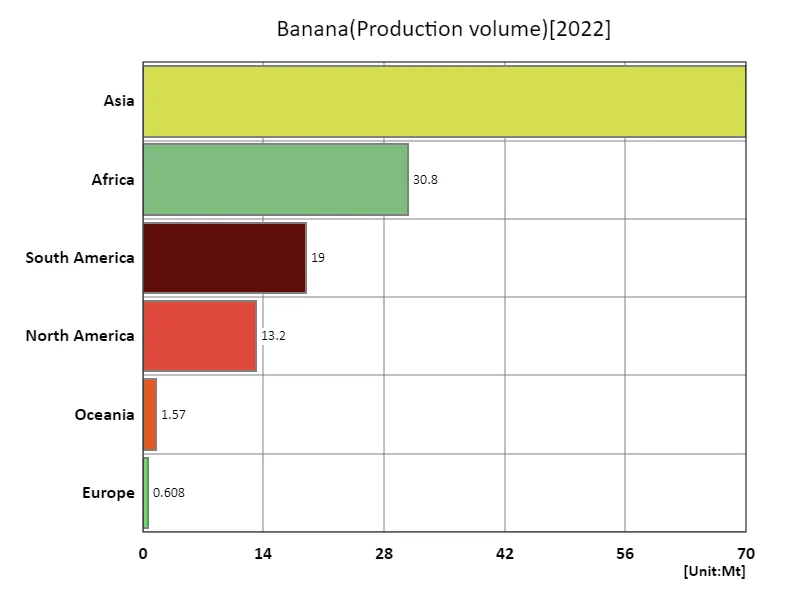
The maximum is 70Mt of Asia, the average is 22.5Mt, and the total is 135Mt
Main data
| Production(Banana, Production volume, t) [Mt] | ||||||||||
|---|---|---|---|---|---|---|---|---|---|---|
| World | Asia | Lower-middle-income countries | Upper-middle-income countries | Southern Asia | India | Americas | Africa | Net Food Importing Developing Countries | South-eastern Asia | |
| 2022 | 135.11 | 69.95 | 69.85 | 54.61 | 36.02 | 34.53 | 32.13 | 30.85 | 29.16 | 20.33 |
| 2021 | 132.08 | 67.75 | 67.26 | 53.88 | 34.48 | 33.06 | 32.01 | 30.03 | 28.73 | 19.83 |
| 2020 | 126.74 | 66.3 | 65.09 | 51.52 | 33.96 | 32.6 | 30.83 | 27.29 | 27.99 | 19.31 |
| 2019 | 117.34 | 62.9 | 56.81 | 51.27 | 31.84 | 30.46 | 31.47 | 20.73 | 26.62 | 18.11 |
| 2018 | 117.2 | 62.85 | 56.68 | 50.88 | 32.15 | 30.81 | 31.68 | 20.43 | 26.5 | 18.24 |
| 2017 | 113.19 | 61.9 | 55.55 | 48.86 | 31.8 | 30.48 | 30.14 | 19.01 | 24.77 | 17.82 |
| 2016 | 111.35 | 59.52 | 54.01 | 48.65 | 30.44 | 29.14 | 30.44 | 19.31 | 24.98 | 17.14 |
| 2015 | 114.39 | 61.61 | 54.35 | 51.46 | 30.48 | 29.22 | 31.03 | 19.78 | 25.32 | 19.56 |
| 2014 | 112 | 60.47 | 54 | 49.13 | 30.95 | 29.72 | 29.7 | 19.81 | 24.91 | 16.78 |
| 2013 | 111.71 | 60.43 | 53.66 | 47.49 | 28.77 | 27.58 | 28.73 | 20.54 | 24.95 | 18.7 |
| 2012 | 108.63 | 59.12 | 52.36 | 47.29 | 27.61 | 26.51 | 29.38 | 18.22 | 22.74 | 19.02 |
| 2011 | 109.99 | 60.07 | 54.16 | 46.93 | 29.62 | 28.46 | 29.79 | 18.4 | 22.78 | 19.1 |
| 2010 | 109.43 | 60.17 | 54.92 | 45.61 | 30.95 | 29.78 | 29.45 | 17.98 | 22.36 | 18.73 |
| 2009 | 102.5 | 56.32 | 50.99 | 42.56 | 27.67 | 26.47 | 26.54 | 17.96 | 20.13 | 19.03 |
| 2008 | 97.88 | 54.29 | 49.22 | 40.24 | 27.45 | 26.22 | 25.67 | 16.28 | 18.41 | 18.21 |
| 2007 | 93.57 | 50.63 | 45.4 | 39.54 | 25.16 | 23.82 | 25.35 | 16 | 18.71 | 16.82 |
| 2006 | 88.03 | 45.42 | 41.59 | 37.85 | 22.2 | 21 | 25.31 | 15.77 | 18.24 | 15.52 |
| 2005 | 83.04 | 42.42 | 37.52 | 37.07 | 20.07 | 18.89 | 25.02 | 14.01 | 16.79 | 15.17 |
| 2004 | 78.79 | 38.54 | 34.35 | 36.08 | 17.75 | 16.74 | 25.06 | 13.55 | 16.36 | 14.03 |
| 2003 | 74.33 | 34.93 | 30.11 | 35.85 | 14.76 | 13.86 | 25.06 | 12.72 | 15.36 | 13.6 |
| 2002 | 72.3 | 34 | 29.3 | 34.44 | 14.21 | 13.3 | 23.64 | 12.99 | 15.51 | 13.55 |
| 2001 | 69.44 | 34.17 | 28 | 34.1 | 15.05 | 14.21 | 23.52 | 10.06 | 12.51 | 13.23 |
| 2000 | 66.6 | 33.02 | 27.4 | 31.53 | 14.95 | 14.14 | 21.97 | 10.06 | 12.45 | 12.56 |
| 1999 | 69.35 | 34.28 | 29.89 | 31.14 | 17.59 | 16.81 | 22.88 | 10.74 | 13.04 | 11.86 |
| 1998 | 64.32 | 31.05 | 28.24 | 28.61 | 15.91 | 15.1 | 21.67 | 10.14 | 12.78 | 11.03 |
| 1997 | 62.17 | 28.8 | 26.44 | 28.31 | 14.12 | 13.34 | 22.54 | 9.39 | 12.48 | 11.2 |
| 1996 | 57.44 | 25.16 | 22.42 | 27.9 | 11.08 | 10.3 | 22.6 | 8.3 | 11.3 | 11.01 |
| 1995 | 58.16 | 26.43 | 21.88 | 29.44 | 10.97 | 10.18 | 22.56 | 7.81 | 10.59 | 11.77 |
| 1994 | 57.47 | 25.69 | 22.24 | 28.79 | 11.48 | 10.69 | 22.86 | 7.59 | 10.63 | 10.76 |
| 1993 | 55.79 | 24.1 | 21.57 | 27.04 | 10.72 | 9.95 | 22.02 | 8.36 | 11.66 | 10.18 |
| 1992 | 55.05 | 22.2 | 20.03 | 26.33 | 9.28 | 8.52 | 21.73 | 9.87 | 13.34 | 10.02 |
| 1991 | 50.62 | 20.74 | 18.94 | 23.51 | 8.59 | 7.85 | 19.38 | 9.27 | 12.29 | 9.69 |
| 1990 | 49.94 | 19.38 | 18.07 | 23.05 | 8.03 | 7.15 | 19.92 | 9.35 | 12.85 | 9.43 |
| 1989 | 47.83 | 17.98 | 16.95 | 21.83 | 7.26 | 6.41 | 19.3 | 9.29 | 12.8 | 8.85 |
| 1988 | 47.24 | 18.54 | 16.88 | 21.94 | 6.81 | 5.99 | 18.95 | 8.54 | 12.19 | 9.39 |
| 1987 | 46.72 | 18.65 | 16.89 | 21.56 | 6.81 | 5.92 | 18.59 | 8.27 | 11.82 | 9.34 |
| 1986 | 45.09 | 17.97 | 16.69 | 20.66 | 6.68 | 5.71 | 17.74 | 8.22 | 11.61 | 9.66 |
| 1985 | 42.51 | 16.13 | 15.93 | 18.69 | 6.22 | 5.39 | 17.02 | 8.24 | 11.41 | 8.86 |
| 1984 | 41.38 | 15.75 | 15.61 | 18.42 | 6.08 | 5.25 | 16.95 | 7.53 | 10.65 | 8.97 |
| 1983 | 39.25 | 14.52 | 14.76 | 16.82 | 5.46 | 4.65 | 15.79 | 7.8 | 11.07 | 8.47 |
| 1982 | 40.54 | 14.82 | 15.06 | 17.76 | 5.06 | 4.22 | 16.76 | 7.83 | 11.31 | 9.17 |
| 1981 | 39.87 | 14.99 | 15.14 | 17.16 | 5.4 | 4.58 | 16.09 | 7.63 | 11.07 | 9.11 |
| 1980 | 39.1 | 14.65 | 14.98 | 17.12 | 5.14 | 4.35 | 16.17 | 7.14 | 10.5 | 9.05 |
| 1979 | 37.55 | 13.83 | 14.52 | 15.96 | 5.02 | 4.27 | 15.61 | 7.09 | 10.52 | 8.35 |
| 1978 | 36.54 | 13.09 | 13.35 | 16.22 | 5.29 | 4.56 | 16.14 | 6.3 | 9.69 | 7.38 |
| 1977 | 36.09 | 12.4 | 12.11 | 16.8 | 4.96 | 4.25 | 16.3 | 6.39 | 9.75 | 6.98 |
| 1976 | 34.33 | 10.8 | 10.97 | 16.4 | 4.46 | 3.76 | 16.31 | 6.26 | 9.47 | 5.94 |
| 1975 | 33.14 | 10.91 | 10.02 | 16.23 | 4.11 | 3.41 | 15.16 | 6.14 | 9.01 | 6.27 |
| 1974 | 33.51 | 10.52 | 10.1 | 16.38 | 3.97 | 3.27 | 15.66 | 6.31 | 9.79 | 5.92 |
| 1973 | 32.87 | 10.14 | 9.61 | 16.19 | 3.86 | 3.17 | 15.57 | 6.17 | 9.84 | 5.56 |
| 1972 | 34.53 | 9.86 | 9.86 | 17.94 | 3.88 | 3.19 | 17.93 | 5.77 | 9.72 | 5.36 |
| 1971 | 34.24 | 10.16 | 9.99 | 17.33 | 4.06 | 3.37 | 17.19 | 5.87 | 9.66 | 5.35 |
| 1970 | 33.14 | 9.63 | 9.23 | 17.14 | 3.58 | 2.9 | 16.69 | 5.79 | 9.46 | 5.28 |
| 1969 | 31.91 | 9.09 | 9.34 | 15.63 | 3.97 | 3.17 | 16.18 | 5.62 | 9.52 | 4.31 |
| 1968 | 30.39 | 8.75 | 9.01 | 14.58 | 3.94 | 3.13 | 15.23 | 5.41 | 9.3 | 3.95 |
| 1967 | 29.13 | 8.89 | 8.91 | 13.89 | 4 | 3.2 | 14.05 | 5.23 | 8.95 | 4 |
| 1966 | 28.09 | 9.08 | 8.8 | 13.51 | 4.22 | 3.41 | 13.24 | 4.84 | 8.28 | 4.08 |
| 1965 | 27.74 | 8.68 | 8.13 | 14 | 3.94 | 3.27 | 13.42 | 4.72 | 7.81 | 4.01 |
| 1964 | 25.62 | 7.33 | 7.54 | 13 | 3.3 | 2.68 | 12.86 | 4.5 | 7.39 | 3.56 |
| 1963 | 23.84 | 7 | 7.23 | 11.93 | 3.11 | 2.6 | 11.71 | 4.25 | 6.95 | 3.6 |
| 1962 | 23.34 | 6.59 | 7.01 | 11.17 | 2.95 | 2.43 | 11.19 | 4.72 | 7.34 | 3.35 |
| 1961 | 22.42 | 6.38 | 6.81 | 10.99 | 2.73 | 2.26 | 11.01 | 4.19 | 6.91 | 3.37 |


Comments