
Abstract
The United States accounts for the largest share of global pineapple imports in 2021, at 7.23 Mt. This indicates that the United States is the major demand country for pineapples. Meanwhile, other countries also depend on pineapple imports, and past trends suggest that pineapples are widely consumed worldwide. It also suggests that demand for pineapples is increasing. This is likely due to increased health awareness and diversification of food culture. In addition, pineapple producing and exporting countries may be affected by climatic conditions and advances in production technology. Therefore, it can be said that sustainable agriculture and international efforts are necessary to maintain a balance between supply and demand in the future.
Pineapple imports (worldwide)
Analyzing pineapple import volume data from the past 60 years reveals an increase in global demand for pineapple. In particular, American demand has expanded significantly in recent years, reaching a record high of 7.23 Mt in 2021. This figure is double compared to the previous peak. This increase indicates that American demand for pineapple is expanding rapidly. This trend reflects the growing health consciousness in many countries, including the United States, and the recognition of pineapple as a popular food. Furthermore, as the demand for pineapple increases, producing countries may be increasing production to meet the demand. This has expanded the global pineapple market and made it an important player in the agricultural economy. In the future, sustainable production methods and transportation infrastructure will be required to meet the growing demand.
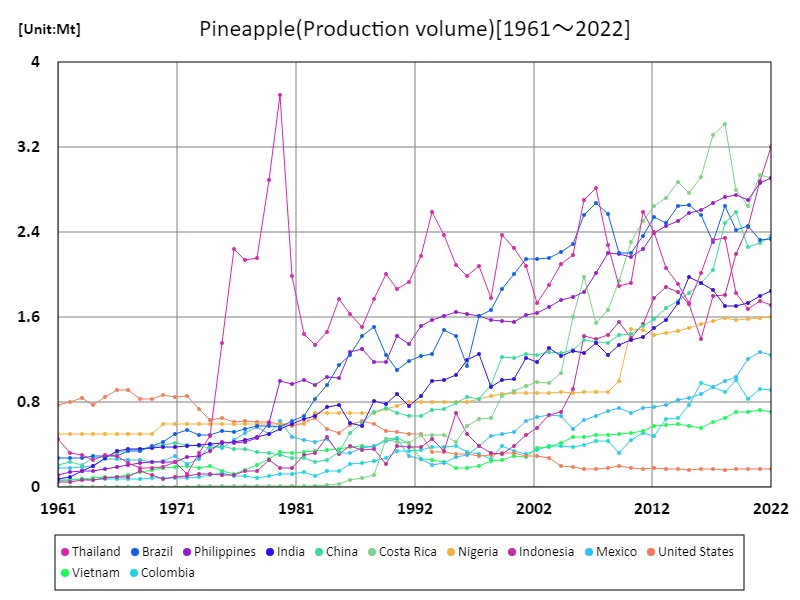
The maximum is 3.69Mt[1980] of Thailand, and the current value is about 46.5%
Pineapple imports (latest year, world)
Global pineapple imports were led by the United States, which recorded a massive figure of 7.23Mt in 2021. This is a substantial portion when considering the overall global demand for pineapples. Given that the average import volume was 99.2kt, it can be seen that the United States’ imports are significantly larger. This figure suggests that the United States is the largest demand country for pineapples. The increase in American demand may be influenced by an increase in health consciousness and the growing popularity of pineapples. On the other hand, when considering the import volumes of other countries, it can be seen that the demand for pineapples is stable and high globally. This shows that pineapples are a popular fruit in many regions and are loved by many people around the world. Furthermore, the total import volume of 17.8Mt highlights the important position that pineapples occupy in the global agricultural market. In the future, pineapple-producing countries may need to increase production to meet the increasing demand, but at the same time, the adoption of sustainable agricultural practices will be important.
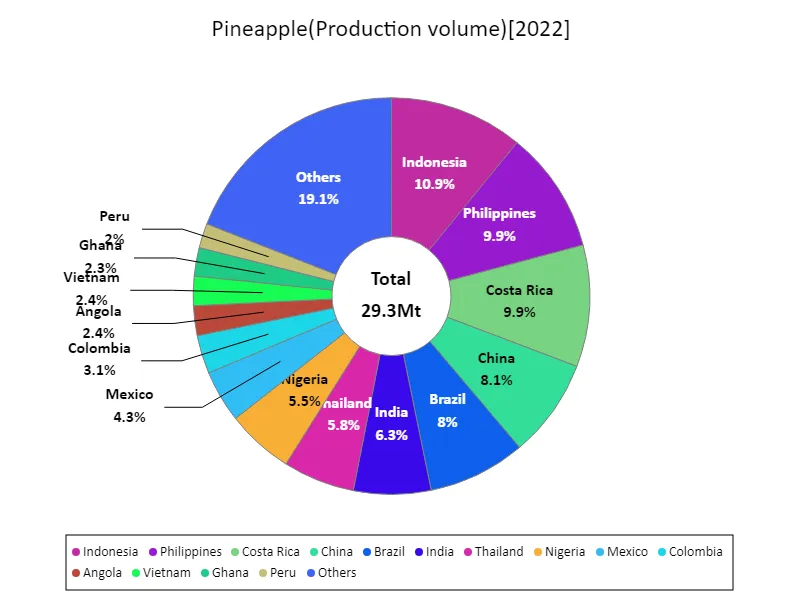
The maximum is 3.2Mt of Indonesia, the average is 341kt, and the total is 29.3Mt
Pineapple imports (continent)
Pineapple imports in 2021 reached a record high of 9.73 Mt in Europe, marking an interesting change in the global pineapple market. Previously, the largest import volume of pineapples was recorded by the United States, but this data puts Europe in the lead. This change likely reflects the rapid increase in pineapple demand in Europe. Due to increased health consciousness and diversification of food culture, pineapple has become an increasingly popular fruit, which may have led to an increase in imports. Changes in global trade partnerships and economic growth in Europe may also be influencing this trend. Such changes are likely to occur in the global agricultural market at any time, and producing and exporting countries need to be flexible in order to maintain a balance between supply and demand. It will be necessary to continue to pay attention to the growth of the pineapple market in Europe and trends in other regions affected by it.
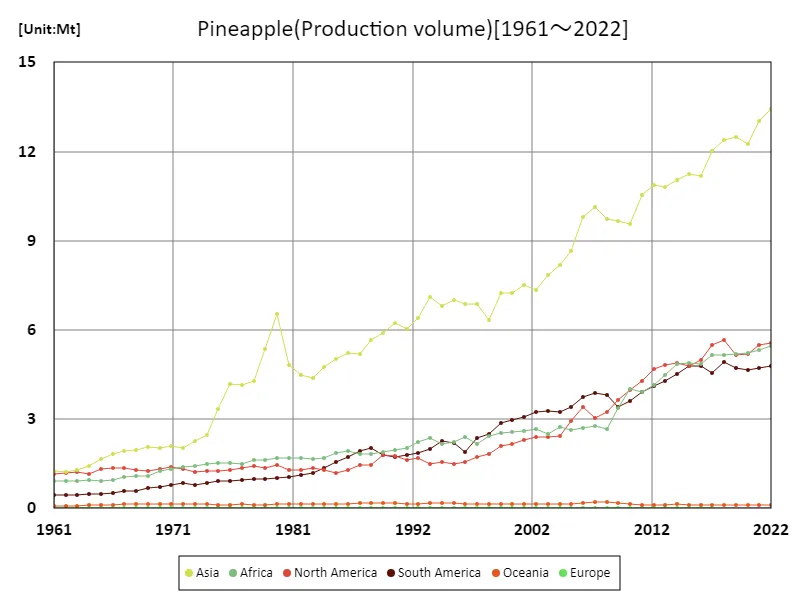
The maximum is the latest one, 13.4Mt of Asia
Pineapple imports (latest year, continent)
Looking at the pineapple import data for 2021, North America recorded the highest overall with a large figure of 7.8Mt. This figure shows that North America is the main demand area for pineapples. Considering that the average import volume is 2.96Mt, we can see that North America’s demand is very high. This is supported by the maturity of the North American pineapple market and the high demand for pineapples by people in the region. Meanwhile, the demand for pineapple remains high in other regions, and the popularity of pineapples is spreading globally, as shown by the total import volume of 17.7Mt. This trend shows that pineapple is a favorite fruit in many regions. In addition, the demand for pineapple may be increasing in regions other than North America. Such changes in demand could be caused by various factors, such as increasing health consciousness and changing food culture. It is important for agricultural economies to adapt to changes in demand, which will require a review of sustainable production methods and trade policies.
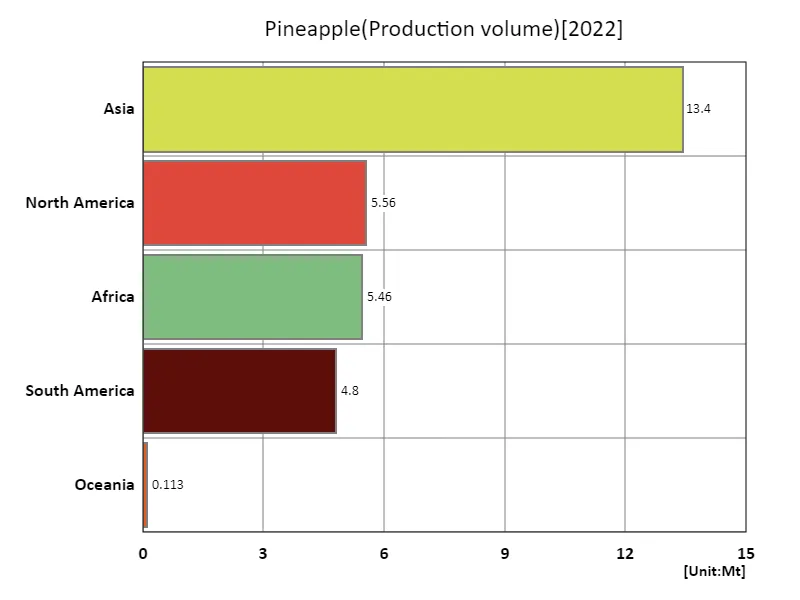
The maximum is 13.4Mt of Asia, the average is 5.87Mt, and the total is 29.4Mt
Main data
| Production(Pineapple, Production volume, t) [Mt] | ||||||||||
|---|---|---|---|---|---|---|---|---|---|---|
| World | Upper-middle-income countries | Asia | Lower-middle-income countries | Americas | South-eastern Asia | North America | Africa | Net Food Importing Developing Countries | Central America | |
| 2022 | 29.36 | 17.07 | 13.43 | 10.72 | 10.36 | 8.93 | 5.56 | 5.46 | 4.85 | 4.8 |
| 2021 | 28.71 | 16.69 | 13.03 | 10.51 | 10.23 | 8.64 | 5.5 | 5.34 | 4.71 | 4.8 |
| 2020 | 27.45 | 15.7 | 12.25 | 10.21 | 9.84 | 7.95 | 5.18 | 5.24 | 4.63 | 4.49 |
| 2019 | 27.66 | 15.95 | 12.47 | 10.15 | 9.89 | 7.88 | 5.16 | 5.17 | 4.57 | 4.44 |
| 2018 | 28.29 | 16.72 | 12.39 | 10.03 | 10.6 | 7.92 | 5.68 | 5.17 | 4.45 | 5.01 |
| 2017 | 27.34 | 15.59 | 12.01 | 10.11 | 10.05 | 7.81 | 5.5 | 5.15 | 4.41 | 4.86 |
| 2016 | 25.93 | 14.55 | 11.17 | 9.88 | 9.78 | 7.05 | 5 | 4.87 | 4.18 | 4.37 |
| 2015 | 25.83 | 14.45 | 11.25 | 9.87 | 9.59 | 7.16 | 4.79 | 4.87 | 4.16 | 4.14 |
| 2014 | 25.43 | 14.39 | 11.04 | 9.57 | 9.39 | 7.27 | 4.87 | 4.86 | 4.2 | 4.18 |
| 2013 | 24.49 | 14.15 | 10.82 | 9.17 | 9.09 | 7.3 | 4.81 | 4.47 | 4.07 | 4.03 |
| 2012 | 23.96 | 14.08 | 10.89 | 8.69 | 8.81 | 7.54 | 4.69 | 4.14 | 3.71 | 3.95 |
| 2011 | 22.77 | 13.34 | 10.54 | 8.28 | 8.19 | 7.3 | 4.28 | 3.93 | 3.28 | 3.78 |
| 2010 | 21.3 | 11.84 | 9.55 | 8.23 | 7.59 | 6.41 | 3.99 | 4.01 | 3.24 | 3.54 |
| 2009 | 20.26 | 11.46 | 9.65 | 7.52 | 7.04 | 6.58 | 3.64 | 3.37 | 3 | 3.2 |
| 2008 | 19.67 | 11.72 | 9.74 | 6.69 | 7.04 | 6.86 | 3.24 | 2.68 | 2.7 | 2.86 |
| 2007 | 20.04 | 12.06 | 10.14 | 6.72 | 6.94 | 7.1 | 3.05 | 2.76 | 2.78 | 2.69 |
| 2006 | 19.83 | 12.18 | 9.79 | 6.39 | 7.15 | 6.81 | 3.4 | 2.7 | 2.73 | 3.06 |
| 2005 | 17.78 | 10.36 | 8.65 | 6.27 | 6.36 | 5.77 | 2.95 | 2.63 | 2.58 | 2.6 |
| 2004 | 16.73 | 9.35 | 8.17 | 6.21 | 5.68 | 5.38 | 2.43 | 2.74 | 2.69 | 2.03 |
| 2003 | 16.12 | 8.97 | 7.84 | 5.93 | 5.65 | 5.04 | 2.39 | 2.49 | 2.39 | 1.91 |
| 2002 | 15.78 | 8.67 | 7.33 | 5.89 | 5.63 | 4.68 | 2.4 | 2.68 | 2.56 | 1.89 |
| 2001 | 15.65 | 8.72 | 7.52 | 5.73 | 5.37 | 4.82 | 2.3 | 2.61 | 2.44 | 1.77 |
| 2000 | 15.11 | 8.48 | 7.24 | 5.41 | 5.14 | 4.79 | 2.15 | 2.57 | 2.34 | 1.67 |
| 1999 | 14.9 | 8.37 | 7.25 | 5.32 | 4.96 | 4.81 | 2.08 | 2.53 | 2.27 | 1.61 |
| 1998 | 13.21 | 6.91 | 6.34 | 5.15 | 4.3 | 4.22 | 1.82 | 2.42 | 2.11 | 1.38 |
| 1997 | 13.3 | 6.95 | 6.88 | 5.22 | 4.1 | 4.57 | 1.73 | 2.17 | 1.87 | 1.28 |
| 1996 | 12.87 | 6.35 | 6.88 | 5.4 | 3.44 | 4.59 | 1.55 | 2.39 | 2.08 | 1.11 |
| 1995 | 13.07 | 6.82 | 7 | 5.11 | 3.68 | 4.89 | 1.47 | 2.23 | 2 | 0.96 |
| 1994 | 12.95 | 6.71 | 6.81 | 4.97 | 3.8 | 4.82 | 1.54 | 2.16 | 2.02 | 0.97 |
| 1993 | 13.12 | 6.72 | 7.1 | 5.1 | 3.48 | 5.13 | 1.5 | 2.37 | 2.07 | 0.96 |
| 1992 | 12.31 | 6.21 | 6.39 | 4.73 | 3.54 | 4.62 | 1.68 | 2.22 | 1.78 | 0.98 |
| 1991 | 11.62 | 5.79 | 6.04 | 4.47 | 3.4 | 4.36 | 1.61 | 2.04 | 1.6 | 0.94 |
| 1990 | 11.84 | 5.85 | 6.24 | 4.67 | 3.48 | 4.4 | 1.77 | 1.96 | 1.55 | 1.08 |
| 1989 | 11.56 | 6.05 | 5.9 | 4.21 | 3.58 | 4.13 | 1.78 | 1.9 | 1.44 | 1.09 |
| 1988 | 11.15 | 5.71 | 5.67 | 4.07 | 3.49 | 3.92 | 1.47 | 1.81 | 1.36 | 0.7 |
| 1987 | 10.55 | 5.2 | 5.18 | 4.01 | 3.37 | 3.77 | 1.46 | 1.83 | 1.41 | 0.65 |
| 1986 | 10.31 | 5.02 | 5.22 | 4.05 | 3.02 | 3.89 | 1.3 | 1.92 | 1.43 | 0.56 |
| 1985 | 9.75 | 4.71 | 5.01 | 3.88 | 2.73 | 3.7 | 1.17 | 1.86 | 1.37 | 0.51 |
| 1984 | 9.23 | 4.33 | 4.76 | 3.77 | 2.65 | 3.54 | 1.3 | 1.68 | 1.25 | 0.63 |
| 1983 | 8.7 | 3.91 | 4.38 | 3.56 | 2.54 | 3.2 | 1.36 | 1.64 | 1.19 | 0.58 |
| 1982 | 8.72 | 3.97 | 4.48 | 3.52 | 2.41 | 3.31 | 1.3 | 1.68 | 1.25 | 0.58 |
| 1981 | 9.02 | 4.3 | 4.82 | 3.49 | 2.35 | 3.7 | 1.3 | 1.71 | 1.31 | 0.61 |
| 1980 | 10.83 | 6.08 | 6.54 | 3.46 | 2.46 | 5.43 | 1.45 | 1.69 | 1.29 | 0.75 |
| 1979 | 9.48 | 5.23 | 5.37 | 2.95 | 2.35 | 4.25 | 1.35 | 1.63 | 1.3 | 0.64 |
| 1978 | 8.41 | 4.39 | 4.28 | 2.72 | 2.39 | 3.21 | 1.41 | 1.62 | 1.29 | 0.7 |
| 1977 | 8.08 | 4.27 | 4.16 | 2.45 | 2.3 | 3.11 | 1.36 | 1.5 | 1.16 | 0.64 |
| 1976 | 8.04 | 4.26 | 4.19 | 2.42 | 2.2 | 3.13 | 1.29 | 1.54 | 1.17 | 0.57 |
| 1975 | 7.19 | 3.33 | 3.36 | 2.34 | 2.19 | 2.3 | 1.26 | 1.51 | 1.11 | 0.49 |
| 1974 | 6.21 | 2.47 | 2.47 | 2.27 | 2.11 | 1.44 | 1.27 | 1.5 | 1.04 | 0.51 |
| 1973 | 5.82 | 2.09 | 2.25 | 2.14 | 2 | 1.22 | 1.23 | 1.43 | 0.99 | 0.38 |
| 1972 | 5.7 | 1.93 | 2.02 | 2.06 | 2.15 | 1.04 | 1.31 | 1.38 | 0.94 | 0.32 |
| 1971 | 5.7 | 2.04 | 2.1 | 1.94 | 2.15 | 1.1 | 1.37 | 1.32 | 0.86 | 0.4 |
| 1970 | 5.45 | 1.85 | 2.03 | 1.92 | 2.01 | 1.05 | 1.31 | 1.27 | 0.82 | 0.34 |
| 1969 | 5.24 | 1.79 | 2.05 | 1.75 | 1.96 | 1.06 | 1.27 | 1.09 | 0.8 | 0.33 |
| 1968 | 5.06 | 1.7 | 1.96 | 1.69 | 1.87 | 1.03 | 1.28 | 1.08 | 0.72 | 0.34 |
| 1967 | 5.02 | 1.7 | 1.92 | 1.63 | 1.93 | 0.99 | 1.35 | 1.05 | 0.66 | 0.34 |
| 1966 | 4.76 | 1.65 | 1.82 | 1.5 | 1.89 | 0.98 | 1.36 | 0.95 | 0.56 | 0.34 |
| 1965 | 4.48 | 1.61 | 1.66 | 1.39 | 1.8 | 0.96 | 1.31 | 0.92 | 0.51 | 0.34 |
| 1964 | 4.13 | 1.49 | 1.44 | 1.28 | 1.65 | 0.84 | 1.17 | 0.95 | 0.51 | 0.27 |
| 1963 | 4 | 1.47 | 1.3 | 1.18 | 1.69 | 0.84 | 1.23 | 0.92 | 0.5 | 0.26 |
| 1962 | 3.85 | 1.45 | 1.23 | 1.08 | 1.63 | 0.82 | 1.17 | 0.91 | 0.46 | 0.24 |
| 1961 | 3.83 | 1.57 | 1.24 | 0.99 | 1.58 | 0.88 | 1.14 | 0.92 | 0.43 | 0.24 |


Comments