
Abstract
In 2021, Brazil led global orange production with 10.1 million tons, reflecting its historic dominance in the market. Over the past decades, Brazil consistently topped production charts due to favorable climate conditions and advanced agricultural practices. The country’s export trends show steady growth, driven by strong international demand. Conversely, other major producers like the U.S., Spain, and India have fluctuated in output due to varying climatic conditions and market dynamics. Brazil’s position underscores its crucial role in the global orange supply chain.
Orange exports (worldwide)
Since 1961, Brazil has been a dominant player in global orange production. The peak was reached in 1993 with 14.7 million tons, but current production is at 68.9% of this peak. This decline is attributed to factors such as disease outbreaks and fluctuating climate conditions. Despite this, Brazil remains a major exporter due to its established infrastructure and expertise. Other significant producers, like the U.S. and Spain, have seen varied trends influenced by regional factors and market demands, but Brazil’s substantial share highlights its ongoing influence in the global orange market.
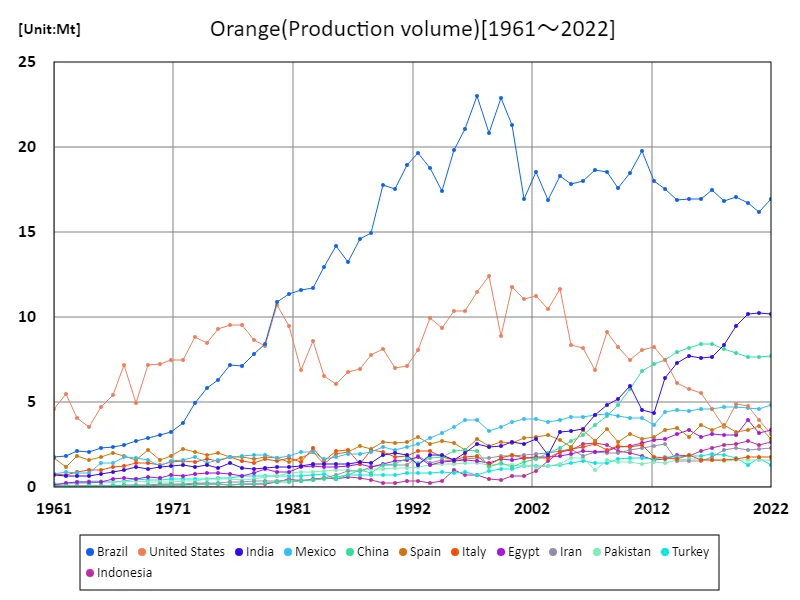
The maximum is 23Mt[1997] of Brazil, and the current value is about 73.5%
Orange exports (latest year, countries around the world)
In 2021, Brazil led global orange exports with 10.1 million tons, highlighting its dominant position in the market. The average export volume across countries was 219,000 tons, contributing to a global total of 33.5 million tons. This trend reflects Brazil’s substantial share and consistent output in global trade. Historically, Brazil’s production has fluctuated, but it remains a major exporter due to its large-scale production capabilities and export infrastructure, while other countries contribute to the diverse global supply.
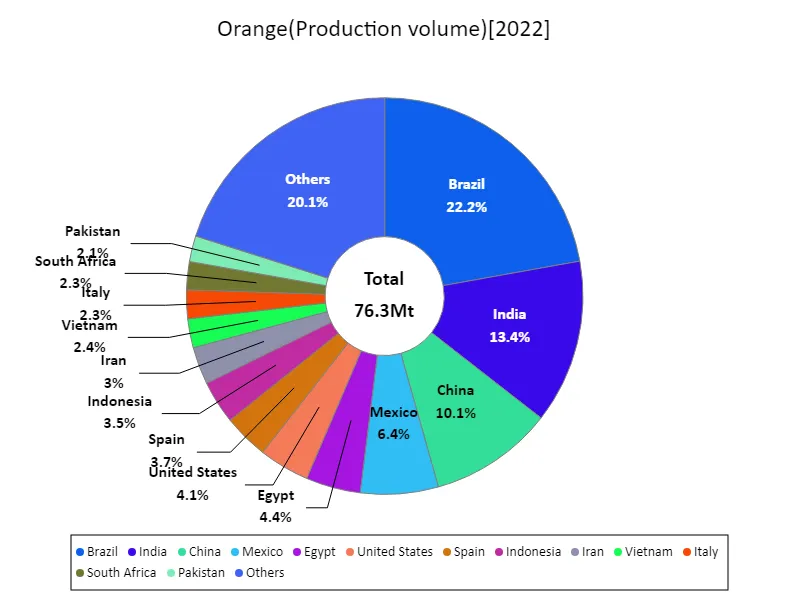
The maximum is 16.9Mt of Brazil, the average is 557kt, and the total is 76.3Mt
Orange exports (continent)
In 2021, South America led global orange exports with a record 15 million tons, underscoring its major role in the global market. This peak highlights the region’s significant production capabilities and export infrastructure. Over time, South American countries, particularly Brazil, have consistently dominated global orange exports due to favorable climates and advanced farming techniques. Other regions also contribute, but South America’s substantial share reflects its pivotal role in meeting global demand and shaping export trends.
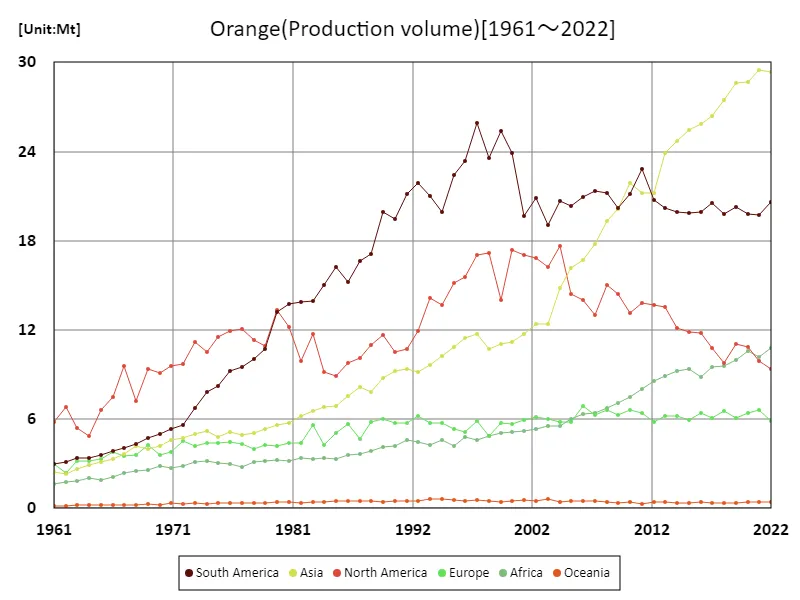
The maximum is 29.5Mt[2021] of Asia, and the current value is about 99.6%
Orange exports (latest year, continental)
In 2021, Europe led global orange exports with 11.3 million tons, surpassing other regions. This significant volume reflects Europe’s strong production and efficient export systems. The average export volume for regions worldwide was 5.58 million tons, contributing to a global total of 33.5 million tons. Europe’s dominance indicates a well-established infrastructure and high production capacity, while other regions contribute to global supply with varying levels of output. This trend highlights Europe’s crucial role in meeting global orange demand.
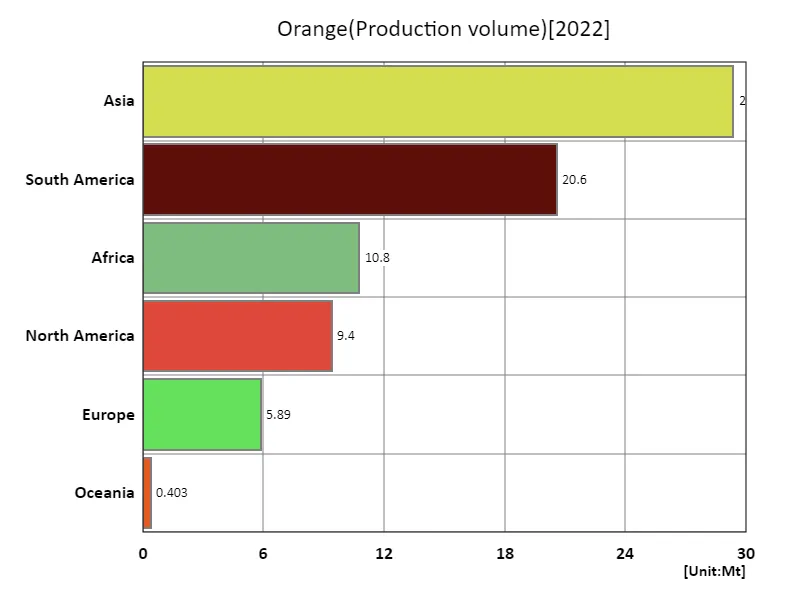
The maximum is 29.4Mt of Asia, the average is 12.7Mt, and the total is 76.4Mt
Main data
| Production(Orange, Production volume, t) [Mt] | ||||||||||
|---|---|---|---|---|---|---|---|---|---|---|
| World | Upper-middle-income countries | Americas | Asia | Lower-middle-income countries | South America | Brazil | Southern Asia | Africa | Net Food Importing Developing Countries | |
| 2022 | 76.41 | 39.83 | 30.02 | 29.35 | 24.82 | 20.62 | 16.93 | 14.21 | 10.75 | 10.46 |
| 2021 | 76.32 | 38.69 | 29.64 | 29.47 | 24.15 | 19.73 | 16.22 | 14.21 | 10.17 | 10.01 |
| 2020 | 76.68 | 38.59 | 30.66 | 28.65 | 24.13 | 19.8 | 16.72 | 14.06 | 10.59 | 10.45 |
| 2019 | 76.32 | 39.66 | 31.27 | 28.63 | 22.94 | 20.24 | 17.09 | 13.5 | 9.96 | 9.66 |
| 2018 | 73.48 | 39.72 | 29.52 | 27.45 | 21.02 | 19.77 | 16.84 | 12.21 | 9.59 | 9.16 |
| 2017 | 73.63 | 40.21 | 31.34 | 26.37 | 19.61 | 20.57 | 17.49 | 11.08 | 9.53 | 9.65 |
| 2016 | 73.24 | 39.27 | 31.74 | 25.84 | 18.9 | 19.96 | 16.98 | 10.88 | 8.86 | 9.41 |
| 2015 | 72.79 | 38.98 | 31.72 | 25.41 | 19.34 | 19.87 | 16.95 | 10.99 | 9.39 | 9.33 |
| 2014 | 72.52 | 38.85 | 32.01 | 24.71 | 18.63 | 19.9 | 16.93 | 10.54 | 9.26 | 9.08 |
| 2013 | 73.23 | 38.41 | 33.75 | 23.91 | 17.93 | 20.19 | 17.55 | 10.48 | 8.92 | 8.73 |
| 2012 | 70.44 | 37.74 | 34.43 | 21.23 | 15.8 | 20.74 | 18.01 | 8.42 | 8.59 | 8.83 |
| 2011 | 72.59 | 39.85 | 36.64 | 21.23 | 15.39 | 22.82 | 19.81 | 8.38 | 8.02 | 8.39 |
| 2010 | 70.67 | 37.13 | 34.26 | 21.89 | 16.41 | 21.11 | 18.5 | 9.76 | 7.49 | 8.23 |
| 2009 | 68.39 | 35.86 | 34.59 | 20.12 | 15.29 | 20.2 | 17.62 | 8.81 | 7.06 | 7.88 |
| 2008 | 69.32 | 36.21 | 36.22 | 19.29 | 14.64 | 21.19 | 18.54 | 8.59 | 6.77 | 7.6 |
| 2007 | 65.26 | 36.07 | 34.31 | 17.78 | 13.23 | 21.34 | 18.68 | 7.45 | 6.39 | 6.87 |
| 2006 | 65.4 | 34.8 | 34.95 | 16.73 | 12.94 | 20.91 | 18.03 | 7.11 | 6.33 | 7.51 |
| 2005 | 63.14 | 33.49 | 34.74 | 16.13 | 12.99 | 20.33 | 17.85 | 7.39 | 5.97 | 7.4 |
| 2004 | 64.94 | 33.08 | 38.36 | 14.79 | 12.03 | 20.69 | 18.31 | 6.84 | 5.55 | 6.89 |
| 2003 | 59.85 | 30.64 | 35.29 | 12.37 | 10.24 | 19.06 | 16.92 | 5.26 | 5.56 | 6.75 |
| 2002 | 62.07 | 31.54 | 37.74 | 12.37 | 10.87 | 20.9 | 18.53 | 6.12 | 5.33 | 6.3 |
| 2001 | 60.14 | 30.31 | 36.69 | 11.72 | 10.27 | 19.65 | 16.98 | 5.82 | 5.21 | 6.54 |
| 2000 | 63.85 | 33.59 | 41.3 | 11.21 | 10.41 | 23.91 | 21.33 | 5.92 | 5.12 | 6.59 |
| 1999 | 61.74 | 34.66 | 39.39 | 11.08 | 10.2 | 25.37 | 22.89 | 5.76 | 5.04 | 6.54 |
| 1998 | 61.67 | 32.01 | 40.74 | 10.69 | 9.95 | 23.56 | 20.85 | 5.49 | 4.88 | 6.38 |
| 1997 | 65.64 | 36.05 | 42.93 | 11.69 | 9.94 | 25.89 | 23.05 | 5.79 | 4.59 | 6.34 |
| 1996 | 60.77 | 33.39 | 38.93 | 11.44 | 9.64 | 23.39 | 21.08 | 5.2 | 4.82 | 6.42 |
| 1995 | 58.46 | 32.02 | 37.56 | 10.85 | 8.49 | 22.42 | 19.84 | 4.63 | 4.17 | 6.04 |
| 1994 | 54.81 | 28.33 | 33.6 | 10.24 | 8.91 | 19.9 | 17.45 | 4.93 | 4.61 | 6.22 |
| 1993 | 55.46 | 28.85 | 35.2 | 9.62 | 8.46 | 21.02 | 18.8 | 4.74 | 4.24 | 5.84 |
| 1992 | 54.07 | 29.01 | 33.75 | 9.16 | 8.43 | 21.86 | 19.68 | 4.42 | 4.49 | 6.04 |
| 1991 | 52 | 28.51 | 31.81 | 9.4 | 8.47 | 21.12 | 18.94 | 4.42 | 4.58 | 6.19 |
| 1990 | 49.7 | 26.34 | 30.03 | 9.26 | 8.18 | 19.49 | 17.52 | 4.57 | 4.16 | 5.84 |
| 1989 | 50.87 | 26.54 | 31.58 | 8.75 | 8.04 | 19.95 | 17.77 | 4.38 | 4.13 | 5.72 |
| 1988 | 46.05 | 23.38 | 28.1 | 7.8 | 7.1 | 17.12 | 14.98 | 3.74 | 3.83 | 5.39 |
| 1987 | 43.79 | 22.77 | 26.8 | 8.15 | 6.83 | 16.66 | 14.61 | 3.54 | 3.68 | 5.23 |
| 1986 | 42.23 | 21.15 | 25 | 7.53 | 6.56 | 15.19 | 13.23 | 3.35 | 3.57 | 5.12 |
| 1985 | 40.87 | 21.22 | 25.12 | 6.9 | 6.16 | 16.24 | 14.21 | 3.14 | 3.32 | 4.78 |
| 1984 | 38.98 | 20.07 | 24.17 | 6.83 | 5.99 | 14.99 | 12.94 | 2.9 | 3.36 | 4.75 |
| 1983 | 41.53 | 19.43 | 25.63 | 6.54 | 5.87 | 13.92 | 11.71 | 2.76 | 3.33 | 4.71 |
| 1982 | 38.12 | 18.88 | 23.78 | 6.21 | 5.71 | 13.88 | 11.6 | 2.63 | 3.38 | 4.56 |
| 1981 | 39.68 | 18.64 | 25.9 | 5.75 | 5.28 | 13.74 | 11.39 | 2.48 | 3.21 | 4.13 |
| 1980 | 40.01 | 17.65 | 26.57 | 5.58 | 5.23 | 13.22 | 10.89 | 2.27 | 3.27 | 4.06 |
| 1979 | 34.77 | 15.2 | 21.65 | 5.31 | 4.96 | 10.72 | 8.45 | 2.14 | 3.15 | 3.86 |
| 1978 | 33.86 | 14.37 | 21.31 | 5.09 | 4.76 | 10.02 | 7.83 | 1.99 | 3.13 | 3.74 |
| 1977 | 33.9 | 13.63 | 21.56 | 4.95 | 4.43 | 9.49 | 7.16 | 1.95 | 2.77 | 3.26 |
| 1976 | 34.03 | 13.02 | 21.12 | 5.15 | 4.81 | 9.2 | 7.17 | 2.25 | 2.96 | 3.28 |
| 1975 | 32.29 | 11.78 | 19.7 | 4.82 | 4.59 | 8.19 | 6.31 | 1.95 | 3.03 | 3.3 |
| 1974 | 31.43 | 11.14 | 18.33 | 5.21 | 4.84 | 7.82 | 5.86 | 2.07 | 3.17 | 3.4 |
| 1973 | 30.63 | 10.27 | 17.96 | 5.01 | 4.62 | 6.77 | 4.93 | 1.88 | 3.08 | 3.34 |
| 1972 | 27.7 | 8.97 | 15.28 | 4.76 | 4.36 | 5.58 | 3.79 | 1.91 | 2.85 | 3.08 |
| 1971 | 26.37 | 8.47 | 14.9 | 4.62 | 4.25 | 5.32 | 3.26 | 1.82 | 2.73 | 2.96 |
| 1970 | 24.92 | 7.94 | 14.1 | 4.16 | 4.21 | 4.99 | 3.1 | 1.74 | 2.82 | 3.03 |
| 1969 | 25.19 | 7.87 | 14.07 | 3.99 | 3.9 | 4.72 | 2.9 | 1.61 | 2.61 | 2.91 |
| 1968 | 22.02 | 7.69 | 11.56 | 4.17 | 3.89 | 4.34 | 2.72 | 1.76 | 2.48 | 2.79 |
| 1967 | 23.44 | 7.39 | 13.62 | 3.64 | 3.59 | 4.08 | 2.5 | 1.51 | 2.39 | 2.7 |
| 1966 | 20.77 | 6.69 | 11.3 | 3.32 | 3.29 | 3.85 | 2.35 | 1.38 | 2.14 | 2.51 |
| 1965 | 18.76 | 6.27 | 10.17 | 3.12 | 2.9 | 3.56 | 2.29 | 1.25 | 1.9 | 2.21 |
| 1964 | 16.6 | 5.49 | 8.26 | 2.91 | 2.9 | 3.37 | 2.05 | 1.16 | 2.05 | 2.27 |
| 1963 | 16.65 | 5.47 | 8.76 | 2.67 | 2.62 | 3.37 | 2.11 | 1.07 | 1.84 | 2.02 |
| 1962 | 16.62 | 5.14 | 9.94 | 2.33 | 2.43 | 3.12 | 1.85 | 0.96 | 1.8 | 1.83 |
| 1961 | 15.97 | 4.8 | 8.77 | 2.42 | 2.41 | 2.99 | 1.76 | 1.1 | 1.61 | 1.76 |


Comments