Abstract
Peanut production in the U.S. has seen fluctuating trends over the years. Historically, the U.S. has been one of the world’s largest producers, with key growing regions in the Southeast, including Georgia, Alabama, and Florida. Production peaked in the late 20th century but has experienced variability due to factors like weather conditions, pest challenges, and market demand. In 2023, U.S. production reached 5.89 billion pounds, a notable recovery from previous years. Advances in farming technology, improved crop management, and increased global demand have played key roles in stabilizing and slightly boosting output.
All classes of peanuts (from all over the world).
U.S. peanut production has experienced significant fluctuations since 1909, with the highest recorded production of 7.11 billion pounds in 2017. Early on, production grew steadily due to increasing demand and expanded farming regions, especially in the Southeast. However, production has been affected by factors like drought, market conditions, and pest infestations. As of 2023, the U.S. total stands at 82.8% of its 2017 peak. While still a major producer, output has been somewhat variable in recent years, influenced by environmental and economic factors, as well as advancements in farming practices.
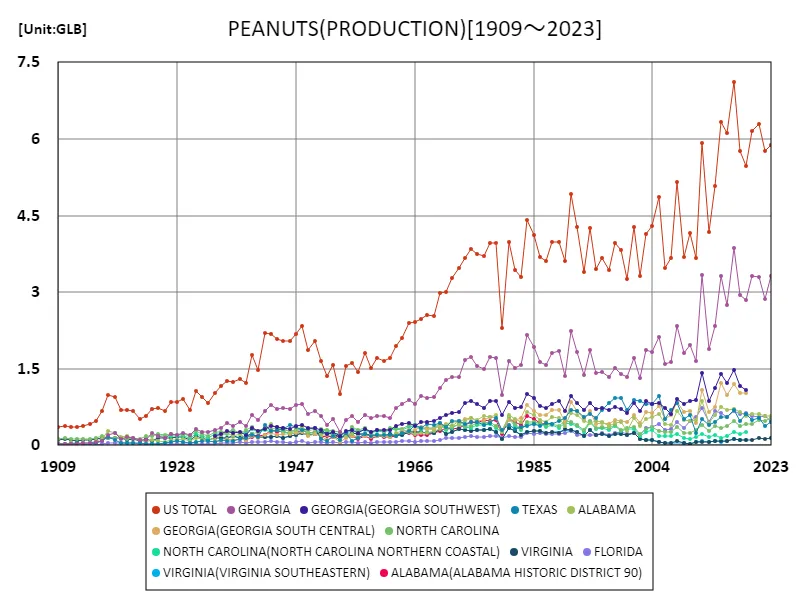
The maximum is 7.11GLB[2017] of US TOTAL, and the current value is about 82.8%
Peanuts all classes (latest year, worldwide).
Georgia has consistently been the leading producer of peanuts in the U.S., with 2023 production reaching 3.31 billion pounds, significantly higher than the national average of 559 million pounds. The state’s dominance in peanut farming is due to its favorable climate and soil conditions, along with established infrastructure and expertise in peanut cultivation. Nationally, total U.S. peanut production in 2023 was 6.14 billion pounds, reflecting the central role of Georgia in the industry. Overall, U.S. peanut production has been influenced by factors such as weather conditions, market trends, and agricultural innovations.
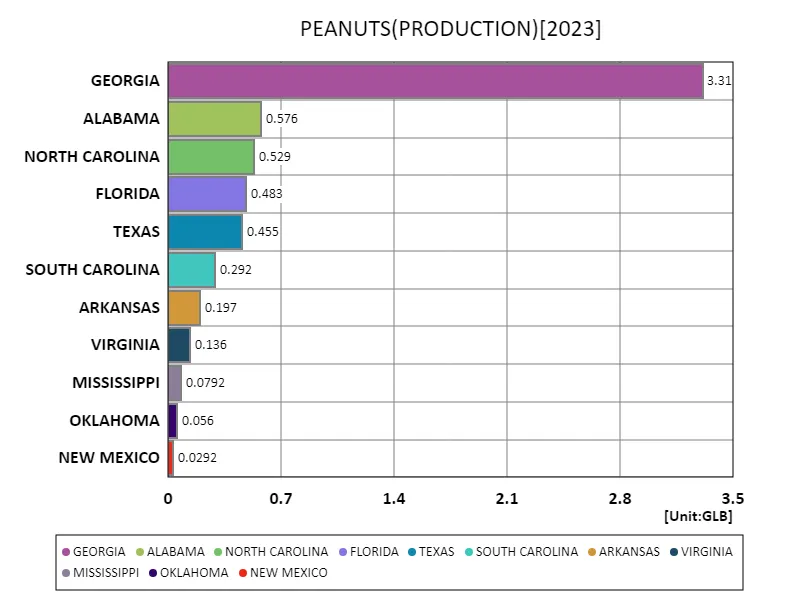
The maximum is 3.31GLB of GEORGIA, the average is 559MLB, and the total is 6.14GLB
Peanuts all classes (continental).
In 2023, Georgia maintained its position as the leading U.S. peanut producer, with a record 3.31 billion pounds. The state’s dominance is attributed to its ideal climate, soil, and extensive peanut-growing infrastructure. Overall U.S. peanut production in 2023 totaled 6.14 billion pounds, highlighting Georgia’s central role in the industry. Nationally, peanut production has been influenced by factors such as crop management advancements, market fluctuations, and environmental challenges, leading to varying output levels over the years. Georgia continues to drive the sector’s success.
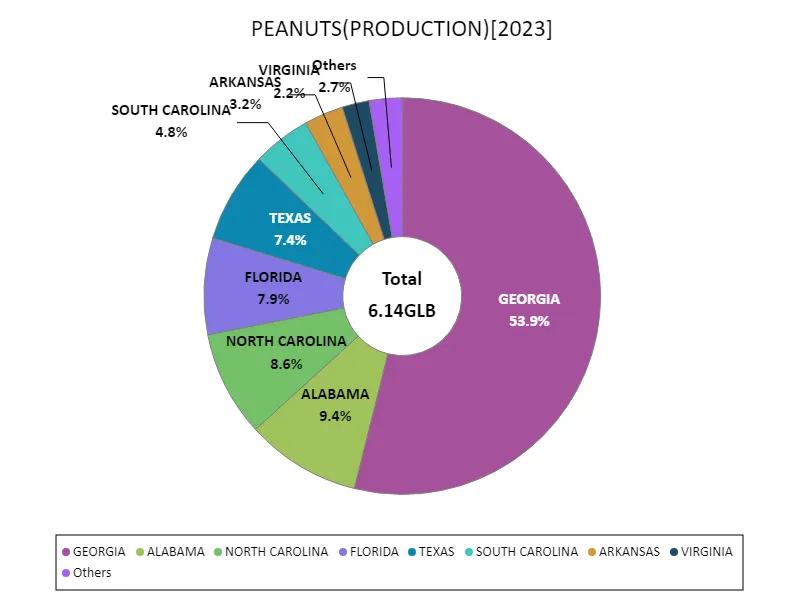
The maximum is 3.31GLB of GEORGIA, the average is 559MLB, and the total is 6.14GLB
Main data
| PEANUTS(ALL CLASSES, ALL PRODUCTION PRACTICES, ALL UTILIZATION PRACTICES, PRODUCTION, UNITED STATES) [GLB] | ||||||||||
|---|---|---|---|---|---|---|---|---|---|---|
| US TOTAL | GEORGIA | FLORIDA | ALABAMA | GEORGIA(GEORGIA OTHER COUNTIES) | NORTH CAROLINA | TEXAS | SOUTH CAROLINA | FLORIDA(FLORIDA OTHER COUNTIES) | TEXAS(TEXAS OTHER COUNTIES) | |
| 2023 | 5.89 | 3.31 | 0.48 | 0.58 | 0.53 | 0.46 | 0.29 | |||
| 2022 | 5.77 | 2.86 | 0.57 | 0.56 | 0.52 | 0.48 | 0.38 | 0.28 | 0.25 | 0.25 |
| 2021 | 6.29 | 3.3 | 0.56 | 0.61 | 0.74 | 0.5 | 0.54 | 0.27 | 0.21 | 0.23 |
| 2020 | 6.16 | 3.32 | 0.56 | 0.62 | 0.46 | 0.41 | 0.49 | 0.3 | 0.19 | 0.22 |
| 2019 | 5.46 | 2.84 | 0.64 | 0.58 | 0.42 | 0.61 | 0.22 | |||
| 2018 | 5.76 | 2.95 | 0.6 | 0.65 | 0.38 | 0.48 | 0.36 | |||
| 2017 | 7.11 | 3.86 | 0.68 | 0.7 | 0.48 | 0.7 | 0.47 | |||
| 2016 | 6.11 | 2.75 | 0.55 | 0.69 | 0.38 | 0.56 | 0.4 | |||
| 2015 | 6.32 | 3.32 | 0.63 | 0.74 | 0.34 | 0.56 | 0.37 | |||
| 2014 | 5.07 | 2.34 | 0.67 | 0.58 | 0.38 | 0.46 | 0.42 | |||
| 2013 | 4.17 | 1.89 | 0.45 | 0.43 | 0.28 | 0.4 | 0.25 | |||
| 2012 | 5.92 | 3.34 | 0.74 | 0.88 | 0.39 | 0.52 | 0.28 | |||
| 2011 | 3.66 | 1.65 | 0.55 | 0.49 | 0.29 | 0.25 | 0.24 | |||
| 2010 | 4.16 | 1.96 | 0.47 | 0.48 | 0.23 | 0.59 | 0.22 | |||
| 2009 | 3.69 | 1.8 | 0.34 | 0.5 | 0.24 | 0.51 | 0.15 | |||
| 2008 | 5.16 | 2.33 | 0.45 | 0.68 | 0.36 | 0.83 | 0.27 | |||
| 2007 | 3.67 | 1.62 | 0.32 | 0.4 | 0.26 | 0.69 | 0.18 | |||
| 2006 | 3.46 | 1.6 | 0.3 | 0.41 | 0.27 | 0.51 | 0.17 | |||
| 2005 | 4.87 | 2.13 | 0.41 | 0.61 | 0.29 | 0.98 | 0.17 | |||
| 2004 | 4.29 | 1.82 | 0.36 | 0.56 | 0.37 | 0.8 | 0.11 | |||
| 2003 | 4.14 | 1.86 | 0.35 | 0.51 | 0.32 | 0.81 | 0.06 | |||
| 2002 | 3.32 | 1.31 | 0.21 | 0.37 | 0.22 | 0.87 | 0.02 | |||
| 2001 | 4.28 | 1.71 | 0.25 | 0.53 | 0.36 | 0.9 | 0.03 | |||
| 2000 | 3.27 | 1.33 | 0.21 | 0.27 | 0.34 | 0.7 | 0.03 | |||
| 1999 | 3.83 | 1.4 | 0.26 | 0.45 | 0.3 | 0.93 | 0.03 | |||
| 1998 | 3.96 | 1.51 | 0.23 | 0.43 | 0.4 | 0.92 | 0.03 | |||
| 1997 | 3.43 | 1.33 | 0.2 | 0.37 | 0.33 | 0.82 | 0.03 | |||
| 1996 | 3.66 | 1.43 | 0.24 | 0.45 | 0.37 | 0.69 | 0.03 | |||
| 1995 | 3.46 | 1.41 | 0.19 | 0.48 | 0.35 | 0.54 | 0.03 | |||
| 1994 | 4.25 | 1.86 | 0.21 | 0.45 | 0.49 | 0.61 | 0.04 | |||
| 1993 | 3.39 | 1.38 | 0.19 | 0.47 | 0.3 | 0.55 | 0.02 | |||
| 1992 | 4.28 | 1.82 | 0.2 | 0.59 | 0.41 | 0.68 | 0.03 | |||
| 1991 | 4.93 | 2.23 | 0.28 | 0.64 | 0.46 | 0.68 | 0.03 | |||
| 1990 | 3.6 | 1.35 | 0.23 | 0.39 | 0.48 | 0.53 | 0.03 | |||
| 1989 | 3.99 | 1.85 | 0.21 | 0.54 | 0.37 | 0.48 | 0.03 | |||
| 1988 | 3.98 | 1.8 | 0.23 | 0.56 | 0.42 | 0.42 | 0.03 | |||
| 1987 | 3.62 | 1.58 | 0.22 | 0.47 | 0.39 | 0.44 | 0.03 | |||
| 1986 | 3.7 | 1.63 | 0.23 | 0.49 | 0.44 | 0.39 | 0.03 | |||
| 1985 | 4.12 | 1.92 | 0.22 | 0.59 | 0.45 | 0.42 | 0.03 | |||
| 1984 | 4.41 | 2.16 | 0.25 | 0.65 | 0.45 | 0.37 | 0.04 | |||
| 1983 | 3.3 | 1.57 | 0.17 | 0.45 | 0.32 | 0.36 | 0.03 | |||
| 1982 | 3.44 | 1.52 | 0.15 | 0.52 | 0.42 | 0.33 | 0.03 | |||
| 1981 | 3.98 | 1.66 | 0.18 | 0.6 | 0.56 | 0.39 | 0.04 | |||
| 1980 | 2.3 | 0.99 | 0.14 | 0.27 | 0.29 | 0.29 | 0.01 | |||
| 1979 | 3.97 | 1.7 | 0.18 | 0.58 | 0.38 | 0.53 | 0.03 | |||
| 1978 | 3.95 | 1.73 | 0.18 | 0.55 | 0.47 | 0.44 | 0.04 | |||
| 1977 | 3.72 | 1.5 | 0.17 | 0.58 | 0.44 | 0.39 | 0.03 | |||
| 1976 | 3.74 | 1.55 | 0.17 | 0.5 | 0.44 | 0.46 | 0.02 | |||
| 1975 | 3.85 | 1.73 | 0.18 | 0.53 | 0.37 | 0.46 | 0.03 | |||
| 1974 | 3.67 | 1.66 | 0.17 | 0.47 | 0.38 | 0.41 | 0.03 | |||
| 1973 | 3.47 | 1.34 | 0.15 | 0.4 | 0.47 | 0.47 | 0.03 | |||
| 1972 | 3.27 | 1.34 | 0.14 | 0.37 | 0.37 | 0.48 | 0.03 | |||
| 1971 | 3.01 | 1.27 | 0.14 | 0.4 | 0.33 | 0.37 | 0.03 | |||
| 1970 | 2.98 | 1.13 | 0.11 | 0.32 | 0.45 | 0.43 | 0.03 | |||
| 1969 | 2.54 | 0.95 | 0.09 | 0.29 | 0.34 | 0.39 | 0.02 | |||
| 1968 | 2.55 | 0.93 | 0.09 | 0.25 | 0.35 | 0.43 | 0.02 | |||
| 1967 | 2.48 | 0.98 | 0.08 | 0.24 | 0.35 | 0.33 | 0.02 | |||
| 1966 | 2.42 | 0.81 | 0.07 | 0.23 | 0.4 | 0.4 | 0.02 | |||
| 1965 | 2.39 | 0.88 | 0.08 | 0.26 | 0.39 | 0.28 | 0.02 | |||
| 1964 | 2.1 | 0.8 | 0.08 | 0.24 | 0.33 | 0.25 | 0.01 | |||
| 1963 | 1.94 | 0.73 | 0.07 | 0.22 | 0.34 | 0.18 | 0.01 | |||
| 1962 | 1.72 | 0.53 | 0.06 | 0.19 | 0.34 | 0.2 | 0.01 | |||
| 1961 | 1.66 | 0.57 | 0.06 | 0.19 | 0.29 | 0.2 | 0.01 | |||
| 1960 | 1.72 | 0.57 | 0.06 | 0.21 | 0.31 | 0.2 | 0.01 | |||
| 1959 | 1.52 | 0.53 | 0.04 | 0.15 | 0.27 | 0.19 | 0.01 | |||
| 1958 | 1.81 | 0.59 | 0.06 | 0.22 | 0.33 | 0.22 | 0.01 | |||
| 1957 | 1.44 | 0.46 | 0.05 | 0.14 | 0.31 | 0.15 | 0.01 | |||
| 1956 | 1.61 | 0.57 | 0.06 | 0.22 | 0.35 | 0.09 | 0.01 | |||
| 1955 | 1.55 | 0.5 | 0.06 | 0.21 | 0.2 | 0.24 | 0.01 | |||
| 1954 | 1.01 | 0.27 | 0.04 | 0.11 | 0.25 | 0.11 | 0.01 | |||
| 1953 | 1.57 | 0.52 | 0.06 | 0.2 | 0.27 | 0.18 | 0.01 | |||
| 1952 | 1.36 | 0.39 | 0.05 | 0.21 | 0.31 | 0.09 | 0.01 | |||
| 1951 | 1.66 | 0.58 | 0.06 | 0.21 | 0.32 | 0.12 | 0.01 | |||
| 1950 | 2.04 | 0.68 | 0.06 | 0.32 | 0.25 | 0.33 | 0.02 | |||
| 1949 | 1.86 | 0.61 | 0.05 | 0.29 | 0.24 | 0.33 | 0.01 | |||
| 1948 | 2.34 | 0.82 | 0.09 | 0.36 | 0.35 | 0.3 | 0.02 | |||
| 1947 | 2.18 | 0.78 | 0.07 | 0.29 | 0.3 | 0.36 | 0.01 | |||
| 1946 | 2.04 | 0.72 | 0.05 | 0.26 | 0.27 | 0.4 | 0.02 | |||
| 1945 | 2.04 | 0.72 | 0.07 | 0.34 | 0.3 | 0.32 | 0.02 | |||
| 1944 | 2.08 | 0.71 | 0.06 | 0.33 | 0.35 | 0.31 | 0.02 | |||
| 1943 | 2.18 | 0.79 | 0.07 | 0.42 | 0.31 | 0.28 | 0.03 | |||
| 1942 | 2.19 | 0.67 | 0.07 | 0.34 | 0.34 | 0.39 | 0.02 | |||
| 1941 | 1.48 | 0.49 | 0.06 | 0.25 | 0.27 | 0.16 | 0.01 | |||
| 1940 | 1.77 | 0.6 | 0.07 | 0.23 | 0.37 | 0.19 | 0.02 | |||
| 1939 | 1.21 | 0.37 | 0.04 | 0.14 | 0.29 | 0.13 | 0.01 | |||
| 1938 | 1.29 | 0.45 | 0.06 | 0.22 | 0.24 | 0.12 | 0.01 | |||
| 1937 | 1.23 | 0.38 | 0.04 | 0.19 | 0.31 | 0.09 | 0.01 | |||
| 1936 | 1.26 | 0.43 | 0.05 | 0.24 | 0.26 | 0.09 | 0.01 | |||
| 1935 | 1.15 | 0.34 | 0.04 | 0.2 | 0.25 | 0.1 | 0.01 | |||
| 1934 | 1.01 | 0.29 | 0.03 | 0.17 | 0.25 | 0.06 | 0.01 | |||
| 1933 | 0.82 | 0.25 | 0.03 | 0.09 | 0.18 | 0.08 | 0.01 | |||
| 1932 | 0.94 | 0.26 | 0.02 | 0.12 | 0.23 | 0.08 | 0.01 | |||
| 1931 | 1.06 | 0.31 | 0.03 | 0.14 | 0.28 | 0.07 | 0.01 | |||
| 1930 | 0.7 | 0.21 | 0.03 | 0.09 | 0.18 | 0.05 | 0.01 | |||
| 1929 | 0.9 | 0.24 | 0.03 | 0.12 | 0.22 | 0.06 | 0.01 | |||
| 1928 | 0.84 | 0.19 | 0.03 | 0.11 | 0.21 | 0.08 | 0.01 | |||
| 1927 | 0.84 | 0.23 | 0.02 | 0.11 | 0.22 | 0.06 | 0.01 | |||
| 1926 | 0.66 | 0.14 | 0.02 | 0.07 | 0.2 | 0.04 | 0 | |||
| 1925 | 0.72 | 0.18 | 0.02 | 0.09 | 0.22 | 0.03 | 0.01 | |||
| 1924 | 0.71 | 0.24 | 0.03 | 0.11 | 0.18 | 0.02 | 0.01 | |||
| 1923 | 0.57 | 0.11 | 0.02 | 0.07 | 0.18 | 0.03 | 0.01 | |||
| 1922 | 0.52 | 0.11 | 0.03 | 0.1 | 0.13 | 0.04 | 0 | |||
| 1921 | 0.68 | 0.15 | 0.04 | 0.14 | 0.14 | 0.05 | 0 | |||
| 1920 | 0.7 | 0.16 | 0.04 | 0.17 | 0.13 | 0.05 | 0 | |||
| 1919 | 0.69 | 0.12 | 0.04 | 0.17 | 0.14 | 0.05 | 0 | |||
| 1918 | 0.95 | 0.24 | 0.04 | 0.24 | 0.14 | 0.09 | 0.01 | |||
| 1917 | 0.99 | 0.2 | 0.04 | 0.27 | 0.15 | 0.16 | 0.01 | |||
| 1916 | 0.67 | 0.08 | 0.02 | 0.13 | 0.18 | 0.09 | 0 | |||
| 1915 | 0.48 | 0.06 | 0.01 | 0.08 | 0.14 | 0.04 | 0.01 | |||
| 1914 | 0.42 | 0.05 | 0.01 | 0.05 | 0.13 | 0.03 | 0 | |||
| 1913 | 0.38 | 0.04 | 0.01 | 0.04 | 0.13 | 0.03 | 0 | |||
| 1912 | 0.36 | 0.03 | 0.01 | 0.04 | 0.12 | 0.04 | 0 | |||
| 1911 | 0.37 | 0.03 | 0.01 | 0.04 | 0.12 | 0.03 | 0 | |||
| 1910 | 0.38 | 0.03 | 0.01 | 0.04 | 0.14 | 0.03 | 0 | |||
| 1909 | 0.35 | 0.03 | 0.01 | 0.04 | 0.12 | 0.03 | 0 | |||


Comments