Abstract
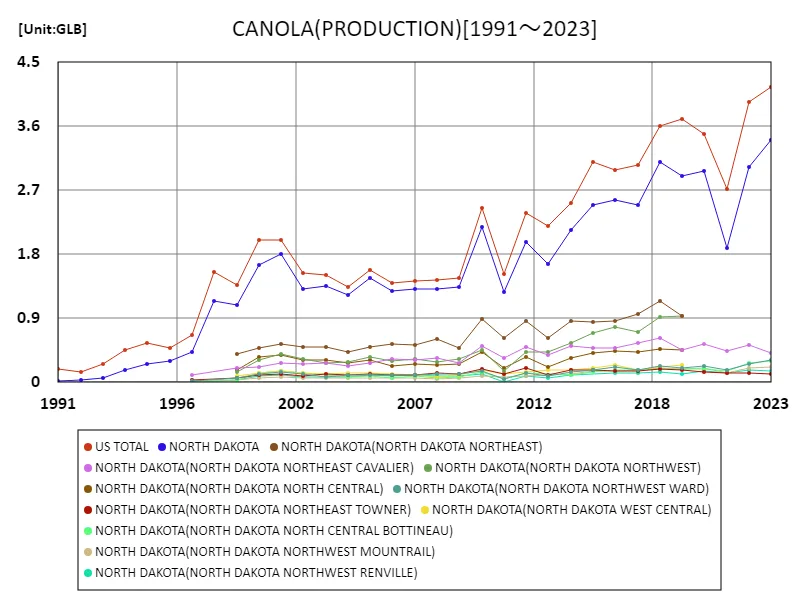
Overall canola production in the U.S. agricultural sector will reach 4.16 billion pounds in 2023, making it the largest in the world. The figure reflects years of technological advances and efficiencies in American agriculture, particularly as canola production expands amid growing demand. Canola production in the United States is characterized by production in large agricultural enterprises and agricultural regions with advanced technology. Also, due to the diversity of climatic conditions and soils, canola is grown in many different regions as a major agricultural product. In addition, efforts are being strengthened in sustainability and quality control, with efforts being made to increase production and maintain quality. As such, U.S. canola production plays an important role in global markets through a combination of advanced technology and sustainable agricultural practices. .
All canola classes (worldwide).
Analysis of data on U.S. canola production shows steady growth from 1991 to 2023. Canola production is set to expand rapidly during this period, reaching a record high of 4.16 billion pounds in 2023. Compared to peak production, current production is equivalent to 100%, suggesting that canola remains an important crop in American agriculture. The increase is due to advances in agricultural technology, improved production efficiency, and expanding market demand. In particular, the widespread use of canola for various purposes has led to increased demand for it as food, biofuel and industrial raw material. Additionally, interest in sustainable agricultural practices is growing, and environmentally conscious approaches are being adopted in canola production. These trends are expected to lead to sustained expansion of canola production and for it to continue to play an important role in American agriculture. .


The maximum is the latest one, 4.16GLB of US TOTAL
Canola all classes (latest year, worldwide).
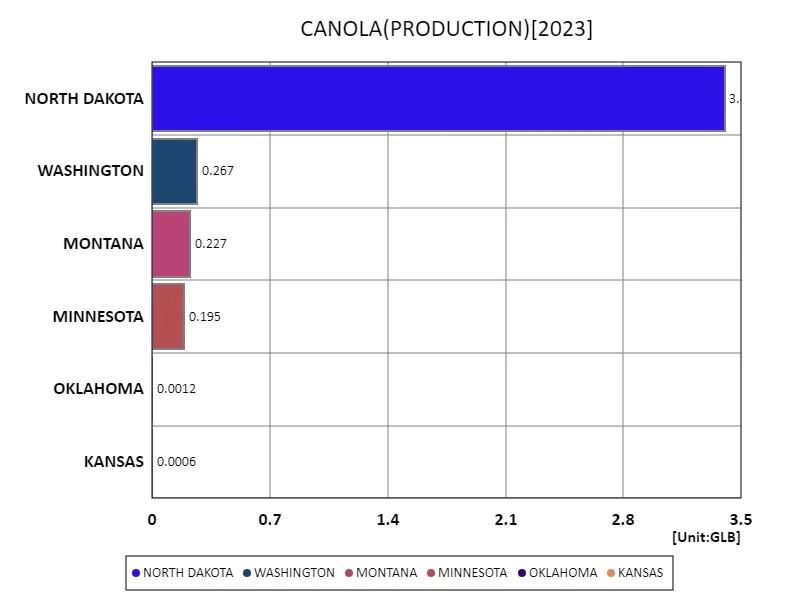
Canola production in the U.S. reached a record high of 4.09 billion pounds in 2023, with North Dakota producing an astounding 3.4 billion pounds, an overall average of 682 million pounds, and a total of 4.09 billion pounds. This reflects the important role canola plays in American agriculture. North Dakota’s overwhelming production volume is due to the region’s climatic conditions and soil suitability. Canola production is also increasing in North Dakota and other parts of the U.S. due to advances in agricultural technology and the adoption of sustainable farming practices. Canola has a wide range of uses, from food to biofuel and industrial raw materials, so increasing demand is also a factor in increasing production. In addition, canola is said to have health benefits, and demand for it is increasing worldwide. Based on these characteristics and trends, U.S. canola production is expected to expand sustainably and continue to play an important role in the agricultural economy. .


The maximum is 3.4GLB of NORTH DAKOTA, the average is 682MLB, and the total is 4.09GLB
Canola all classes (continental).
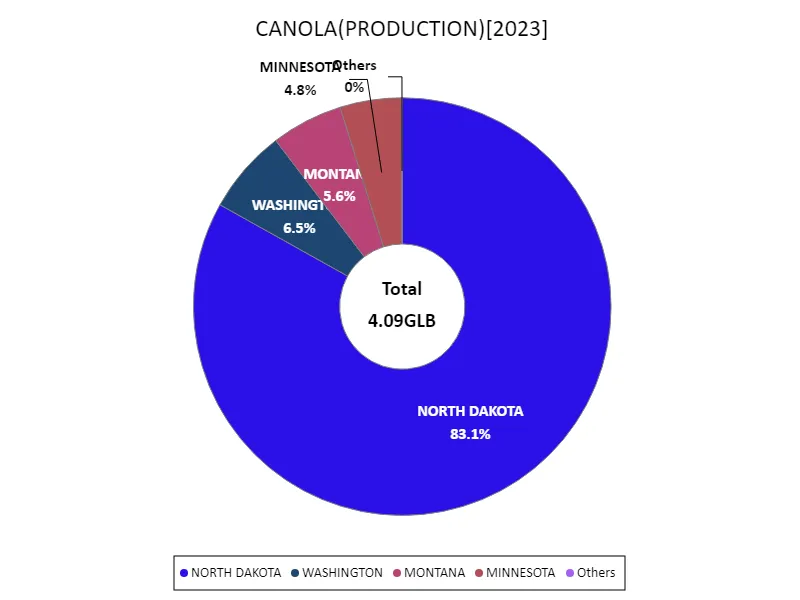
North Dakota will be the largest producer of canola in the United States in 2023, with a staggering 3.4 billion pounds. This achievement is a result of the agricultural region’s fertile soil and climatic conditions, as well as advanced agricultural techniques. Canola-growing regions of the United States, including North Dakota, have been adopting sustainable agricultural practices for many years with notable results. Canola is a versatile crop with a wide range of uses, from food to biofuel and industrial raw materials, which has also contributed to the increase in production. Canola is also attracting attention for its positive health effects, and demand for it is increasing worldwide. Against this background, it is clear that canola production in the United States continues to expand steadily and occupies an important position in the agricultural economy. Canola production is expected to continue to increase further through the spread of sustainable agricultural practices and technological innovation. .


The maximum is 3.4GLB of NORTH DAKOTA, the average is 682MLB, and the total is 4.09GLB
Main data
| CANOLA(ALL CLASSES, ALL PRODUCTION PRACTICES, ALL UTILIZATION PRACTICES, PRODUCTION, UNITED STATES) [GLB] | ||||||||||
|---|---|---|---|---|---|---|---|---|---|---|
| US TOTAL | NORTH DAKOTA | NORTH DAKOTA(NORTH DAKOTA NORTHEAST CAVALIER) | NORTH DAKOTA(NORTH DAKOTA NORTH CENTRAL BOTTINEAU) | NORTH DAKOTA(NORTH DAKOTA NORTHWEST WARD) | WASHINGTON | NORTH DAKOTA(NORTH DAKOTA NORTHWEST MOUNTRAIL) | MONTANA | NORTH DAKOTA(NORTH DAKOTA NORTHWEST RENVILLE) | NORTH DAKOTA(NORTH DAKOTA NORTHEAST RAMSEY) | |
| 2023 | 4.16 | 3.4 | 0.41 | 0.3 | 0.31 | 0.27 | 0.22 | 0.23 | 0.15 | 0.12 |
| 2022 | 3.95 | 3.03 | 0.52 | 0.27 | 0.25 | 0.22 | 0.2 | 0.17 | 0.17 | 0.15 |
| 2021 | 2.72 | 1.89 | 0.44 | 0.16 | 0.18 | 0.18 | 0.13 | 0.14 | 0.12 | 0.12 |
| 2020 | 3.5 | 2.96 | 0.53 | 0.19 | 0.23 | 0.2 | 0.21 | 0.24 | 0.15 | 0.12 |
| 2019 | 3.71 | 2.9 | 0.46 | 0.2 | 0.13 | 0.19 | 0.2 | 0.12 | ||
| 2018 | 3.61 | 3.1 | 0.62 | 0.18 | 0.22 | 0.14 | 0.21 | 0.13 | 0.14 | 0.16 |
| 2017 | 3.06 | 2.5 | 0.55 | 0.17 | 0.17 | 0.09 | 0.17 | 0.12 | 0.13 | 0.11 |
| 2016 | 2.99 | 2.57 | 0.49 | 0.18 | 0.21 | 0.06 | 0.16 | 0.09 | 0.14 | 0.11 |
| 2015 | 3.09 | 2.49 | 0.49 | 0.15 | 0.18 | 0.03 | 0.16 | 0.09 | ||
| 2014 | 2.52 | 2.14 | 0.51 | 0.11 | 0.15 | 0.06 | 0.12 | 0.06 | 0.1 | 0.1 |
| 2013 | 2.2 | 1.67 | 0.38 | 0.09 | 0.06 | 0.11 | 0.06 | |||
| 2012 | 2.38 | 1.97 | 0.5 | 0.13 | 0.13 | 0.03 | 0.09 | 0.06 | 0.09 | 0.11 |
| 2011 | 1.53 | 1.28 | 0.34 | 0.04 | 0.04 | 0.02 | 0.07 | 0.04 | 0.01 | 0.1 |
| 2010 | 2.45 | 2.18 | 0.51 | 0.14 | 0.16 | 0.09 | 0.03 | 0.11 | 0.1 | |
| 2009 | 1.46 | 1.33 | 0.27 | 0.08 | 0.11 | 0.06 | 0.01 | 0.09 | 0.04 | |
| 2008 | 1.45 | 1.31 | 0.35 | 0.06 | 0.11 | 0.05 | 0.01 | 0.08 | 0.06 | |
| 2007 | 1.43 | 1.31 | 0.32 | 0.09 | 0.1 | 0.02 | 0.07 | 0.01 | 0.1 | 0.05 |
| 2006 | 1.39 | 1.28 | 0.33 | 0.07 | 0.1 | 0.06 | 0.01 | 0.09 | 0.05 | |
| 2005 | 1.58 | 1.46 | 0.27 | 0.09 | 0.11 | 0.06 | 0.02 | 0.1 | 0.06 | |
| 2004 | 1.34 | 1.22 | 0.23 | 0.08 | 0.1 | 0.06 | 0.02 | 0.07 | 0.05 | |
| 2003 | 1.51 | 1.35 | 0.28 | 0.1 | 0.08 | 0.06 | 0.03 | 0.07 | 0.05 | |
| 2002 | 1.53 | 1.32 | 0.26 | 0.13 | 0.11 | 0.01 | 0.06 | 0.03 | 0.07 | 0.06 |
| 2001 | 2 | 1.8 | 0.27 | 0.16 | 0.14 | 0.07 | 0.05 | 0.11 | 0.08 | |
| 2000 | 2 | 1.65 | 0.22 | 0.13 | 0.11 | 0.06 | 0.06 | 0.09 | 0.07 | |
| 1999 | 1.36 | 1.09 | 0.21 | 0.04 | 0.06 | 0.03 | 0.07 | 0.04 | 0.04 | |
| 1998 | 1.56 | 1.15 | ||||||||
| 1997 | 0.67 | 0.43 | 0.11 | 0.03 | 0.02 | 0.02 | 0 | 0.03 | 0.01 | 0.03 |
| 1996 | 0.48 | 0.3 | ||||||||
| 1995 | 0.55 | 0.26 | ||||||||
| 1994 | 0.45 | 0.18 | ||||||||
| 1993 | 0.25 | 0.06 | ||||||||
| 1992 | 0.14 | 0.03 | ||||||||
| 1991 | 0.19 | 0.02 | ||||||||


Comments