
Abstract
Millet, a staple grain primarily used in food and fodder, has been cultivated for thousands of years, especially in Asia and Africa. In 2022, China led global production with 1.43 million tons, reflecting its long history of millet farming. Historically, millet was a key crop in regions with dry, less fertile soil due to its drought resistance. In recent decades, millet consumption has declined in many countries due to the rise of rice and wheat. However, there has been a resurgence in interest due to millet’s nutritional benefits, particularly its high fiber and antioxidant content, making it a key focus for sustainable agriculture.
Millet as food (worldwide)
Artificial millet, which refers to millet cultivated through enhanced agricultural techniques, has seen significant growth in China, which recorded the highest production of 1.46 million tons in 2021. This marks a peak, with 2022 production at 97.8% of that level. Historically, millet has been a vital crop in regions with arid climates due to its drought tolerance. Over time, global production fluctuated as other grains gained prominence. In recent years, however, artificial millet has gained attention for its nutritional benefits, sparking renewed interest in its cultivation as a sustainable, health-conscious alternative to traditional staples.
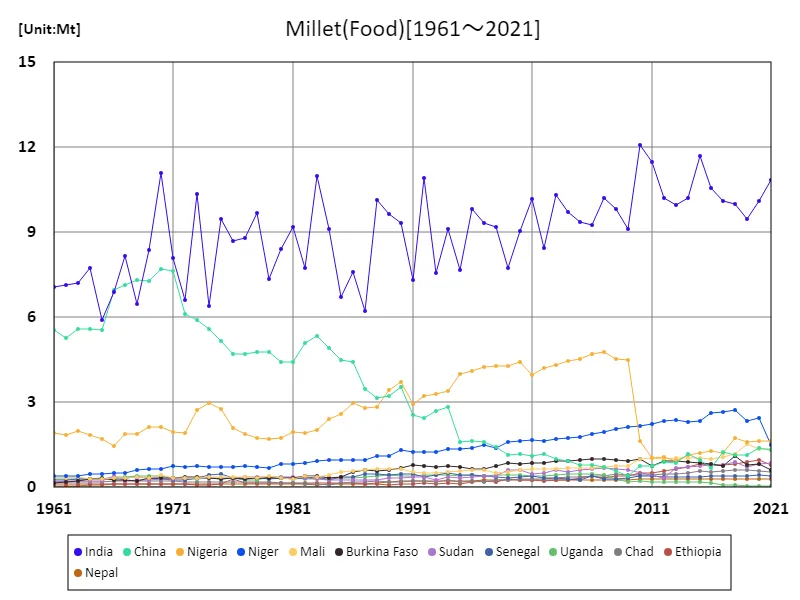
The maximum is 12.1Mt[2010] of India, and the current value is about 89.7%
Millet as food (latest year, countries around the world)
In global agriculture, millet plays a significant role, with China leading in production, recording 1.43 million tons in 2022. The global average production was 78.6 million tons, contributing to a total world production of 6.05 million tons. Historically, millet has been valued for its adaptability to drought-prone regions, making it a staple in parts of Asia and Africa. Over time, global millet production has fluctuated, with a decline in consumption in some areas due to the rise of other grains. However, millet is regaining attention as a nutritious and sustainable crop, contributing to its growing market presence in recent years.
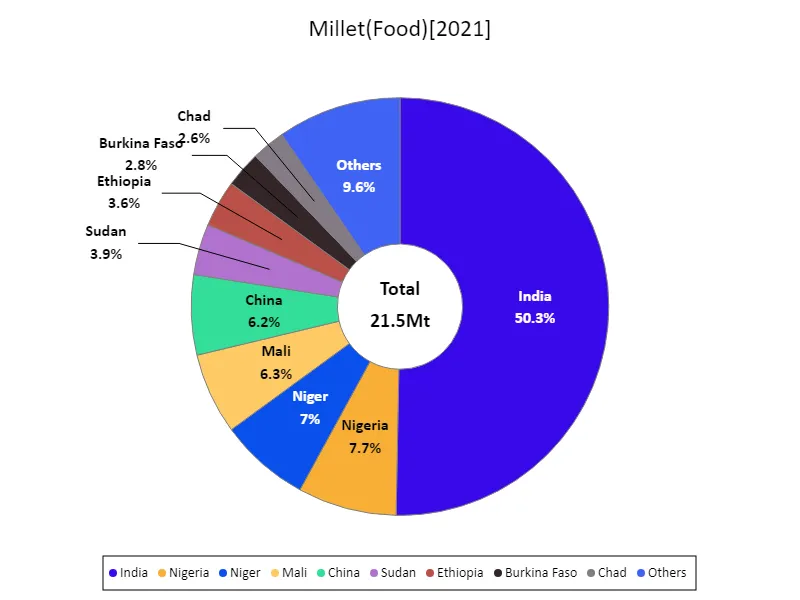
The maximum is 10.8Mt of India, the average is 250kt, and the total is 21.5Mt
Millet Food (Continent)
Artificial millet, developed through advanced agricultural practices, has seen notable trends in Asia, where production peaked at 4.72 million tons in 1961, marking its highest value to date. Millet’s resilience to drought and poor soil conditions has made it an essential crop in arid regions. Over time, its use declined as other grains became more dominant. However, in recent years, artificial millet has gained renewed interest due to its health benefits, including high fiber and nutritional content. This resurgence aligns with global shifts toward sustainable agriculture and nutrient-dense crops.
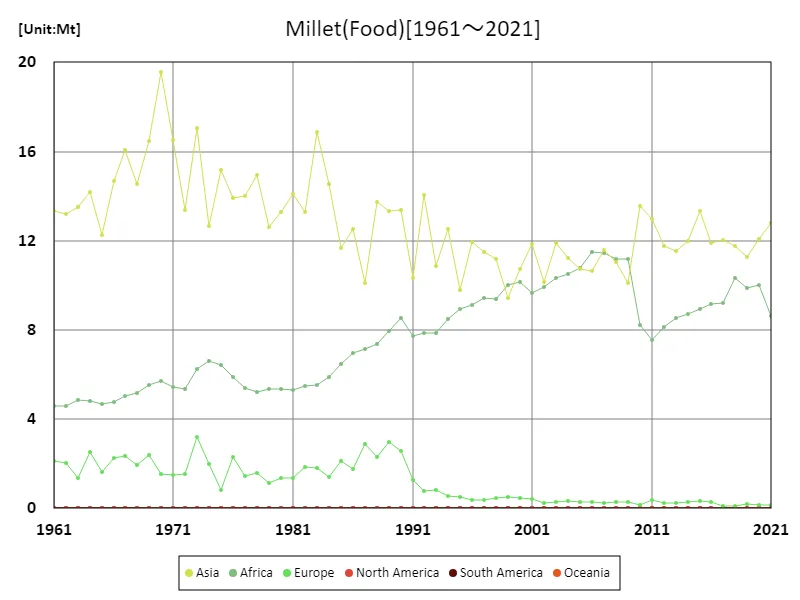
The maximum is 19.6Mt[1970] of Asia, and the current value is about 65.3%
Millet as food (latest year, continent)
In 2022, artificial millet saw significant production in Asia, with a peak of 4.72 million tons, reflecting its historical importance in the region. The average production across global markets was 1.47 million tons, contributing to a total of 7.37 million tons worldwide. Millet’s drought resistance and adaptability to poor soil have made it a vital crop in arid regions. While its global importance waned due to the rise of other grains, recent trends show a resurgence in demand, driven by growing interest in sustainable agriculture and millet’s nutritional benefits, making it a key focus for future agricultural development.
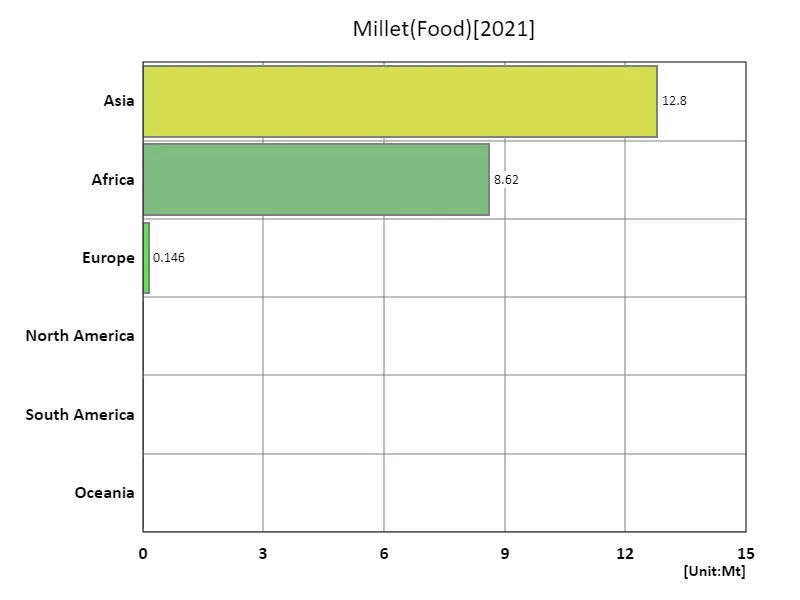
The maximum is 12.8Mt of Asia, the average is 7.18Mt, and the total is 21.5Mt
Main data
| Production(Millet, Food) [Mt] | ||||||||||
|---|---|---|---|---|---|---|---|---|---|---|
| World | Lower-middle-income countries | Asia | Southern Asia | India | Africa | Net Food Importing Developing Countries | Low Income Food Deficit Countries | Least Developed Countries | Low-income countries | |
| 2021 | 21.54 | 13.88 | 12.78 | 11.25 | 10.83 | 8.62 | 7.17 | 7.07 | 6.93 | 6.07 |
| 2020 | 22.25 | 13.2 | 12.1 | 10.52 | 10.09 | 9.99 | 8.56 | 8.43 | 8.29 | 7.39 |
| 2019 | 21.34 | 12.66 | 11.26 | 9.96 | 9.47 | 9.89 | 8.55 | 8.41 | 8.18 | 7.27 |
| 2018 | 22.2 | 13.18 | 11.78 | 10.47 | 10 | 10.33 | 8.88 | 8.69 | 8.56 | 7.68 |
| 2017 | 21.32 | 12.79 | 12.01 | 10.57 | 10.11 | 9.19 | 8.26 | 8.08 | 7.93 | 7.05 |
| 2016 | 21.33 | 13.27 | 11.88 | 11 | 10.55 | 9.16 | 8.17 | 8.02 | 7.91 | 7.04 |
| 2015 | 22.58 | 14.41 | 13.31 | 12.16 | 11.7 | 8.95 | 8.04 | 7.88 | 7.75 | 6.89 |
| 2014 | 20.97 | 12.81 | 12 | 10.64 | 10.2 | 8.7 | 7.86 | 7.73 | 7.58 | 6.72 |
| 2013 | 20.29 | 12.33 | 11.52 | 10.42 | 9.97 | 8.55 | 7.95 | 7.82 | 7.65 | 6.8 |
| 2012 | 20.15 | 12.66 | 11.76 | 10.66 | 10.2 | 8.14 | 7.41 | 7.29 | 7.1 | 6.32 |
| 2011 | 20.87 | 14.16 | 12.97 | 11.98 | 11.5 | 7.54 | 6.82 | 6.64 | 6.53 | 5.62 |
| 2010 | 21.91 | 15.24 | 13.55 | 12.55 | 12.08 | 8.23 | 6.9 | 6.74 | 6.62 | 5.72 |
| 2009 | 21.57 | 15.02 | 10.12 | 9.56 | 9.12 | 11.18 | 6.93 | 20.72 | 6.66 | 5.25 |
| 2008 | 22.49 | 15.64 | 11.05 | 10.25 | 9.82 | 11.17 | 6.95 | 21.44 | 6.7 | 5.34 |
| 2007 | 23.24 | 16.35 | 11.57 | 10.66 | 10.22 | 11.44 | 7 | 22.09 | 6.67 | 5.21 |
| 2006 | 22.38 | 15.39 | 10.63 | 9.64 | 9.24 | 11.49 | 7.06 | 21.03 | 6.81 | 5.22 |
| 2005 | 21.78 | 15.17 | 10.72 | 9.76 | 9.36 | 10.79 | 6.52 | 20.44 | 6.29 | 4.89 |
| 2004 | 22.02 | 15.48 | 11.21 | 10.1 | 9.71 | 10.5 | 6.32 | 20.49 | 6.1 | 4.72 |
| 2003 | 22.51 | 15.98 | 11.9 | 10.74 | 10.32 | 10.32 | 6.25 | 20.99 | 5.99 | 4.61 |
| 2002 | 20.3 | 13.99 | 10.17 | 8.83 | 8.45 | 9.91 | 5.93 | 18.65 | 5.7 | 4.36 |
| 2001 | 21.94 | 15.49 | 11.84 | 10.56 | 10.17 | 9.67 | 5.97 | 20.13 | 5.75 | 4.39 |
| 2000 | 21.33 | 14.8 | 10.72 | 9.41 | 9.04 | 10.16 | 5.97 | 19.47 | 5.76 | 4.29 |
| 1999 | 19.9 | 13.35 | 9.42 | 8.13 | 7.73 | 9.99 | 5.95 | 18.01 | 5.74 | 4.27 |
| 1998 | 21.03 | 14.87 | 11.18 | 9.63 | 9.2 | 9.37 | 5.34 | 18.91 | 5.13 | 3.84 |
| 1997 | 21.32 | 15.03 | 11.51 | 9.74 | 9.31 | 9.44 | 5.43 | 19.08 | 5.22 | 3.87 |
| 1996 | 21.46 | 15.32 | 11.95 | 10.19 | 9.83 | 9.13 | 5.17 | 19.24 | 5.01 | 3.74 |
| 1995 | 19.23 | 13.09 | 9.78 | 8.04 | 7.68 | 8.94 | 5.07 | 16.92 | 4.9 | 3.66 |
| 1994 | 21.62 | 14.1 | 12.54 | 9.54 | 9.12 | 8.5 | 5.28 | 17.99 | 5.06 | 3.7 |
| 1993 | 19.53 | 12.26 | 10.85 | 7.93 | 7.56 | 7.87 | 4.76 | 15.77 | 4.59 | 3.48 |
| 1992 | 22.71 | 15.47 | 14.05 | 11.32 | 10.92 | 7.88 | 4.88 | 19.16 | 4.7 | 3.39 |
| 1991 | 19.36 | 11.55 | 10.33 | 7.69 | 7.32 | 7.74 | 4.96 | 15.36 | 4.82 | 3.42 |
| 1990 | 24.47 | 14.36 | 13.37 | 9.72 | 9.33 | 8.55 | 5.07 | 18.23 | 4.87 | 3.51 |
| 1989 | 24.25 | 14.4 | 13.35 | 10 | 9.63 | 7.94 | 4.7 | 17.91 | 4.49 | 3.18 |
| 1988 | 23.4 | 14.28 | 13.74 | 10.46 | 10.14 | 7.35 | 4.63 | 17.76 | 4.42 | 3.19 |
| 1987 | 20.11 | 10.39 | 10.09 | 6.52 | 6.24 | 7.15 | 4.41 | 13.63 | 4.24 | 2.97 |
| 1986 | 21.23 | 11.79 | 12.51 | 7.94 | 7.59 | 6.98 | 4.22 | 14.9 | 4.02 | 2.82 |
| 1985 | 20.27 | 10.6 | 11.69 | 7.07 | 6.72 | 6.45 | 4.07 | 13.49 | 3.85 | 2.59 |
| 1984 | 21.83 | 12.66 | 14.55 | 9.47 | 9.11 | 5.89 | 3.7 | 15.38 | 3.5 | 2.39 |
| 1983 | 24.24 | 14.22 | 16.88 | 11.35 | 10.98 | 5.53 | 3.81 | 16.91 | 3.62 | 2.35 |
| 1982 | 20.64 | 10.78 | 13.29 | 8 | 7.73 | 5.49 | 3.69 | 13.53 | 3.52 | 2.36 |
| 1981 | 20.77 | 12.24 | 14.11 | 9.48 | 9.17 | 5.31 | 3.51 | 14.85 | 3.31 | 2.16 |
| 1980 | 19.98 | 11.42 | 13.28 | 8.7 | 8.42 | 5.34 | 3.67 | 14.04 | 3.44 | 2.17 |
| 1979 | 19.09 | 10.39 | 12.64 | 7.69 | 7.36 | 5.33 | 3.72 | 13.05 | 3.46 | 2.2 |
| 1978 | 21.75 | 12.75 | 14.95 | 10 | 9.67 | 5.19 | 3.56 | 15.19 | 3.27 | 2.02 |
| 1977 | 20.88 | 11.99 | 14.02 | 9.13 | 8.79 | 5.4 | 3.6 | 14.52 | 3.32 | 2.13 |
| 1976 | 22.13 | 12.18 | 13.92 | 9.02 | 8.69 | 5.9 | 3.86 | 14.87 | 3.57 | 2.17 |
| 1975 | 22.37 | 13.72 | 15.15 | 9.81 | 9.46 | 6.4 | 3.74 | 16.18 | 3.45 | 2.13 |
| 1974 | 21.27 | 10.92 | 12.65 | 6.84 | 6.4 | 6.61 | 3.82 | 13.41 | 3.44 | 2.2 |
| 1973 | 26.51 | 14.58 | 17.03 | 10.88 | 10.36 | 6.27 | 3.82 | 17.09 | 3.36 | 2.23 |
| 1972 | 20.3 | 9.88 | 13.39 | 7.08 | 6.6 | 5.36 | 3.7 | 12.4 | 3.3 | 2.21 |
| 1971 | 23.44 | 11.47 | 16.5 | 8.63 | 8.1 | 5.45 | 3.78 | 14.05 | 3.31 | 2.26 |
| 1970 | 26.79 | 14.74 | 19.56 | 11.61 | 11.1 | 5.71 | 3.78 | 17.29 | 3.32 | 2.26 |
| 1969 | 24.38 | 11.92 | 16.46 | 8.87 | 8.39 | 5.51 | 3.65 | 14.37 | 3.24 | 2.19 |
| 1968 | 21.66 | 9.76 | 14.55 | 6.97 | 6.47 | 5.16 | 3.57 | 12.1 | 3.13 | 2.09 |
| 1967 | 23.45 | 11.48 | 16.07 | 8.71 | 8.16 | 5.03 | 3.49 | 13.71 | 2.97 | 1.99 |
| 1966 | 21.67 | 9.81 | 14.66 | 7.42 | 6.9 | 4.75 | 3.54 | 12.16 | 3.07 | 1.94 |
| 1965 | 18.54 | 9.03 | 12.23 | 6.42 | 5.92 | 4.7 | 3.21 | 11.1 | 2.74 | 1.82 |
| 1964 | 21.52 | 11.04 | 14.17 | 8.29 | 7.75 | 4.82 | 3.24 | 13.11 | 2.72 | 1.83 |
| 1963 | 19.7 | 10.54 | 13.51 | 7.64 | 7.2 | 4.86 | 3.03 | 12.5 | 2.59 | 1.73 |
| 1962 | 19.82 | 10.39 | 13.19 | 7.65 | 7.15 | 4.6 | 2.96 | 12.24 | 2.47 | 1.64 |
| 1961 | 20.03 | 10.23 | 13.33 | 7.5 | 7.07 | 4.6 | 2.87 | 12.11 | 2.43 | 1.67 |


Comments