
Abstract
In recent years, income from cultivated vegetables in Japan has seen fluctuations, with 2022 marking a peak of 292 billion yen. Historically, vegetable farming has faced challenges such as aging farmers, labor shortages, and climate change. However, increased demand for domestic, high-quality vegetables and government support for sustainable farming practices have bolstered income. The trend towards diversification, with specialty and organic crops gaining popularity, has contributed to growth. Despite hurdles, vegetable farming remains a vital part of Japan’s agricultural economy.
Vegetable production income
Income from cultivated vegetables in Japan peaked at 524 billion yen in 1991, but by 2022, it had declined to 55.8% of that level, reaching 292 billion yen. This decline reflects several challenges, including the aging farmer population, labor shortages, and competition from imports. However, shifts in consumer preferences, with increased demand for locally grown and organic produce, have partially offset these trends. Government efforts to modernize farming practices and improve sustainability have helped stabilize the sector, though income levels have yet to return to peak levels.
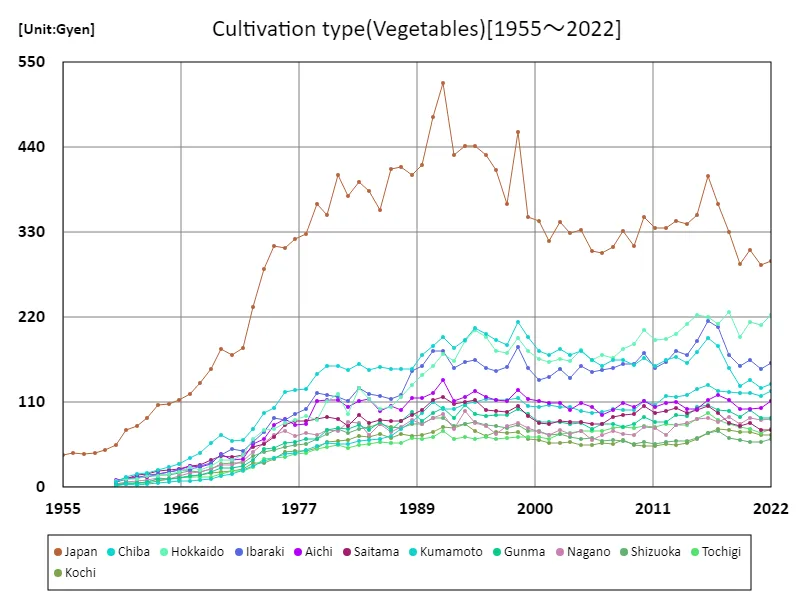
The maximum is 524Gyen[1991] of Japan, and the current value is about 55.8%
Vegetable production income (by prefecture)
Hokkaido’s income from cultivated vegetables reached a peak of 227 billion yen in 2018, and as of 2022, it stands at 98.1% of that level, reflecting strong consistency. The region’s agricultural success is attributed to its vast land, favorable climate, and advanced farming techniques. Hokkaido has specialized in crops like potatoes, carrots, and onions, with increased focus on high-quality, sustainable production to meet both domestic and export demand. Despite challenges like labor shortages and weather-related issues, the region has maintained a competitive edge, contributing significantly to Japan’s vegetable farming economy.
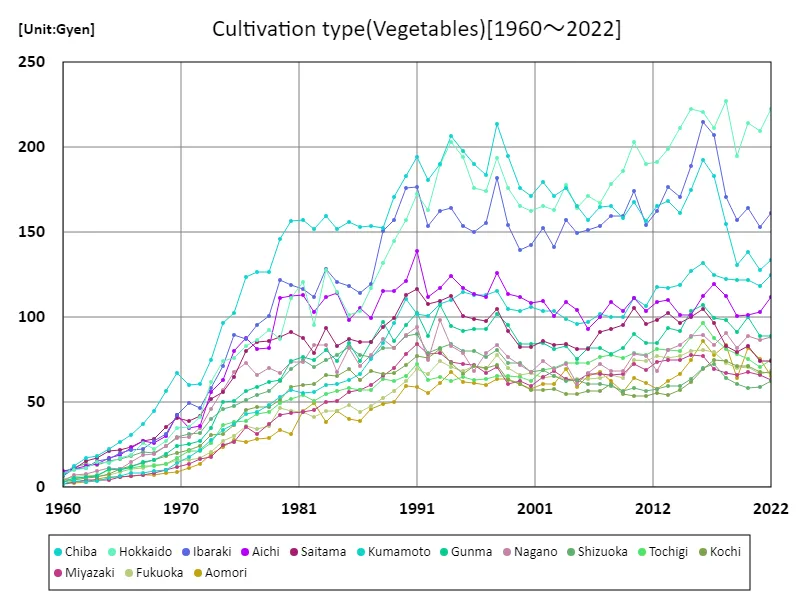
The maximum is 227Gyen[2018] of Hokkaido, and the current value is about 98.1%
Vegetable production income (latest year, prefecture)
In 2022, Hokkaido led Japan’s vegetable income with 223 billion yen, far surpassing the national average of 47.4 billion yen. Nationwide, the total income from cultivated vegetables reached 2.23 trillion yen. Hokkaido’s success is driven by its vast agricultural land and favorable climate, producing high-yield crops like potatoes and onions. While the total income has shown steady growth, challenges such as an aging farmer population and labor shortages remain. Efforts to modernize farming techniques and focus on high-quality, export-oriented produce have helped sustain Hokkaido’s dominance in vegetable farming.
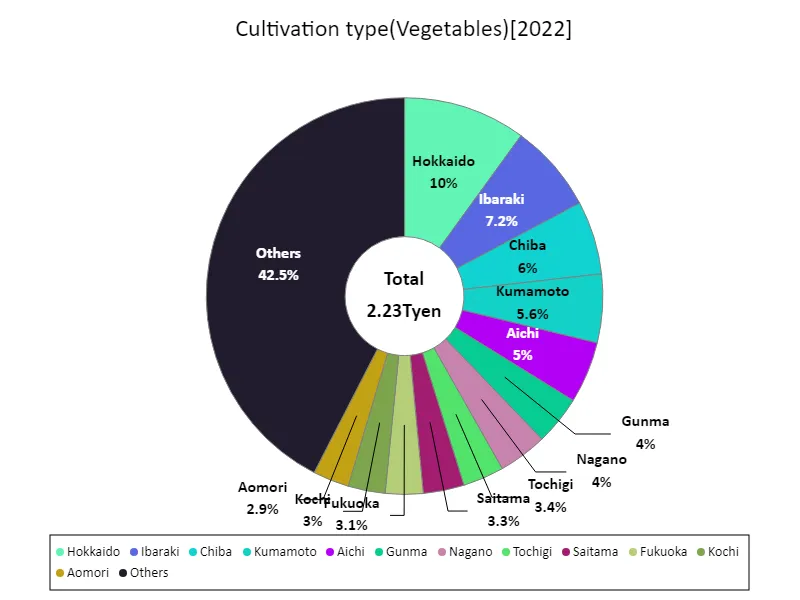
The maximum is 223Gyen of Hokkaido, the average is 47.4Gyen, and the total is 2.23Tyen
Main data
| Cultivation type(Vegetables) [Gyen] | ||||||||||
|---|---|---|---|---|---|---|---|---|---|---|
| Japan | Hokkaido | Ibaraki | Chiba | Kumamoto | Aichi | Gunma | Nagano | Tochigi | Saitama | |
| 2022 | 292.4 | 222.8 | 161.1 | 133.5 | 124.8 | 111.9 | 89.2 | 88.6 | 74.9 | 74.4 |
| 2021 | 287.6 | 209.4 | 153 | 128 | 118.6 | 103.1 | 89.1 | 86.6 | 70.7 | 74.3 |
| 2020 | 307.4 | 214.5 | 164.5 | 138.3 | 122.1 | 101.1 | 100.4 | 89.1 | 75.6 | 83.1 |
| 2019 | 288.5 | 195.1 | 157.5 | 130.5 | 122 | 101 | 91.2 | 81.8 | 78.4 | 79.6 |
| 2018 | 330.1 | 227.1 | 170.8 | 154.6 | 122.7 | 112.5 | 98.3 | 90.5 | 81.5 | 83.3 |
| 2017 | 366.2 | 211.4 | 207.1 | 182.9 | 124.7 | 119.3 | 99.7 | 84 | 87.6 | 96.8 |
| 2016 | 402.4 | 220.6 | 215 | 192.7 | 132.1 | 112.7 | 107 | 89.7 | 96.4 | 104.7 |
| 2015 | 352.2 | 222.4 | 189 | 174.9 | 127.3 | 101.2 | 103.5 | 88.9 | 88.3 | 100.3 |
| 2014 | 340.7 | 211.6 | 170.7 | 161.1 | 119.1 | 101.1 | 92 | 83.7 | 80.3 | 96.7 |
| 2013 | 345.1 | 199 | 176.7 | 168.7 | 117.2 | 110.2 | 93.6 | 80.6 | 81 | 102.5 |
| 2012 | 335.1 | 191.5 | 162.6 | 165.3 | 117.6 | 109 | 85 | 68.2 | 81.5 | 98.2 |
| 2011 | 335.5 | 190.3 | 154.2 | 156.8 | 106.5 | 103.5 | 84.8 | 77 | 77.6 | 95.9 |
| 2010 | 349.6 | 203.2 | 174.3 | 167.6 | 111.3 | 111.4 | 90.4 | 78.5 | 78.9 | 105.7 |
| 2009 | 312.9 | 185.8 | 159.5 | 158.6 | 100.3 | 103.9 | 82.1 | 68.2 | 76.3 | 95.2 |
| 2008 | 331.1 | 178.6 | 159.5 | 165.2 | 100.1 | 109.2 | 78.6 | 68.7 | 77.8 | 93.1 |
| 2007 | 310.8 | 167.2 | 153.8 | 164.7 | 101.7 | 100.4 | 81.9 | 72.6 | 76.5 | 91.3 |
| 2006 | 302.7 | 171.2 | 151.2 | 157 | 97.5 | 93.4 | 81.9 | 67.1 | 73 | 81.4 |
| 2005 | 305.3 | 164.5 | 149.4 | 165.3 | 96.1 | 104.4 | 75.4 | 60.9 | 73 | 81.3 |
| 2004 | 333.3 | 178 | 157.5 | 176 | 99.2 | 108.8 | 83.1 | 72.4 | 73.3 | 84.1 |
| 2003 | 329.6 | 163.4 | 141.4 | 171.1 | 103.9 | 100.5 | 81.6 | 69.6 | 70.3 | 84 |
| 2002 | 342.7 | 165.4 | 152.6 | 179.4 | 103.9 | 109.7 | 84.6 | 74.5 | 68.8 | 85.9 |
| 2001 | 319.1 | 162.8 | 142.5 | 171.6 | 106.3 | 108.5 | 84.5 | 68.1 | 62.3 | 82.4 |
| 2000 | 344.4 | 165.6 | 139.4 | 176.3 | 103.9 | 112 | 84.5 | 71.7 | 65 | 82.7 |
| 1999 | 350 | 176 | 154.4 | 194.9 | 104.7 | 114 | 95.4 | 76.9 | 65.5 | 92.1 |
| 1998 | 459.5 | 193.5 | 182 | 213.7 | 115.6 | 126.1 | 101.9 | 83.5 | 65.4 | 105.1 |
| 1997 | 366.8 | 174.2 | 155.3 | 184 | 113.2 | 112.1 | 93.4 | 78.8 | 63.7 | 97.9 |
| 1996 | 410 | 175.9 | 149.9 | 190.4 | 113.2 | 113.5 | 93 | 68.6 | 62.9 | 99.1 |
| 1995 | 430.3 | 194.3 | 153.9 | 197.8 | 114.6 | 117.2 | 92.2 | 78.9 | 64.9 | 100.5 |
| 1994 | 442.2 | 203.2 | 164.1 | 206.7 | 109.9 | 124.4 | 94.9 | 83.1 | 62.7 | 112.7 |
| 1993 | 441.4 | 189.6 | 162.5 | 190.3 | 107.8 | 117.2 | 107 | 98.2 | 64.9 | 109.8 |
| 1992 | 430 | 162.9 | 154 | 180.9 | 101 | 111.9 | 89.2 | 74.9 | 63.1 | 107.8 |
| 1991 | 523.7 | 172.7 | 176.4 | 194.3 | 101.7 | 138.9 | 102.7 | 94.3 | 72.5 | 116.9 |
| 1990 | 478.7 | 157.4 | 175.8 | 183 | 110.5 | 121.5 | 95.6 | 89.8 | 65.6 | 113.1 |
| 1989 | 417 | 144.7 | 157 | 170.7 | 96.4 | 115.3 | 86.1 | 82 | 62.6 | 99.6 |
| 1988 | 404.6 | 131.9 | 150.8 | 152.8 | 84.7 | 115.3 | 97.3 | 87.5 | 63.5 | 94.1 |
| 1987 | 414.8 | 117.1 | 119.3 | 153.6 | 75.5 | 99.6 | 85.6 | 77.7 | 57.5 | 85.4 |
| 1986 | 411.6 | 103.9 | 114.4 | 153 | 66.5 | 105.5 | 74.5 | 71.4 | 57.2 | 85.4 |
| 1985 | 359 | 101.4 | 118.5 | 156.1 | 63 | 98.4 | 84.9 | 82 | 58.5 | 87.2 |
| 1984 | 383.9 | 114.9 | 120.9 | 151.8 | 61 | 114.2 | 74.5 | 67.6 | 56.5 | 83.1 |
| 1983 | 395.6 | 127.9 | 128.3 | 159.8 | 60.4 | 112 | 80.8 | 83.5 | 55 | 93.5 |
| 1982 | 376.9 | 95.4 | 112.2 | 151.7 | 56 | 103.4 | 74.9 | 83.9 | 50.6 | 78.8 |
| 1981 | 404.4 | 120.9 | 116.5 | 157.1 | 55.4 | 113.3 | 76.9 | 73.5 | 54.4 | 87.9 |
| 1980 | 352 | 111.5 | 119.1 | 156.4 | 57.1 | 112.8 | 74.4 | 73.6 | 52 | 91.6 |
| 1979 | 366.6 | 87.2 | 121.9 | 146.1 | 52.9 | 111.3 | 63.1 | 67.1 | 49.5 | 88.5 |
| 1978 | 327.7 | 92.6 | 100.9 | 126.8 | 48.4 | 81.8 | 62 | 70.1 | 44.1 | 86.1 |
| 1977 | 321.1 | 86.9 | 95.3 | 126.5 | 44.1 | 81.2 | 58.8 | 65.9 | 42.9 | 85.6 |
| 1976 | 309.8 | 83.3 | 87.2 | 123.9 | 43 | 87.9 | 56.7 | 73 | 39.2 | 80.2 |
| 1975 | 311.7 | 76 | 89.8 | 102.5 | 37.3 | 80.3 | 50.7 | 67.7 | 38.3 | 64.6 |
| 1974 | 282 | 74.4 | 71.2 | 96.7 | 33.6 | 63 | 50.2 | 57.1 | 36.4 | 55.9 |
| 1973 | 233.3 | 62.2 | 58.4 | 74.8 | 28.1 | 56.2 | 34.9 | 46.2 | 26.1 | 52 |
| 1972 | 180.7 | 41.5 | 46.6 | 60.8 | 22.1 | 36.1 | 27.3 | 34.6 | 21.6 | 41.7 |
| 1971 | 170.8 | 35.2 | 49.3 | 60.4 | 17.7 | 34.7 | 25.2 | 29.4 | 21.2 | 39.1 |
| 1970 | 179.6 | 35.1 | 42.4 | 67.5 | 14.4 | 42.8 | 24.5 | 29 | 17.2 | 40.7 |
| 1969 | 153.6 | 27.2 | 31.5 | 56.9 | 10.2 | 30.3 | 19.4 | 24.3 | 13.5 | 35.4 |
| 1968 | 134.7 | 22.8 | 27.4 | 45 | 9.8 | 26.1 | 16.3 | 19.4 | 12.8 | 28.4 |
| 1967 | 120.3 | 26.2 | 22.8 | 37.5 | 8.6 | 27.3 | 15 | 18.9 | 12.7 | 27.1 |
| 1966 | 112.4 | 19.2 | 22.1 | 30.5 | 8.7 | 22.9 | 11.9 | 14.6 | 11.6 | 23.9 |
| 1965 | 107.3 | 17.5 | 20.3 | 26.8 | 6.9 | 19.2 | 10.4 | 10.7 | 10.8 | 21.8 |
| 1964 | 106.4 | 14.4 | 16.7 | 22.8 | 5.6 | 17.1 | 10.6 | 11.6 | 10.3 | 21.6 |
| 1963 | 90.2 | 15 | 15.3 | 18.2 | 3.9 | 13.8 | 6.8 | 9.7 | 7.2 | 17.2 |
| 1962 | 79.7 | 11.1 | 11.6 | 17.4 | 3.4 | 12.8 | 5.8 | 7.9 | 6.1 | 15.6 |
| 1961 | 74.6 | 10.4 | 11 | 12.7 | 3.7 | 10.8 | 5.3 | 7 | 4.8 | 11 |
| 1960 | 54.2 | 7.7 | 6.6 | 7.4 | 2 | 9.8 | 3.3 | 3.8 | 4.2 | 7.3 |
| 1959 | 48.6 | |||||||||
| 1958 | 44.5 | |||||||||
| 1957 | 42.5 | |||||||||
| 1956 | 44.9 | |||||||||
| 1955 | 41.9 | |||||||||

Comments