
Abstract
The Japanese dairy industry has seen significant changes over the past few decades, driven by shifts in domestic consumption patterns, production technologies, and international trade. The total annual statistics for milk and dairy product production reflect both the nation’s evolving consumption habits and the challenges faced by the livestock sector.In 2022, the nationwide total production of milk and dairy products reached an impressive 3.56 million kiloliters (gl), a figure that underscores the size of the industry, but also highlights some of the trends and challenges faced by Japan’s dairy sector. To understand this, it’s essential to consider historical production trends.Past TrendsMilk production in Japan has generally followed a trajectory of moderate growth, though it has faced some fluctuations due to external factors such as global market conditions, changes in domestic demand, and policy adjustments. Over the decades, Japan has been moving toward a more efficient and specialized dairy farming model, where technology and selective breeding have played significant roles in increasing milk yields.However, one of the most notable trends in the dairy industry has been a gradual decline in the number of dairy farms. This reduction is partly due to economic pressures, with smaller farms struggling to compete with larger, more industrialized operations. This decline is in line with broader agricultural trends in Japan, where farm consolidation has been a key feature of the past few decades. Despite fewer farms, the overall volume of milk production has remained relatively stable, with larger farms compensating for the loss of smaller ones.In the early 2000s, milk production in Japan showed some fluctuations, often linked to global supply and demand, particularly in the wake of the 2008 global financial crisis. During this period, the domestic market faced competition from imported milk products, which led to a decline in domestic consumption of some dairy products. However, the industry slowly recovered, aided by a resurgence in the popularity of dairy products like yogurt and cheese, alongside health-conscious trends that promoted the benefits of dairy in nutrition.Recent TrendsMore recently, Japan has faced challenges related to dairy consumption trends. In 2010, Japan’s milk consumption peaked, but it has been in decline since then, as a younger population becomes less engaged with dairy products. This decline in domestic consumption, coupled with a shift toward alternative beverages like plant-based milks, has prompted the dairy industry to explore new markets and innovate in product offerings.The production of milk and dairy products also saw some impact from Japan’s aging population. Older generations are more inclined to consume dairy, but younger consumers are less likely to include dairy in their daily diets. Additionally, Japan’s aging farm workforce has contributed to the overall decrease in the number of dairy farmers. These factors have led to increased focus on maximizing efficiency and adapting to changing consumer preferences.Despite these challenges, the total milk production in Japan has remained relatively stable, largely due to the continued expansion of large-scale dairy farms and advances in dairy farming technology. The 2022 figure of 3.56 million kiloliters indicates that the dairy industry has adjusted to these pressures, with a steady supply of dairy products despite declining per capita consumption.Characteristics of Japan’s Dairy IndustryOne key characteristic of Japan’s dairy industry is its high level of quality. Japan has stringent regulations on milk production, ensuring that milk is of a high standard, which makes it a competitive product in both domestic and international markets. The quality of Japanese milk has enabled the country to maintain a strong export market for premium dairy products, such as cheese, butter, and powdered milk.Additionally, Japan has seen the rise of dairy products that cater to health-conscious consumers, such as functional yogurts and probiotic-rich dairy products. These innovations are part of the dairy industry’s strategy to appeal to modern dietary preferences.ConclusionThe trends and characteristics of Japan’s dairy industry reflect a mix of adaptation to changing consumption patterns and external pressures. While production has remained stable, consumption habits have shifted, leading to a more concentrated industry dominated by fewer but larger farms. The 2022 figure of 3.56 million kiloliters highlights the resilience of the industry despite challenges. Moving forward, Japan’s dairy industry will likely continue to evolve, focusing on product innovation, efficiency, and meeting the needs of an aging population.
Production volume of milk and dairy products (total)
Japan’s milk and dairy production has seen notable changes from 1985 to 2022, with the peak of 5.14 million kiloliters (gl) recorded in 1994. Since then, production has declined to approximately 69.3% of this peak level. The decline is due to several factors, including a decrease in domestic consumption, especially among younger generations, and a reduction in the number of dairy farms. Despite fewer farms, technological advancements have helped maintain production efficiency. The industry now focuses on high-quality, health-oriented products to adapt to changing consumer preferences and an aging population.
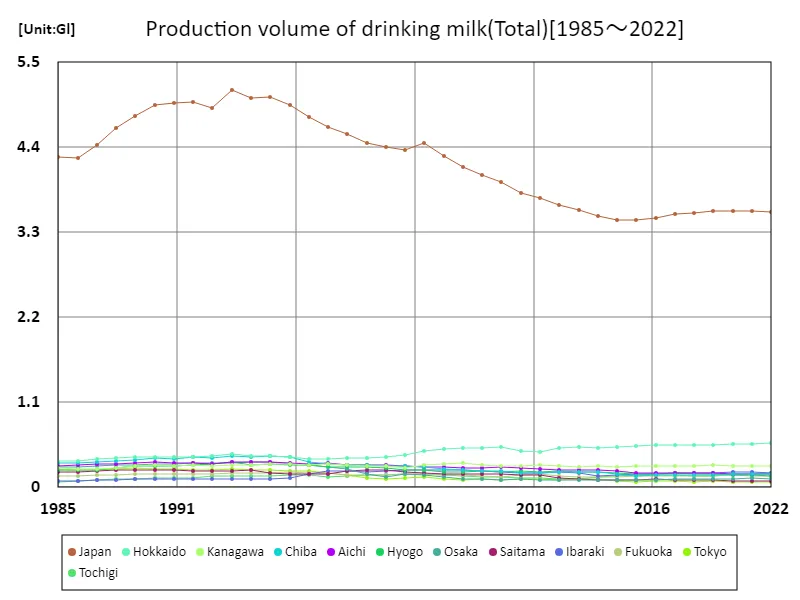
The maximum is 5.14Gl[1994] of Japan, and the current value is about 69.3%
Total milk and dairy product production volume (by prefecture)
Hokkaido, Japan’s leading milk and dairy production region, reached its highest output of 575 million liters in 2022, maintaining 100% of its peak level. This success highlights Hokkaido’s continued dominance in the dairy industry, driven by its vast pasturelands and efficient farming practices. Over the years, the region has adapted to challenges such as a shrinking workforce and changing consumption patterns. Despite a nationwide decline in milk production, Hokkaido’s sector remains resilient, with advancements in farming technology and a focus on high-quality dairy products helping it sustain its peak performance.
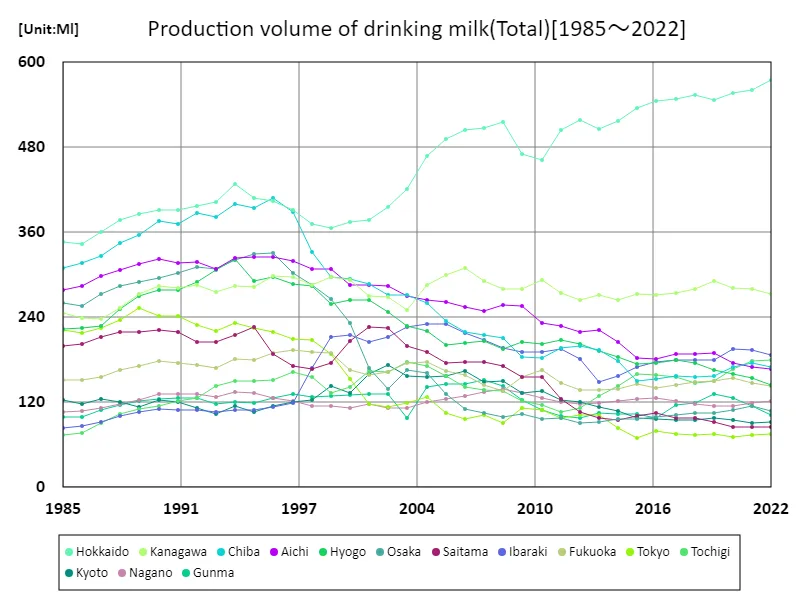
The maximum is the latest one, 575Ml of Hokkaido
Total milk and dairy product production volume (by prefecture, latest year)
In 2022, Hokkaido led Japan’s dairy production with 575 million liters, significantly higher than the national average of 102 million liters. The total nationwide production reached 3.37 million kiloliters. Hokkaido’s dominance is attributed to its expansive farmland, efficient dairy farming practices, and favorable climate. However, the broader trend shows a decline in overall production, reflecting reduced milk consumption and a shrinking dairy farm workforce across Japan. Despite these challenges, Hokkaido maintains its position through technological advancements and a focus on high-quality dairy products.
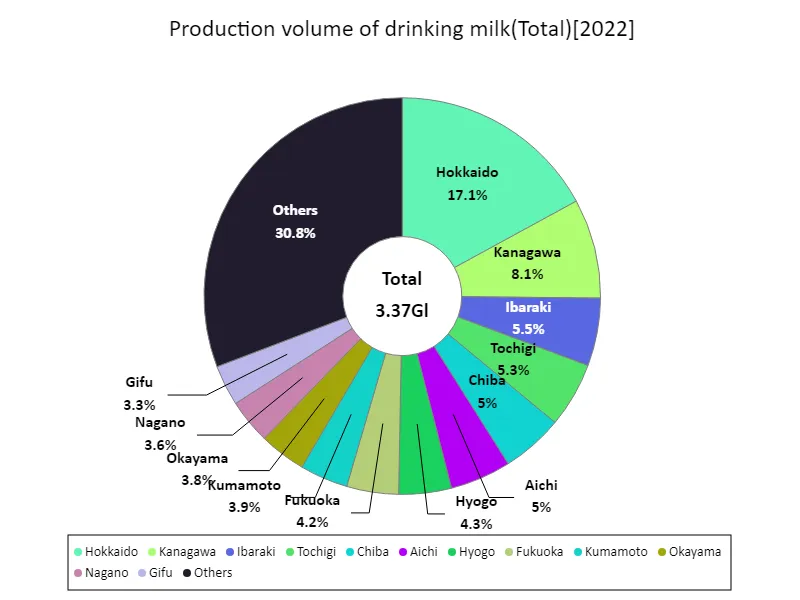
The maximum is 575Ml of Hokkaido, the average is 102Ml, and the total is 3.37Gl
Main data
| Milk dairy production(Production volume of drinking milk, Total) [Gl] | ||||||||||
|---|---|---|---|---|---|---|---|---|---|---|
| Japan | Hokkaido | Kanagawa | Ibaraki | Tochigi | Chiba | Aichi | Hyogo | Fukuoka | Kumamoto | |
| 2022 | 3.56 | 0.57 | 0.27 | 0.19 | 0.18 | 0.17 | 0.17 | 0.14 | 0.14 | 0.13 |
| 2021 | 3.58 | 0.56 | 0.28 | 0.19 | 0.18 | 0.18 | 0.17 | 0.15 | 0.15 | 0.13 |
| 2020 | 3.57 | 0.56 | 0.28 | 0.2 | 0.17 | 0.17 | 0.17 | 0.16 | 0.15 | 0.12 |
| 2019 | 3.57 | 0.55 | 0.29 | 0.18 | 0.15 | 0.16 | 0.19 | 0.17 | 0.15 | 0.12 |
| 2018 | 3.56 | 0.55 | 0.28 | 0.18 | 0.15 | 0.16 | 0.19 | 0.18 | 0.15 | 0.11 |
| 2017 | 3.54 | 0.55 | 0.27 | 0.18 | 0.16 | 0.16 | 0.19 | 0.18 | 0.14 | 0.11 |
| 2016 | 3.49 | 0.55 | 0.27 | 0.18 | 0.16 | 0.15 | 0.18 | 0.18 | 0.14 | 0.1 |
| 2015 | 3.46 | 0.53 | 0.27 | 0.17 | 0.16 | 0.15 | 0.18 | 0.17 | 0.15 | 0.11 |
| 2014 | 3.46 | 0.52 | 0.26 | 0.16 | 0.14 | 0.18 | 0.21 | 0.18 | 0.14 | 0.11 |
| 2013 | 3.51 | 0.51 | 0.27 | 0.15 | 0.13 | 0.19 | 0.22 | 0.19 | 0.14 | 0.1 |
| 2012 | 3.59 | 0.52 | 0.26 | 0.18 | 0.11 | 0.2 | 0.22 | 0.2 | 0.14 | 0.1 |
| 2011 | 3.65 | 0.5 | 0.27 | 0.19 | 0.11 | 0.2 | 0.23 | 0.21 | 0.15 | 0.1 |
| 2010 | 3.75 | 0.46 | 0.29 | 0.19 | 0.12 | 0.18 | 0.23 | 0.2 | 0.17 | 0.09 |
| 2009 | 3.8 | 0.47 | 0.28 | 0.19 | 0.12 | 0.18 | 0.26 | 0.21 | 0.16 | 0.08 |
| 2008 | 3.95 | 0.52 | 0.28 | 0.2 | 0.14 | 0.21 | 0.26 | 0.2 | 0.14 | 0.08 |
| 2007 | 4.04 | 0.51 | 0.29 | 0.21 | 0.14 | 0.22 | 0.25 | 0.21 | 0.14 | 0.08 |
| 2006 | 4.15 | 0.5 | 0.31 | 0.22 | 0.14 | 0.22 | 0.25 | 0.2 | 0.16 | 0.08 |
| 2005 | 4.29 | 0.49 | 0.3 | 0.23 | 0.16 | 0.23 | 0.26 | 0.2 | 0.16 | 0.08 |
| 2004 | 4.45 | 0.47 | 0.29 | 0.23 | 0.17 | 0.26 | 0.26 | 0.22 | 0.18 | 0.09 |
| 2003 | 4.36 | 0.42 | 0.25 | 0.23 | 0.18 | 0.27 | 0.27 | 0.23 | 0.17 | 0.1 |
| 2002 | 4.4 | 0.4 | 0.27 | 0.21 | 0.16 | 0.27 | 0.28 | 0.25 | 0.16 | 0.11 |
| 2001 | 4.45 | 0.38 | 0.27 | 0.2 | 0.16 | 0.29 | 0.29 | 0.26 | 0.16 | 0.12 |
| 2000 | 4.57 | 0.38 | 0.29 | 0.21 | 0.14 | 0.29 | 0.29 | 0.26 | 0.17 | 0.12 |
| 1999 | 4.67 | 0.37 | 0.3 | 0.21 | 0.13 | 0.3 | 0.31 | 0.26 | 0.19 | 0.1 |
| 1998 | 4.79 | 0.37 | 0.29 | 0.17 | 0.16 | 0.33 | 0.31 | 0.28 | 0.19 | 0.1 |
| 1997 | 4.94 | 0.39 | 0.3 | 0.12 | 0.16 | 0.39 | 0.32 | 0.29 | 0.19 | 0.1 |
| 1996 | 5.05 | 0.4 | 0.3 | 0.11 | 0.15 | 0.41 | 0.32 | 0.3 | 0.19 | 0.1 |
| 1995 | 5.04 | 0.41 | 0.28 | 0.11 | 0.15 | 0.39 | 0.32 | 0.29 | 0.18 | 0.11 |
| 1994 | 5.14 | 0.43 | 0.28 | 0.11 | 0.15 | 0.4 | 0.32 | 0.32 | 0.18 | 0.11 |
| 1993 | 4.91 | 0.4 | 0.28 | 0.11 | 0.14 | 0.38 | 0.31 | 0.31 | 0.17 | 0.11 |
| 1992 | 4.98 | 0.4 | 0.29 | 0.11 | 0.13 | 0.39 | 0.32 | 0.29 | 0.17 | 0.1 |
| 1991 | 4.97 | 0.39 | 0.28 | 0.11 | 0.12 | 0.37 | 0.32 | 0.28 | 0.18 | 0.1 |
| 1990 | 4.95 | 0.39 | 0.28 | 0.11 | 0.11 | 0.38 | 0.32 | 0.28 | 0.18 | 0.11 |
| 1989 | 4.81 | 0.39 | 0.27 | 0.11 | 0.11 | 0.36 | 0.32 | 0.27 | 0.17 | 0.1 |
| 1988 | 4.66 | 0.38 | 0.25 | 0.1 | 0.1 | 0.34 | 0.31 | 0.25 | 0.17 | 0.11 |
| 1987 | 4.44 | 0.36 | 0.24 | 0.09 | 0.09 | 0.33 | 0.3 | 0.23 | 0.16 | 0.1 |
| 1986 | 4.26 | 0.34 | 0.24 | 0.09 | 0.08 | 0.32 | 0.28 | 0.22 | 0.15 | 0.1 |
| 1985 | 4.28 | 0.35 | 0.25 | 0.08 | 0.07 | 0.31 | 0.28 | 0.22 | 0.15 | 0.09 |


Comments