Abstract
In recent years, the United States has seen steady growth in olive production, with 2022 marking a notable peak of 85.5 kilotonnes (kt). This increase is driven by the expansion of olive farming, especially in California, which accounts for over 90% of the country’s output. The U.S. has emerged as a significant player in the global olive industry, though its production remains far smaller compared to leading producers like Spain and Italy. Over the past decade, the industry has seen increased focus on quality and sustainability, with olive oil production also growing as a major export.
Olive production
The United States’ olive production reached its peak of 206 kt in 2010, but has since seen a decline, with 2022’s total at 85.5 kt, just 41.5% of that peak. This drop reflects challenges like drought, pests, and fluctuations in market demand. Despite this, U.S. olive production remains concentrated in California, which produces the majority of the nation’s olives. Over the years, the focus has shifted to improving sustainability and quality, particularly in olive oil production, which continues to grow in importance as a major export product.
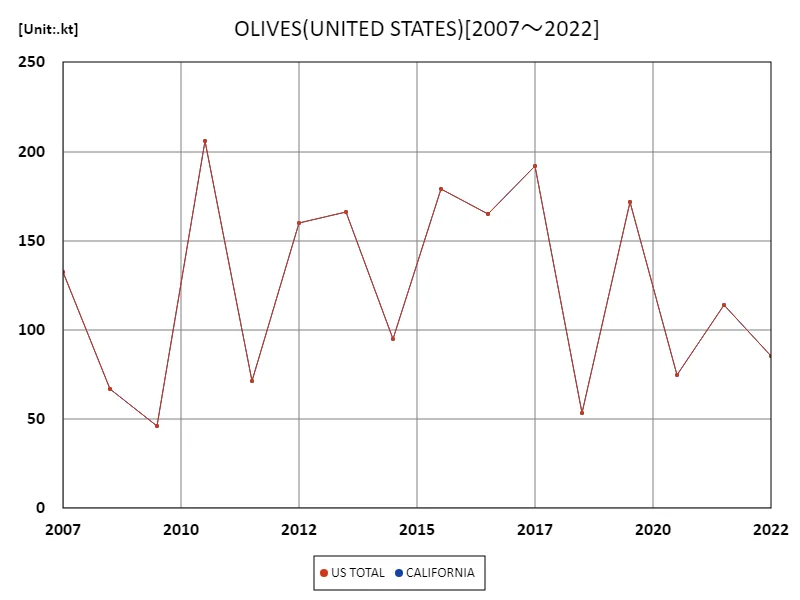
The maximum is 206kt[2010] of US TOTAL, and the current value is about 41.5%
Olive production (50 US states)
California’s olive production reached a peak of 206 kt in 2010, but by 2022, it had dropped to 41.5% of that figure, reflecting challenges such as drought, pest issues, and market dynamics. Despite fluctuations, California remains the dominant U.S. producer, with olives primarily cultivated for oil production. Over time, there has been a growing focus on quality and sustainability. While total production has decreased, the U.S. olive industry continues to focus on innovation, with efforts to improve yield resilience and maintain export growth, particularly in olive oil.
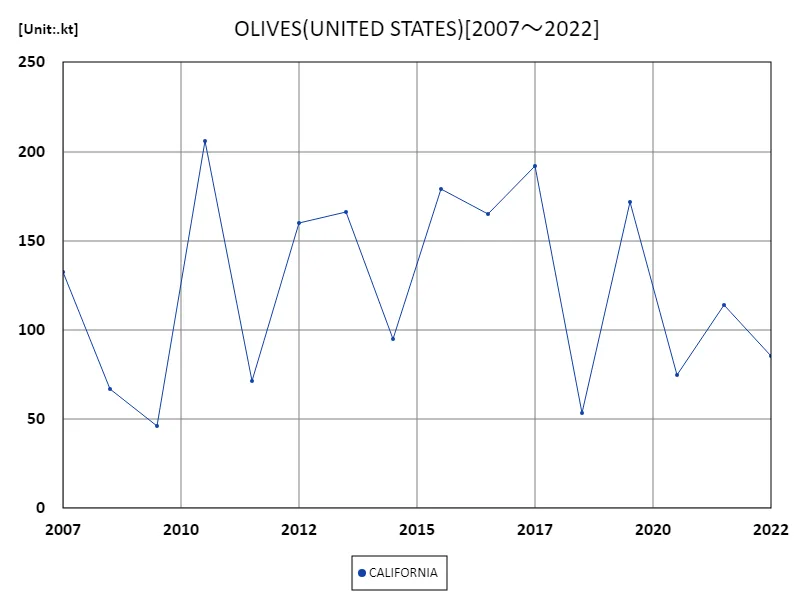
The maximum is 206kt[2010] of CALIFORNIA, and the current value is about 41.5%
Olive production (latest year, 50 US states)
In 2022, California’s olive production reached a steady 85.5 kt, matching both the overall and average output for the year. This consistency follows a period of fluctuating production, with past years showing more significant peaks and dips. While California remains the primary U.S. producer, the industry has faced challenges like drought and market pressures. However, the focus on sustainable farming practices and high-quality olive oil production has remained strong. These efforts aim to stabilize production and ensure long-term growth despite environmental and economic factors.
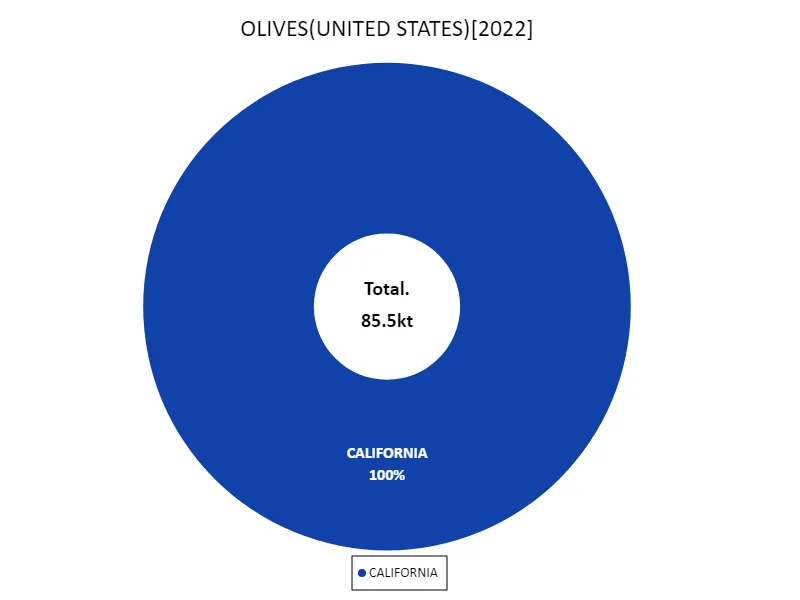
The maximum is 85.5kt of CALIFORNIA, the average is 85.5kt, and the total is 85.5kt
Main data
| OLIVES(ALL CLASSES, ALL PRODUCTION PRACTICES, UTILIZED, PRODUCTION, UNITED STATES) [kt] | ||
|---|---|---|
| CALIFORNIA | US TOTAL | |
| 2022 | 85.5 | 85.5 |
| 2021 | 113.95 | 113.95 |
| 2020 | 74.6 | 74.6 |
| 2019 | 171.7 | 171.7 |
| 2018 | 53.3 | 53.3 |
| 2017 | 191.7 | 191.7 |
| 2016 | 164.8 | 164.8 |
| 2015 | 179 | 179 |
| 2014 | 95 | 95 |
| 2013 | 166 | 166 |
| 2012 | 160 | 160 |
| 2011 | 71.2 | 71.2 |
| 2010 | 206 | 206 |
| 2009 | 46.3 | 46.3 |
| 2008 | 66.8 | 66.8 |
| 2007 | 132.5 | 132.5 |


Comments