Abstract
There are several factors behind the United States importing 220kt of honey in 2021, making it the world’s largest importer. First, there is a very high demand for honey in the United States. In addition, the United States has difficulty meeting demand through domestic production alone and is therefore dependent on imports from overseas. Major exporting countries include China, Argentina, and Mexico, with large import volumes from these countries. China in particular is the world’s largest honey producer, and its mass production and low prices are impacting the American market. Over the past few years, U.S. honey imports have remained steadily high, marked by increasing honey consumption and diversification of imports. This has resulted in a wider variety of honey available on the American market, providing consumers with more choice.
Honey imports (worldwide)
Looking back at data from 1961 to 2021, U.S. honey imports show a notable increase. Notably, 2021 saw the record high of 220kt, a historic peak for the US, reaching 100% of the total. Imports were relatively small in the 1960s, but gradually increased from the 1970s to the 1980s, and have grown rapidly since the 1990s. This increase is due to rising demand in the United States and a lack of domestic production, which has led to increased imports to meet consumer health concerns and diverse uses. Major exporting countries include China, Argentina, and Mexico, with China in particular importing a large amount. Overall, U.S. honey imports have remained stable and high, providing a wide variety of varieties and low prices to the market. This trend is likely to continue in the future, and demand is expected to increase further.
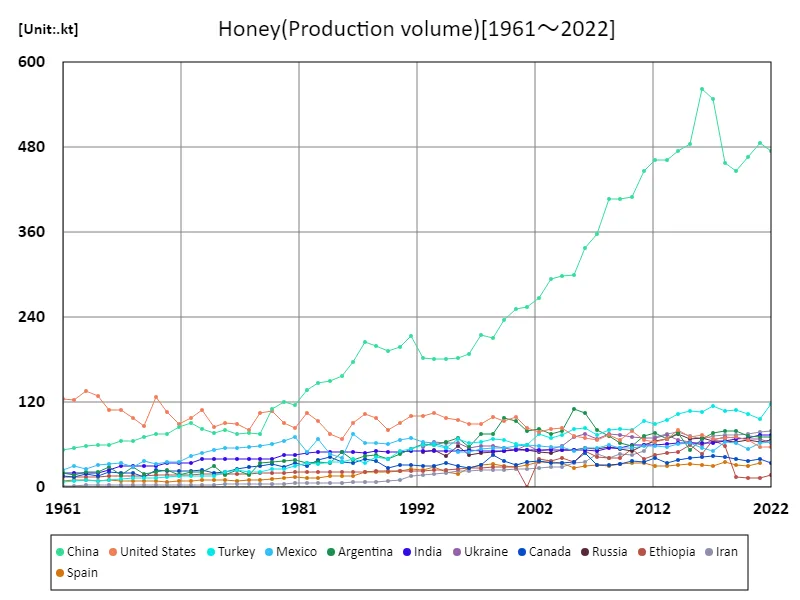
The maximum is 563kt[2016] of China, and the current value is about 84.2%
Honey imports by country (latest year)
Based on 2021 data, global honey imports reached a total of 754kt. Of this, the United States imported 220kt, making it the world’s largest importer. US imports account for about 29% of the total, down from 100% of the peak. In comparison, the global average import volume is a huge 4.21kt. The high import levels in the United States are due to very high domestic demand and the inability of domestic production to meet that demand. Major exporting countries include China, Argentina, and Mexico, with imports from China in particular accounting for a large proportion. Other countries import relatively small amounts, with the overall balance being heavily influenced by the United States. Historical trends show that U.S. imports have continued to increase, and as demand continues to grow, imports are expected to remain high. Globally, imports are unevenly distributed across regions, with major consuming countries leading the market.
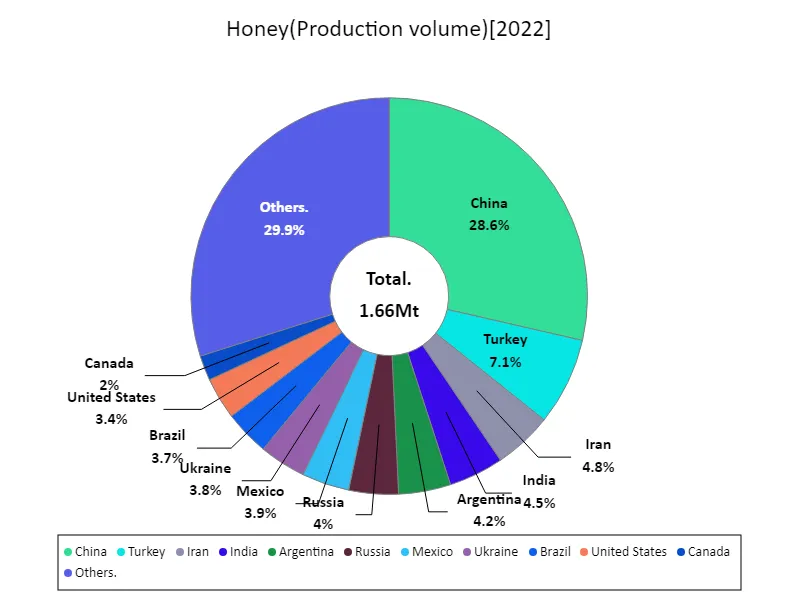
The maximum is 474kt of China, the average is 13.6kt, and the total is 1.66Mt
Honey imports (continent)
According to 2021 data, the largest volume of global honey imports was from Europe at 385kt, reaching an all-time peak. Honey imports across Europe are driven by growing health consciousness among consumers and increased demand for a variety of uses. Germany, France and the UK are particularly large importers, as these countries import a lot of honey in search of high-quality honey. Historically, Europe has consistently been a major importer of honey and demand has remained steadily high. In particular, local production is insufficient to meet demand, so the country relies on imports from overseas. The increase in European imports reflects increasing consumer quality preferences, the development of new markets and the expansion of international trade, and this trend is expected to continue. This brings a wide variety of honey to the European market, offering consumers a wider range of choice.
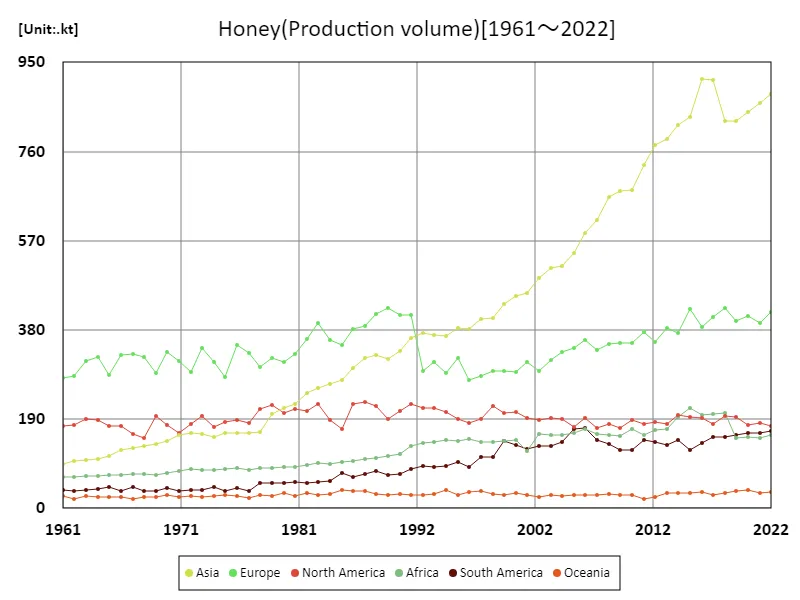
The maximum is 913kt[2016] of Asia, and the current value is about 96.6%
Honey imports (latest year, continental)
According to 2021 data, global honey imports reached a total of 759kt, of which Europe accounted for 380kt, making it the largest importing region. Europe’s honey imports account for around 50% of total imports, remaining at a high level close to previous peak levels. In Europe, import volumes continue to increase due to consumers becoming more health conscious and increasing demand for high-quality honey. The average import volume was 127kt, with Europe well above the overall average. This is because Europe is a major importer and gets its honey from a variety of sources. In particular, in Europe, imports play an important role as domestic production cannot fully meet demand. Major exporters include China, Argentina and Mexico, which supply large quantities to the European market. Overall, the European market is showing stable and high demand, with import volumes expected to remain stable or even increase in the future.
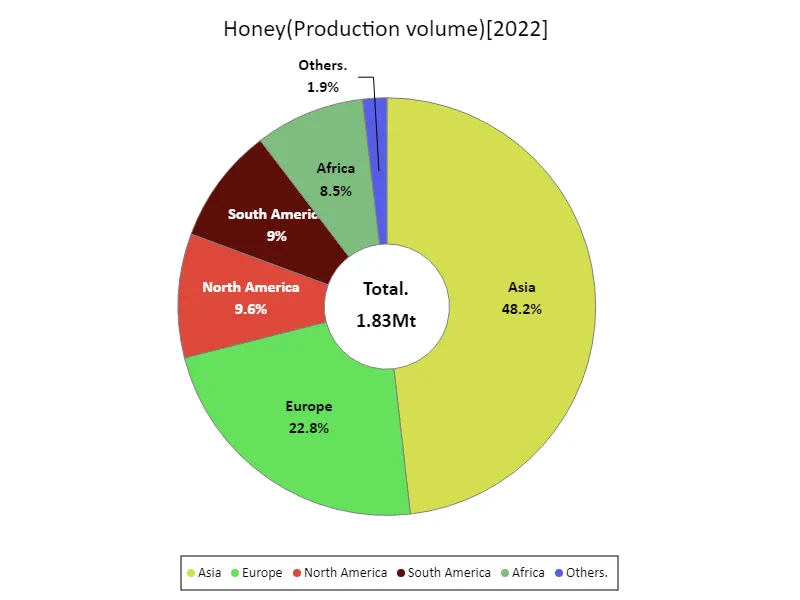
The maximum is 882kt of Asia, the average is 305kt, and the total is 1.83Mt
Main data
| Production(Honey, Production volume) [Mt] | ||||||||||
|---|---|---|---|---|---|---|---|---|---|---|
| World | Upper-middle-income countries | Asia | Eastern Asia | China | Europe | Lower-middle-income countries | Americas | High-income countries | European Union | |
| 2022 | 1.83 | 0.94 | 0.88 | 0.51 | 0.47 | 0.42 | 0.38 | 0.34 | 0.29 | 0.24 |
| 2021 | 1.79 | 0.91 | 0.86 | 0.52 | 0.49 | 0.4 | 0.38 | 0.34 | 0.35 | 0.23 |
| 2020 | 1.78 | 0.89 | 0.84 | 0.5 | 0.47 | 0.41 | 0.38 | 0.34 | 0.4 | 0.24 |
| 2019 | 1.76 | 0.9 | 0.83 | 0.48 | 0.45 | 0.4 | 0.37 | 0.35 | 0.42 | 0.23 |
| 2018 | 1.84 | 0.9 | 0.82 | 0.49 | 0.46 | 0.43 | 0.38 | 0.35 | 0.43 | 0.25 |
| 2017 | 1.88 | 0.97 | 0.91 | 0.58 | 0.55 | 0.41 | 0.36 | 0.33 | 0.45 | 0.24 |
| 2016 | 1.86 | 0.98 | 0.91 | 0.6 | 0.56 | 0.39 | 0.35 | 0.33 | 0.44 | 0.22 |
| 2015 | 1.82 | 0.89 | 0.83 | 0.52 | 0.48 | 0.42 | 0.36 | 0.32 | 0.47 | 0.25 |
| 2014 | 1.76 | 0.89 | 0.82 | 0.5 | 0.47 | 0.37 | 0.36 | 0.35 | 0.42 | 0.2 |
| 2013 | 1.69 | 0.85 | 0.79 | 0.49 | 0.46 | 0.38 | 0.34 | 0.31 | 0.41 | 0.21 |
| 2012 | 1.64 | 0.84 | 0.77 | 0.49 | 0.46 | 0.36 | 0.33 | 0.32 | 0.39 | 0.19 |
| 2011 | 1.61 | 0.83 | 0.73 | 0.47 | 0.45 | 0.38 | 0.3 | 0.33 | 0.41 | 0.21 |
| 2010 | 1.54 | 0.76 | 0.68 | 0.43 | 0.41 | 0.35 | 0.29 | 0.31 | 0.4 | 0.2 |
| 2009 | 1.51 | 0.76 | 0.68 | 0.44 | 0.41 | 0.35 | 0.29 | 0.29 | 0.38 | 0.19 |
| 2008 | 1.52 | 0.77 | 0.66 | 0.44 | 0.41 | 0.35 | 0.29 | 0.32 | 0.39 | 0.19 |
| 2007 | 1.45 | 0.71 | 0.61 | 0.39 | 0.36 | 0.34 | 0.29 | 0.32 | 0.38 | 0.19 |
| 2006 | 1.51 | 0.73 | 0.59 | 0.36 | 0.34 | 0.36 | 0.29 | 0.36 | 0.41 | 0.2 |
| 2005 | 1.42 | 0.68 | 0.54 | 0.33 | 0.3 | 0.34 | 0.29 | 0.34 | 0.38 | 0.19 |
| 2004 | 1.36 | 0.64 | 0.52 | 0.32 | 0.3 | 0.33 | 0.26 | 0.33 | 0.4 | 0.2 |
| 2003 | 1.34 | 0.62 | 0.51 | 0.32 | 0.29 | 0.31 | 0.26 | 0.33 | 0.39 | 0.19 |
| 2002 | 1.29 | 0.6 | 0.49 | 0.29 | 0.27 | 0.29 | 0.25 | 0.32 | 0.37 | 0.17 |
| 2001 | 1.24 | 0.58 | 0.46 | 0.28 | 0.25 | 0.31 | 0.26 | 0.32 | 0.38 | 0.18 |
| 2000 | 1.26 | 0.58 | 0.45 | 0.27 | 0.25 | 0.29 | 0.24 | 0.34 | 0.38 | 0.17 |
| 1999 | 1.24 | 0.57 | 0.43 | 0.25 | 0.24 | 0.29 | 0.24 | 0.35 | 0.37 | 0.17 |
| 1998 | 1.19 | 0.52 | 0.4 | 0.22 | 0.21 | 0.29 | 0.24 | 0.33 | 0.37 | 0.16 |
| 1997 | 1.16 | 0.52 | 0.4 | 0.23 | 0.22 | 0.28 | 0.24 | 0.3 | 0.34 | 0.16 |
| 1996 | 1.11 | 0.47 | 0.38 | 0.2 | 0.19 | 0.27 | 0.24 | 0.27 | 0.33 | 0.15 |
| 1995 | 1.16 | 0.5 | 0.38 | 0.2 | 0.18 | 0.32 | 0.24 | 0.29 | 0.36 | 0.18 |
| 1994 | 1.13 | 0.47 | 0.37 | 0.19 | 0.18 | 0.29 | 0.25 | 0.3 | 0.36 | 0.16 |
| 1993 | 1.15 | 0.48 | 0.37 | 0.19 | 0.18 | 0.31 | 0.24 | 0.3 | 0.37 | 0.18 |
| 1992 | 1.14 | 0.5 | 0.37 | 0.2 | 0.18 | 0.29 | 0.23 | 0.3 | 0.34 | 0.16 |
| 1991 | 1.24 | 0.69 | 0.36 | 0.23 | 0.21 | 0.41 | 0.15 | 0.31 | 0.34 | 0.15 |
| 1990 | 1.18 | 0.66 | 0.34 | 0.21 | 0.2 | 0.41 | 0.14 | 0.28 | 0.33 | 0.15 |
| 1989 | 1.15 | 0.63 | 0.32 | 0.21 | 0.19 | 0.43 | 0.14 | 0.26 | 0.34 | 0.17 |
| 1988 | 1.18 | 0.66 | 0.33 | 0.21 | 0.2 | 0.41 | 0.13 | 0.3 | 0.34 | 0.15 |
| 1987 | 1.15 | 0.63 | 0.32 | 0.22 | 0.21 | 0.39 | 0.13 | 0.3 | 0.35 | 0.15 |
| 1986 | 1.11 | 0.61 | 0.3 | 0.19 | 0.18 | 0.38 | 0.13 | 0.29 | 0.34 | 0.15 |
| 1985 | 1 | 0.55 | 0.27 | 0.17 | 0.16 | 0.35 | 0.12 | 0.25 | 0.29 | 0.13 |
| 1984 | 0.99 | 0.52 | 0.26 | 0.16 | 0.15 | 0.36 | 0.12 | 0.25 | 0.31 | 0.14 |
| 1983 | 1.05 | 0.56 | 0.26 | 0.16 | 0.15 | 0.39 | 0.12 | 0.28 | 0.34 | 0.16 |
| 1982 | 0.99 | 0.5 | 0.25 | 0.15 | 0.14 | 0.36 | 0.11 | 0.26 | 0.34 | 0.15 |
| 1981 | 0.93 | 0.49 | 0.22 | 0.13 | 0.12 | 0.33 | 0.11 | 0.27 | 0.29 | 0.12 |
| 1980 | 0.9 | 0.48 | 0.21 | 0.13 | 0.12 | 0.31 | 0.11 | 0.26 | 0.28 | 0.11 |
| 1979 | 0.91 | 0.47 | 0.2 | 0.12 | 0.11 | 0.32 | 0.1 | 0.27 | 0.3 | 0.12 |
| 1978 | 0.84 | 0.42 | 0.16 | 0.09 | 0.08 | 0.3 | 0.1 | 0.27 | 0.29 | 0.11 |
| 1977 | 0.81 | 0.43 | 0.16 | 0.09 | 0.08 | 0.33 | 0.09 | 0.22 | 0.25 | 0.1 |
| 1976 | 0.85 | 0.42 | 0.16 | 0.08 | 0.08 | 0.35 | 0.09 | 0.23 | 0.3 | 0.13 |
| 1975 | 0.77 | 0.39 | 0.16 | 0.09 | 0.08 | 0.28 | 0.09 | 0.22 | 0.25 | 0.09 |
| 1974 | 0.79 | 0.41 | 0.15 | 0.08 | 0.08 | 0.31 | 0.09 | 0.22 | 0.25 | 0.09 |
| 1973 | 0.84 | 0.43 | 0.16 | 0.09 | 0.08 | 0.34 | 0.09 | 0.23 | 0.28 | 0.1 |
| 1972 | 0.78 | 0.39 | 0.16 | 0.1 | 0.09 | 0.29 | 0.09 | 0.22 | 0.25 | 0.09 |
| 1971 | 0.77 | 0.39 | 0.16 | 0.09 | 0.09 | 0.31 | 0.08 | 0.2 | 0.26 | 0.1 |
| 1970 | 0.8 | 0.4 | 0.14 | 0.08 | 0.08 | 0.33 | 0.08 | 0.22 | 0.28 | 0.1 |
| 1969 | 0.75 | 0.36 | 0.14 | 0.08 | 0.08 | 0.29 | 0.07 | 0.23 | 0.28 | 0.09 |
| 1968 | 0.74 | 0.38 | 0.13 | 0.08 | 0.07 | 0.32 | 0.07 | 0.19 | 0.24 | 0.1 |
| 1967 | 0.75 | 0.38 | 0.13 | 0.07 | 0.07 | 0.33 | 0.08 | 0.2 | 0.26 | 0.1 |
| 1966 | 0.76 | 0.39 | 0.13 | 0.07 | 0.07 | 0.33 | 0.08 | 0.21 | 0.26 | 0.09 |
| 1965 | 0.71 | 0.36 | 0.11 | 0.07 | 0.06 | 0.28 | 0.07 | 0.22 | 0.25 | 0.08 |
| 1964 | 0.75 | 0.37 | 0.11 | 0.07 | 0.06 | 0.32 | 0.06 | 0.23 | 0.28 | 0.09 |
| 1963 | 0.74 | 0.37 | 0.1 | 0.07 | 0.06 | 0.31 | 0.06 | 0.23 | 0.28 | 0.08 |
| 1962 | 0.68 | 0.34 | 0.1 | 0.07 | 0.06 | 0.28 | 0.06 | 0.21 | 0.24 | 0.07 |
| 1961 | 0.68 | 0.34 | 0.09 | 0.06 | 0.05 | 0.28 | 0.06 | 0.21 | 0.24 | 0.06 |

Comments