Abstract
In terms of global honey exports, China exported 148 kilotons (kt) in 2021, making it the largest exporter. This high export volume is supported by China’s large-scale production capacity and low-cost supply ability. China’s honey is mainly exported to Asia, Europe and North America, and its quality and price competitiveness have established its market advantage. Meanwhile, other major exporting countries include Argentina, Ukraine, and Mexico, each of which leverages its own regional characteristics to enter the market. Argentina in particular has a strong influence on the European market, and Ukraine has also increased its export volume in recent years. Overall, the honey export market is expanding as demand increases in each country, and in particular, demand for organic and high-quality honey tends to increase as people become more health-conscious. Exporting countries are also seeking sustainable production and export strategies while addressing market quality regulations and trade barriers.
Honey exports (worldwide)
Data on honey export volumes from 1961 to 2021 highlights China’s importance in the global market. In particular, China’s exports peaked in 2015, reaching 151 kilotonnes (kt). China has long been the world’s largest honey exporter and has maintained that position in recent years, but exports in 2021 were 148kt, just 98% of the peak. This decline could be due to increased domestic demand, rising production costs or environmental factors. After China, the next most important exporting countries are Argentina and Ukraine. These countries are also increasing their market share, increasing competition. Argentina produces a large amount of honey, which it exports mainly to the European market. Ukraine is also supplying the market at low prices thanks to its mass production. Overall, honey export volumes have remained stable, although there have been fluctuations in the shares and production volumes of major exporting countries. Policy changes in producing countries, climate change, and international trade terms continue to influence export trends. These factors are likely to continue to drive changes in the market in the future.
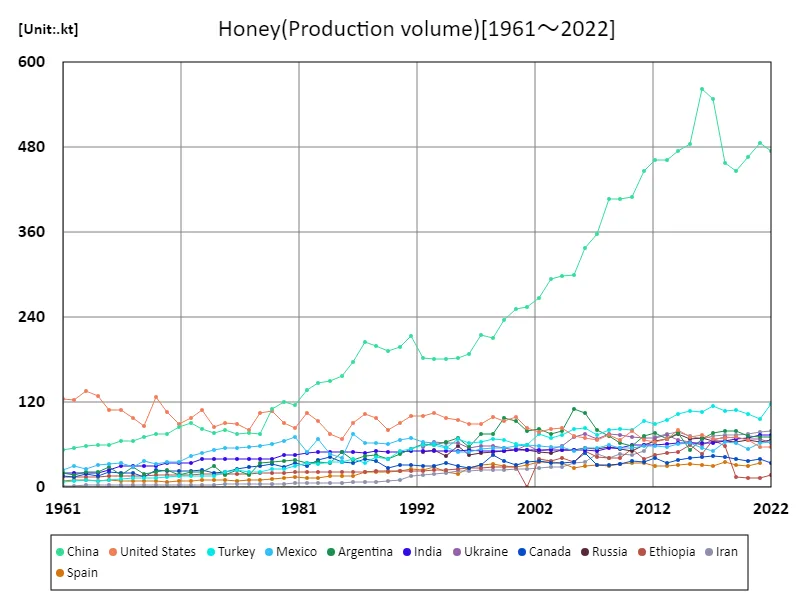
The maximum is 563kt[2016] of China, and the current value is about 84.2%
Honey export volumes (latest year, countries around the world)
According to 2021 data, global honey exports totaled 775 kilotonnes (kt), with China being the largest exporter at 148kt. China’s exports account for approximately 19% of the global market, and its dominance continues to be significant. China has been a major exporter of honey for many years, especially to European and North American markets. Other major exporters include Argentina, Ukraine and Mexico, although their export volumes are significantly smaller than China’s. For example, Argentina has maintained relatively consistent high export volumes, and Ukraine is also known as a stable supplier. The overall average export volume was 4.94kt, with the influence of major exporting countries strongly reflected in the overall market. These data show that the honey market is highly country dependent. It is also important to take into account market fluctuations as they are primarily driven by weather conditions in producing countries, policies and international trade situations.
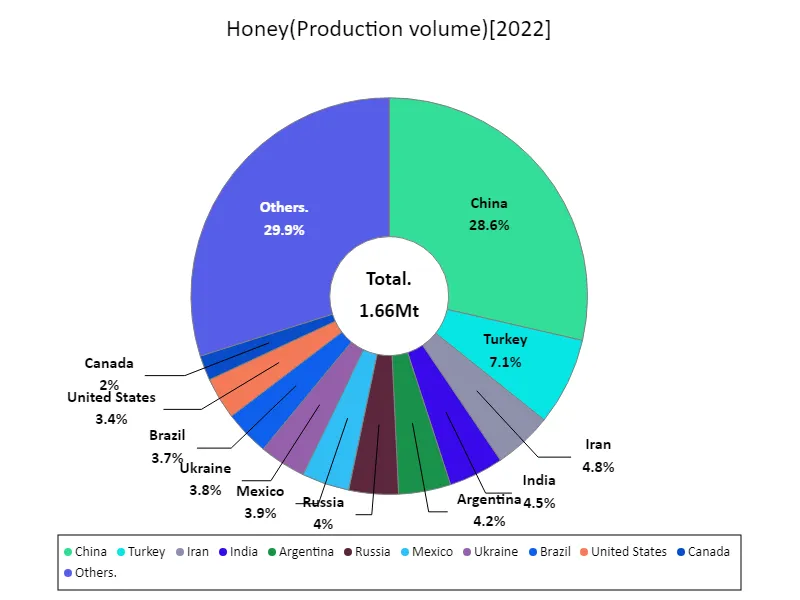
The maximum is 474kt of China, the average is 13.6kt, and the total is 1.66Mt
Honey exports (continental)
According to data for 2021, global honey exports totaled 775 kilotonnes (kt), of which the Asian region recorded the largest export volume with 320 kt. Asia clearly plays a central role in the honey market, with China in particular maintaining its leading position. China is responsible for the majority of Asia’s exports and is known as a major supplier to the global market. Other major honey exporters in Asia include India and Thailand, but China’s influence is particularly notable. For many years, China has maintained an advantage in the market due to its stable quality and large production volume, which is driving the increase in exports across Asia. As a general trend, honey exports from Asia are on the rise, strengthening Asia’s influence in the global market. Asian producers are expanding their supplies to the European and North American markets, backed by their price competitiveness and high production capacity. On the other hand, as export volumes increase, there is a demand for quality control and sustainable production methods. These factors will be important competitive factors in the market going forward.
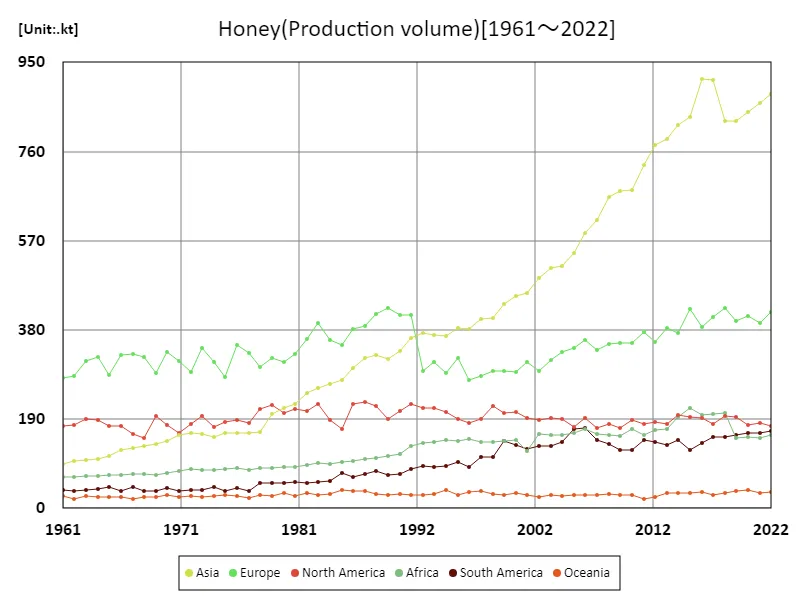
The maximum is 913kt[2016] of Asia, and the current value is about 96.6%
Honey exports (latest year, continental)
According to 2021 honey export data, the total global export volume was 779 kilotonnes (kt), with Asia accounting for the largest share with 320kt. This figure indicates that Asia plays a key role in the global honey market. The major exporting countries in Asia are China, India and Thailand, with China in particular boasting the largest export volume. The increase in Asian exports is mainly due to China’s high production and efficient export structure. China has long dominated the honey market, supplying large volumes to the European and North American markets and far surpassing other regions. Asian export volumes in 2021 also reflect increased competition within the region as well as quality and price adjustments. The overall average export volume was 130kt, with Asia’s export volume of 320kt being significantly higher than this average, indicating the large influence Asia has on the overall market. The honey market in Asia will continue to face challenges in maintaining stable supplies and competitive pricing, while at the same time improving quality and adopting sustainable production methods. This will ensure that Asia continues to occupy an important position in the global market.
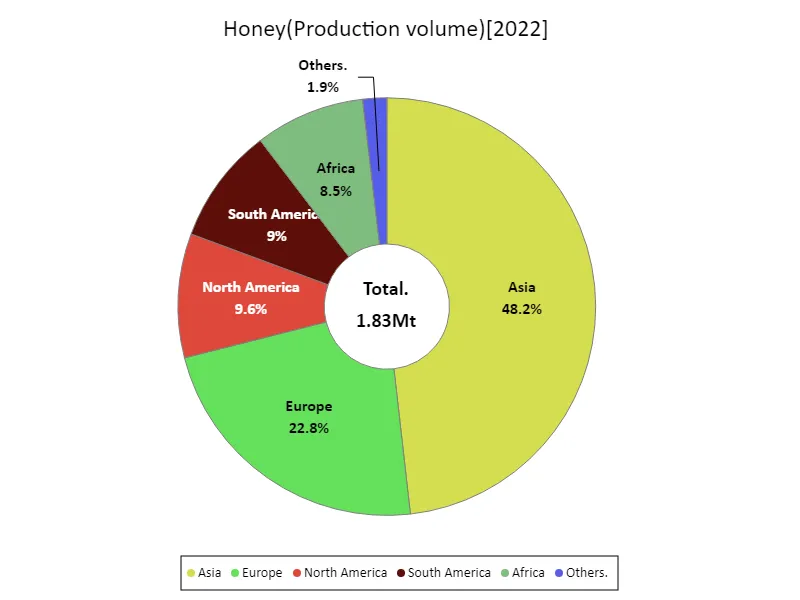
The maximum is 882kt of Asia, the average is 305kt, and the total is 1.83Mt
Main data
| Production(Honey, Production volume) [Mt] | ||||||||||
|---|---|---|---|---|---|---|---|---|---|---|
| World | Upper-middle-income countries | Asia | Eastern Asia | China | Europe | Lower-middle-income countries | Americas | High-income countries | European Union | |
| 2022 | 1.83 | 0.94 | 0.88 | 0.51 | 0.47 | 0.42 | 0.38 | 0.34 | 0.29 | 0.24 |
| 2021 | 1.79 | 0.91 | 0.86 | 0.52 | 0.49 | 0.4 | 0.38 | 0.34 | 0.35 | 0.23 |
| 2020 | 1.78 | 0.89 | 0.84 | 0.5 | 0.47 | 0.41 | 0.38 | 0.34 | 0.4 | 0.24 |
| 2019 | 1.76 | 0.9 | 0.83 | 0.48 | 0.45 | 0.4 | 0.37 | 0.35 | 0.42 | 0.23 |
| 2018 | 1.84 | 0.9 | 0.82 | 0.49 | 0.46 | 0.43 | 0.38 | 0.35 | 0.43 | 0.25 |
| 2017 | 1.88 | 0.97 | 0.91 | 0.58 | 0.55 | 0.41 | 0.36 | 0.33 | 0.45 | 0.24 |
| 2016 | 1.86 | 0.98 | 0.91 | 0.6 | 0.56 | 0.39 | 0.35 | 0.33 | 0.44 | 0.22 |
| 2015 | 1.82 | 0.89 | 0.83 | 0.52 | 0.48 | 0.42 | 0.36 | 0.32 | 0.47 | 0.25 |
| 2014 | 1.76 | 0.89 | 0.82 | 0.5 | 0.47 | 0.37 | 0.36 | 0.35 | 0.42 | 0.2 |
| 2013 | 1.69 | 0.85 | 0.79 | 0.49 | 0.46 | 0.38 | 0.34 | 0.31 | 0.41 | 0.21 |
| 2012 | 1.64 | 0.84 | 0.77 | 0.49 | 0.46 | 0.36 | 0.33 | 0.32 | 0.39 | 0.19 |
| 2011 | 1.61 | 0.83 | 0.73 | 0.47 | 0.45 | 0.38 | 0.3 | 0.33 | 0.41 | 0.21 |
| 2010 | 1.54 | 0.76 | 0.68 | 0.43 | 0.41 | 0.35 | 0.29 | 0.31 | 0.4 | 0.2 |
| 2009 | 1.51 | 0.76 | 0.68 | 0.44 | 0.41 | 0.35 | 0.29 | 0.29 | 0.38 | 0.19 |
| 2008 | 1.52 | 0.77 | 0.66 | 0.44 | 0.41 | 0.35 | 0.29 | 0.32 | 0.39 | 0.19 |
| 2007 | 1.45 | 0.71 | 0.61 | 0.39 | 0.36 | 0.34 | 0.29 | 0.32 | 0.38 | 0.19 |
| 2006 | 1.51 | 0.73 | 0.59 | 0.36 | 0.34 | 0.36 | 0.29 | 0.36 | 0.41 | 0.2 |
| 2005 | 1.42 | 0.68 | 0.54 | 0.33 | 0.3 | 0.34 | 0.29 | 0.34 | 0.38 | 0.19 |
| 2004 | 1.36 | 0.64 | 0.52 | 0.32 | 0.3 | 0.33 | 0.26 | 0.33 | 0.4 | 0.2 |
| 2003 | 1.34 | 0.62 | 0.51 | 0.32 | 0.29 | 0.31 | 0.26 | 0.33 | 0.39 | 0.19 |
| 2002 | 1.29 | 0.6 | 0.49 | 0.29 | 0.27 | 0.29 | 0.25 | 0.32 | 0.37 | 0.17 |
| 2001 | 1.24 | 0.58 | 0.46 | 0.28 | 0.25 | 0.31 | 0.26 | 0.32 | 0.38 | 0.18 |
| 2000 | 1.26 | 0.58 | 0.45 | 0.27 | 0.25 | 0.29 | 0.24 | 0.34 | 0.38 | 0.17 |
| 1999 | 1.24 | 0.57 | 0.43 | 0.25 | 0.24 | 0.29 | 0.24 | 0.35 | 0.37 | 0.17 |
| 1998 | 1.19 | 0.52 | 0.4 | 0.22 | 0.21 | 0.29 | 0.24 | 0.33 | 0.37 | 0.16 |
| 1997 | 1.16 | 0.52 | 0.4 | 0.23 | 0.22 | 0.28 | 0.24 | 0.3 | 0.34 | 0.16 |
| 1996 | 1.11 | 0.47 | 0.38 | 0.2 | 0.19 | 0.27 | 0.24 | 0.27 | 0.33 | 0.15 |
| 1995 | 1.16 | 0.5 | 0.38 | 0.2 | 0.18 | 0.32 | 0.24 | 0.29 | 0.36 | 0.18 |
| 1994 | 1.13 | 0.47 | 0.37 | 0.19 | 0.18 | 0.29 | 0.25 | 0.3 | 0.36 | 0.16 |
| 1993 | 1.15 | 0.48 | 0.37 | 0.19 | 0.18 | 0.31 | 0.24 | 0.3 | 0.37 | 0.18 |
| 1992 | 1.14 | 0.5 | 0.37 | 0.2 | 0.18 | 0.29 | 0.23 | 0.3 | 0.34 | 0.16 |
| 1991 | 1.24 | 0.69 | 0.36 | 0.23 | 0.21 | 0.41 | 0.15 | 0.31 | 0.34 | 0.15 |
| 1990 | 1.18 | 0.66 | 0.34 | 0.21 | 0.2 | 0.41 | 0.14 | 0.28 | 0.33 | 0.15 |
| 1989 | 1.15 | 0.63 | 0.32 | 0.21 | 0.19 | 0.43 | 0.14 | 0.26 | 0.34 | 0.17 |
| 1988 | 1.18 | 0.66 | 0.33 | 0.21 | 0.2 | 0.41 | 0.13 | 0.3 | 0.34 | 0.15 |
| 1987 | 1.15 | 0.63 | 0.32 | 0.22 | 0.21 | 0.39 | 0.13 | 0.3 | 0.35 | 0.15 |
| 1986 | 1.11 | 0.61 | 0.3 | 0.19 | 0.18 | 0.38 | 0.13 | 0.29 | 0.34 | 0.15 |
| 1985 | 1 | 0.55 | 0.27 | 0.17 | 0.16 | 0.35 | 0.12 | 0.25 | 0.29 | 0.13 |
| 1984 | 0.99 | 0.52 | 0.26 | 0.16 | 0.15 | 0.36 | 0.12 | 0.25 | 0.31 | 0.14 |
| 1983 | 1.05 | 0.56 | 0.26 | 0.16 | 0.15 | 0.39 | 0.12 | 0.28 | 0.34 | 0.16 |
| 1982 | 0.99 | 0.5 | 0.25 | 0.15 | 0.14 | 0.36 | 0.11 | 0.26 | 0.34 | 0.15 |
| 1981 | 0.93 | 0.49 | 0.22 | 0.13 | 0.12 | 0.33 | 0.11 | 0.27 | 0.29 | 0.12 |
| 1980 | 0.9 | 0.48 | 0.21 | 0.13 | 0.12 | 0.31 | 0.11 | 0.26 | 0.28 | 0.11 |
| 1979 | 0.91 | 0.47 | 0.2 | 0.12 | 0.11 | 0.32 | 0.1 | 0.27 | 0.3 | 0.12 |
| 1978 | 0.84 | 0.42 | 0.16 | 0.09 | 0.08 | 0.3 | 0.1 | 0.27 | 0.29 | 0.11 |
| 1977 | 0.81 | 0.43 | 0.16 | 0.09 | 0.08 | 0.33 | 0.09 | 0.22 | 0.25 | 0.1 |
| 1976 | 0.85 | 0.42 | 0.16 | 0.08 | 0.08 | 0.35 | 0.09 | 0.23 | 0.3 | 0.13 |
| 1975 | 0.77 | 0.39 | 0.16 | 0.09 | 0.08 | 0.28 | 0.09 | 0.22 | 0.25 | 0.09 |
| 1974 | 0.79 | 0.41 | 0.15 | 0.08 | 0.08 | 0.31 | 0.09 | 0.22 | 0.25 | 0.09 |
| 1973 | 0.84 | 0.43 | 0.16 | 0.09 | 0.08 | 0.34 | 0.09 | 0.23 | 0.28 | 0.1 |
| 1972 | 0.78 | 0.39 | 0.16 | 0.1 | 0.09 | 0.29 | 0.09 | 0.22 | 0.25 | 0.09 |
| 1971 | 0.77 | 0.39 | 0.16 | 0.09 | 0.09 | 0.31 | 0.08 | 0.2 | 0.26 | 0.1 |
| 1970 | 0.8 | 0.4 | 0.14 | 0.08 | 0.08 | 0.33 | 0.08 | 0.22 | 0.28 | 0.1 |
| 1969 | 0.75 | 0.36 | 0.14 | 0.08 | 0.08 | 0.29 | 0.07 | 0.23 | 0.28 | 0.09 |
| 1968 | 0.74 | 0.38 | 0.13 | 0.08 | 0.07 | 0.32 | 0.07 | 0.19 | 0.24 | 0.1 |
| 1967 | 0.75 | 0.38 | 0.13 | 0.07 | 0.07 | 0.33 | 0.08 | 0.2 | 0.26 | 0.1 |
| 1966 | 0.76 | 0.39 | 0.13 | 0.07 | 0.07 | 0.33 | 0.08 | 0.21 | 0.26 | 0.09 |
| 1965 | 0.71 | 0.36 | 0.11 | 0.07 | 0.06 | 0.28 | 0.07 | 0.22 | 0.25 | 0.08 |
| 1964 | 0.75 | 0.37 | 0.11 | 0.07 | 0.06 | 0.32 | 0.06 | 0.23 | 0.28 | 0.09 |
| 1963 | 0.74 | 0.37 | 0.1 | 0.07 | 0.06 | 0.31 | 0.06 | 0.23 | 0.28 | 0.08 |
| 1962 | 0.68 | 0.34 | 0.1 | 0.07 | 0.06 | 0.28 | 0.06 | 0.21 | 0.24 | 0.07 |
| 1961 | 0.68 | 0.34 | 0.09 | 0.06 | 0.05 | 0.28 | 0.06 | 0.21 | 0.24 | 0.06 |


Comments