Abstract
Pistachio production has evolved significantly over the years, with various regions showing notable trends. Historically, Iran and the U.S. have dominated global production, leveraging their favorable climates. However, in recent years, Jordan has emerged as a notable player, demonstrating impressive yields. For 2022, Jordan achieved the highest production rate of 3.74 tons per hectare, reflecting advancements in agricultural practices and optimal growing conditions. This rise highlights Jordan’s growing role in the global pistachio market, complementing traditional leaders and diversifying production sources.
Pistachio production (worldwide)
Pistachio production trends from 1961 to 2022 reveal significant shifts in yield and regional prominence. Azerbaijan achieved a peak yield of 9.52 tons per hectare in 2002, the highest on record. However, it currently operates at just 30% of this peak, indicating a decline in production efficiency or changing conditions. Traditionally, Iran and the U.S. have been major producers, but recent years have seen other regions, like Jordan, rising in prominence. Global trends reflect technological advancements, varying climatic impacts, and shifts in agricultural practices influencing pistachio yields.
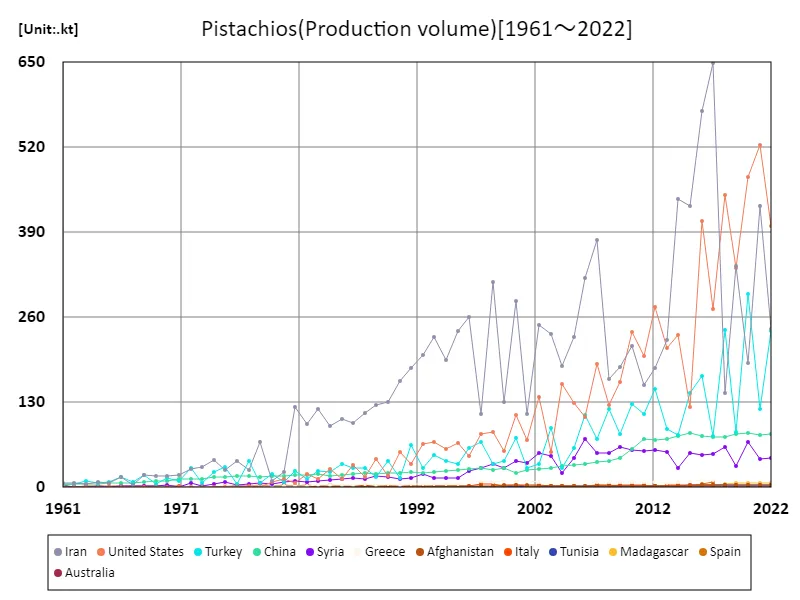
The maximum is 649kt[2017] of Iran, and the current value is about 37.2%
Pistachio production (latest year, by country)
As of 2022, Jordan leads in pistachio yield with 3.74 tons per hectare, surpassing the global average of 1.43 tons per hectare. This indicates Jordan’s advanced agricultural practices or optimal conditions. Historically, the total global yield has been around 24.3 tons per hectare, reflecting significant production diversity. Trends show a rise in yields in various regions due to improved farming techniques and climate adaptation. This highlights a shift towards higher efficiency and varying regional performance in pistachio cultivation worldwide.
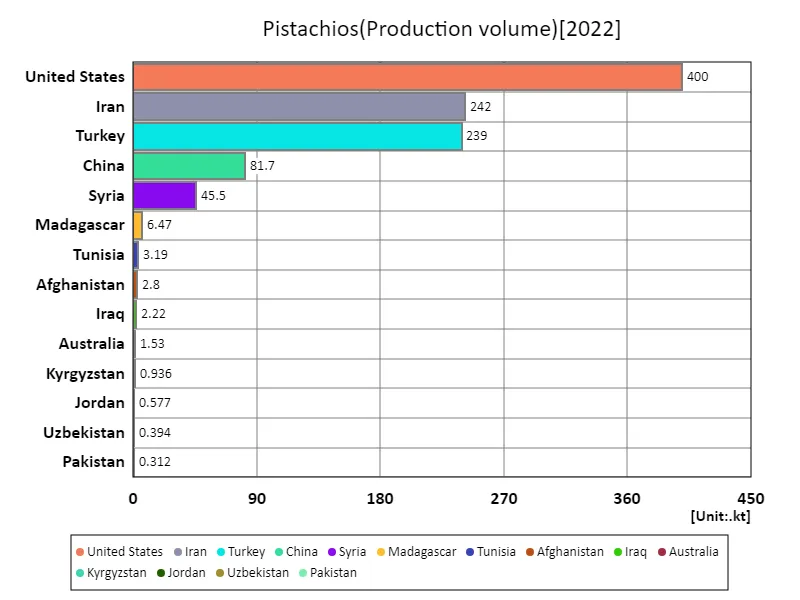
The maximum is 400kt of United States, the average is 54kt, and the total is 1.03Mt
Pistachio production (continent)
In 2022, the European Union achieved the highest pistachio yield globally at 74.1 tons per hectare, reflecting significant advancements in cultivation practices. This exceptional figure highlights the EU’s leading role in optimizing pistachio production. Historically, yields have varied widely, influenced by factors such as climate, technology, and agricultural methods. Trends indicate that improved techniques and better management practices are driving higher yields, with regions like the EU showing remarkable success. This demonstrates a broader global shift towards increased efficiency and productivity in pistachio farming.
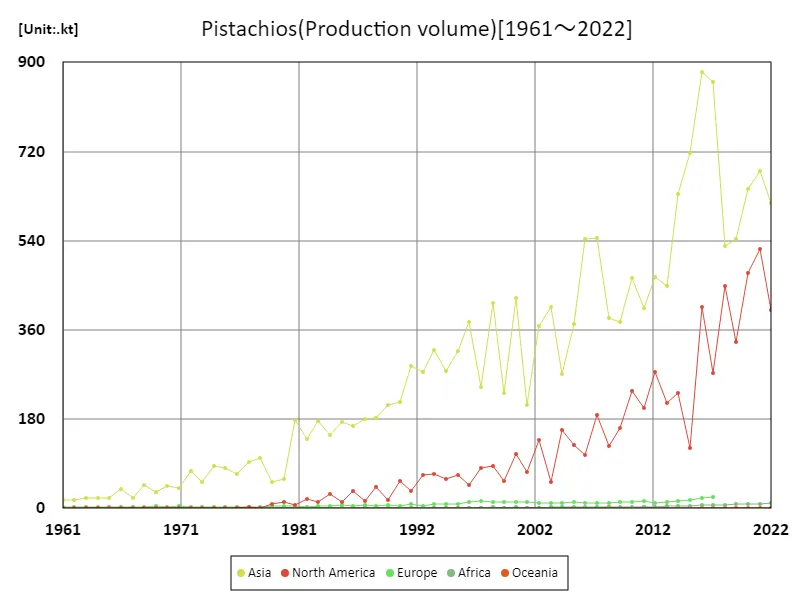
The maximum is 880kt[2016] of Asia, and the current value is about 70%
Pistachio production (latest year, continental)
In 2022, North America led in pistachio yield with 2.31 tons per hectare, highlighting its advanced cultivation methods. The average yield globally stands at 0.934 tons per hectare, with a total production yield of 4.67 tons per hectare. This suggests a disparity in productivity across regions, with North America demonstrating higher efficiency. Trends show that improvements in agricultural practices and technology are enhancing yields. The data reflects ongoing advancements and varying regional performance, emphasizing the potential for increased productivity in global pistachio farming.
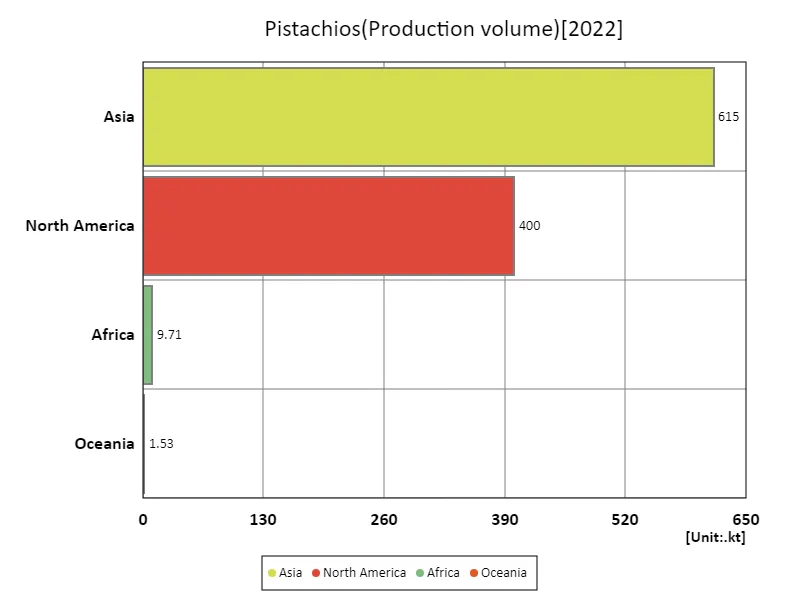
The maximum is 615kt of Asia, the average is 257kt, and the total is 1.03Mt
Main data
| Production(Pistachios, Production volume) [Mt] | ||||||||||
|---|---|---|---|---|---|---|---|---|---|---|
| World | Asia | High-income countries | North America | Americas | United States | Northern America | Upper-middle-income countries | Western Asia | Lower-middle-income countries | |
| 2022 | 1.03 | 0.62 | 0.4 | 0.4 | 0.4 | 0.4 | 0.4 | 0.32 | 0.29 | 0.25 |
| 2021 | 1.21 | 0.68 | 0.53 | 0.52 | 0.52 | 0.52 | 0.52 | 0.2 | 0.17 | 0.44 |
| 2020 | 1.13 | 0.65 | 0.48 | 0.47 | 0.47 | 0.47 | 0.47 | 0.38 | 0.37 | 0.2 |
| 2019 | 0.89 | 0.54 | 0.34 | 0.34 | 0.34 | 0.34 | 0.34 | 0.17 | 0.12 | 0.34 |
| 2018 | 0.99 | 0.53 | 0.45 | 0.45 | 0.45 | 0.45 | 0.45 | 0.32 | 0.3 | 0.15 |
| 2017 | 1.16 | 0.86 | 0.3 | 0.27 | 0.27 | 0.27 | 0.27 | 0.16 | 0.13 | 0.65 |
| 2016 | 1.32 | 0.88 | 0.43 | 0.41 | 0.41 | 0.41 | 0.41 | 0.25 | 0.22 | 0.58 |
| 2015 | 0.86 | 0.72 | 0.14 | 0.12 | 0.12 | 0.12 | 0.12 | 0.23 | 0.2 | 0.44 |
| 2014 | 0.89 | 0.63 | 0.25 | 0.23 | 0.23 | 0.23 | 0.23 | 0.16 | 0.11 | 0.45 |
| 2013 | 0.68 | 0.45 | 0.23 | 0.21 | 0.21 | 0.21 | 0.21 | 0.16 | 0.14 | 0.23 |
| 2012 | 0.76 | 0.47 | 0.29 | 0.28 | 0.28 | 0.28 | 0.28 | 0.22 | 0.21 | 0.19 |
| 2011 | 0.62 | 0.4 | 0.22 | 0.2 | 0.2 | 0.2 | 0.2 | 0.19 | 0.17 | 0.16 |
| 2010 | 0.72 | 0.46 | 0.25 | 0.24 | 0.24 | 0.24 | 0.24 | 0.19 | 0.19 | 0.22 |
| 2009 | 0.55 | 0.38 | 0.17 | 0.16 | 0.16 | 0.16 | 0.16 | 0.13 | 0.14 | 0.19 |
| 2008 | 0.53 | 0.38 | 0.14 | 0.13 | 0.13 | 0.13 | 0.13 | 0.16 | 0.17 | 0.17 |
| 2007 | 0.75 | 0.55 | 0.2 | 0.19 | 0.19 | 0.19 | 0.19 | 0.11 | 0.13 | 0.38 |
| 2006 | 0.66 | 0.54 | 0.12 | 0.11 | 0.11 | 0.11 | 0.11 | 0.15 | 0.18 | 0.32 |
| 2005 | 0.52 | 0.37 | 0.14 | 0.13 | 0.13 | 0.13 | 0.13 | 0.09 | 0.1 | 0.23 |
| 2004 | 0.44 | 0.27 | 0.17 | 0.16 | 0.16 | 0.16 | 0.16 | 0.06 | 0.05 | 0.19 |
| 2003 | 0.47 | 0.41 | 0.06 | 0.05 | 0.05 | 0.05 | 0.05 | 0.12 | 0.14 | 0.24 |
| 2002 | 0.52 | 0.37 | 0.15 | 0.14 | 0.14 | 0.14 | 0.14 | 0.06 | 0.09 | 0.25 |
| 2001 | 0.3 | 0.21 | 0.08 | 0.07 | 0.07 | 0.07 | 0.07 | 0.06 | 0.07 | 0.11 |
| 2000 | 0.55 | 0.42 | 0.12 | 0.11 | 0.11 | 0.11 | 0.11 | 0.1 | 0.11 | 0.29 |
| 1999 | 0.3 | 0.23 | 0.07 | 0.06 | 0.06 | 0.06 | 0.06 | 0.07 | 0.07 | 0.13 |
| 1998 | 0.51 | 0.41 | 0.1 | 0.09 | 0.09 | 0.09 | 0.09 | 0.06 | 0.07 | 0.32 |
| 1997 | 0.34 | 0.24 | 0.1 | 0.08 | 0.08 | 0.08 | 0.08 | 0.1 | 0.1 | 0.11 |
| 1996 | 0.44 | 0.38 | 0.06 | 0.05 | 0.05 | 0.05 | 0.05 | 0.09 | 0.08 | 0.26 |
| 1995 | 0.39 | 0.32 | 0.08 | 0.07 | 0.07 | 0.07 | 0.07 | 0.06 | 0.05 | 0.24 |
| 1994 | 0.35 | 0.28 | 0.07 | 0.06 | 0.06 | 0.06 | 0.06 | 0.07 | 0.05 | 0.2 |
| 1993 | 0.4 | 0.32 | 0.08 | 0.07 | 0.07 | 0.07 | 0.07 | 0.07 | 0.06 | 0.23 |
| 1992 | 0.35 | 0.27 | 0.07 | 0.07 | 0.07 | 0.07 | 0.07 | 0.05 | 0.05 | 0.2 |
| 1991 | 0.33 | 0.29 | 0.04 | 0.03 | 0.03 | 0.03 | 0.03 | 0.09 | 0.08 | 0.18 |
| 1990 | 0.27 | 0.21 | 0.06 | 0.05 | 0.05 | 0.05 | 0.05 | 0.04 | 0.03 | 0.16 |
| 1989 | 0.24 | 0.21 | 0.03 | 0.02 | 0.02 | 0.02 | 0.02 | 0.06 | 0.06 | 0.13 |
| 1988 | 0.23 | 0.18 | 0.05 | 0.04 | 0.04 | 0.04 | 0.04 | 0.04 | 0.03 | 0.13 |
| 1987 | 0.2 | 0.18 | 0.02 | 0.02 | 0.02 | 0.02 | 0.02 | 0.05 | 0.04 | 0.11 |
| 1986 | 0.2 | 0.17 | 0.04 | 0.03 | 0.03 | 0.03 | 0.03 | 0.05 | 0.04 | 0.1 |
| 1985 | 0.19 | 0.17 | 0.02 | 0.01 | 0.01 | 0.01 | 0.01 | 0.05 | 0.05 | 0.11 |
| 1984 | 0.18 | 0.15 | 0.03 | 0.03 | 0.03 | 0.03 | 0.03 | 0.04 | 0.03 | 0.09 |
| 1983 | 0.19 | 0.18 | 0.02 | 0.01 | 0.01 | 0.01 | 0.01 | 0.05 | 0.03 | 0.12 |
| 1982 | 0.16 | 0.14 | 0.02 | 0.02 | 0.02 | 0.02 | 0.02 | 0.03 | 0.02 | 0.1 |
| 1981 | 0.19 | 0.18 | 0.01 | 0.01 | 0.01 | 0.01 | 0.01 | 0.04 | 0.03 | 0.12 |
| 1980 | 0.08 | 0.06 | 0.02 | 0.01 | 0.01 | 0.01 | 0.01 | 0.03 | 0.02 | 0.02 |
| 1979 | 0.06 | 0.05 | 0.01 | 0.01 | 0.01 | 0.01 | 0.01 | 0.04 | 0.03 | 0.01 |
| 1978 | 0.11 | 0.1 | 0 | 0 | 0 | 0 | 0 | 0.02 | 0.01 | 0.07 |
| 1977 | 0.1 | 0.09 | 0 | 0 | 0 | 0 | 0 | 0.06 | 0.05 | 0.03 |
| 1976 | 0.07 | 0.07 | 0 | 0.02 | 0.01 | 0.04 | ||||
| 1975 | 0.09 | 0.08 | 0 | 0.05 | 0.04 | 0.03 | ||||
| 1974 | 0.09 | 0.09 | 0 | 0.04 | 0.03 | 0.04 | ||||
| 1973 | 0.06 | 0.05 | 0 | 0.02 | 0.01 | 0.03 | ||||
| 1972 | 0.08 | 0.07 | 0 | 0.04 | 0.03 | 0.03 | ||||
| 1971 | 0.04 | 0.04 | 0 | 0.02 | 0.01 | 0.02 | ||||
| 1970 | 0.05 | 0.05 | 0 | 0.02 | 0.02 | 0.02 | ||||
| 1969 | 0.04 | 0.03 | 0 | 0.01 | 0.01 | 0.02 | ||||
| 1968 | 0.05 | 0.05 | 0 | 0.03 | 0.02 | 0.02 | ||||
| 1967 | 0.02 | 0.02 | 0 | 0.02 | 0.01 | 0 | ||||
| 1966 | 0.04 | 0.04 | 0 | 0.02 | 0.02 | 0.02 | ||||
| 1965 | 0.03 | 0.02 | 0 | 0.01 | 0.01 | 0.01 | ||||
| 1964 | 0.02 | 0.02 | 0 | 0.01 | 0.01 | 0.01 | ||||
| 1963 | 0.02 | 0.02 | 0 | 0.01 | 0.01 | 0.01 | ||||
| 1962 | 0.02 | 0.02 | 0 | 0.01 | 0.01 | 0.01 | ||||
| 1961 | 0.02 | 0.02 | 0 | 0.01 | 0.01 | 0.01 | ||||
Comments