Abstract
Almond and pistachio production has seen significant growth over the past few decades, with the United States emerging as a global leader. By 2022, the U.S. produced 1.86 million tons of almonds, accounting for the majority of global output. The U.S. is also a major pistachio producer, although Iran and Turkey are key competitors. Historically, production has been concentrated in regions with favorable climates, like California for almonds. Rising demand, particularly in Asia, and shifts in farming techniques have driven this growth. The U.S. remains dominant due to its large-scale, mechanized farming and innovations in irrigation.
Almond production (worldwide)
Almond production has steadily increased since 1961, with the United States consistently leading global output. The peak of 2.35 million tons in 2020 marked the highest production level. By 2022, the U.S. was producing 79.2% of its peak, reflecting some fluctuation due to factors like water availability, climate conditions, and market demand. California, with its ideal growing conditions, remains the primary source of U.S. almonds. Over the years, advances in farming techniques, mechanization, and improved irrigation have supported sustained growth, while global demand, particularly in Asia, has driven export expansion.
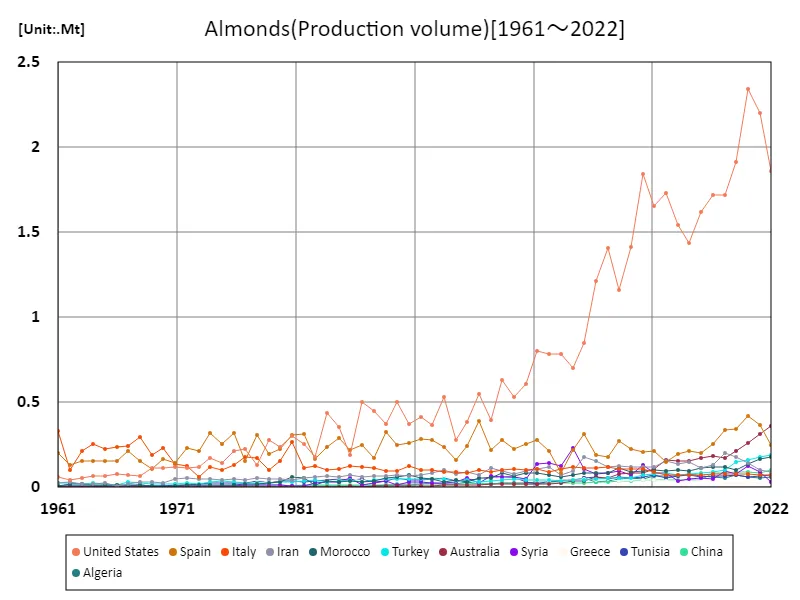
The maximum is 2.35Mt[2020] of United States, and the current value is about 79.2%
Almond production (latest year, world wide)
In 2022, global almond production reached 3.63 million tons, with the United States leading at 1.86 million tons, making up a significant share of the total. The average production globally was 56.7 thousand tons, highlighting the U.S.’s dominance in the market. Almond production has grown steadily over the decades, driven by rising demand, particularly in Asia. Key production areas, especially California, benefit from ideal climates and advanced farming methods. Challenges such as water availability and climate fluctuations have impacted production, but global consumption remains strong, supporting ongoing growth.
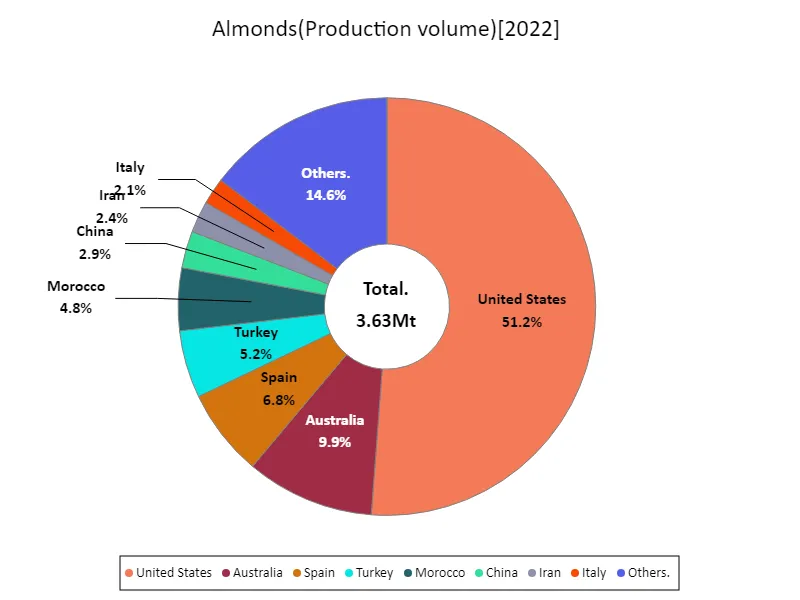
The maximum is 1.86Mt of United States, the average is 57.6kt, and the total is 3.63Mt
Pistachio production (worldwide)
In 2022, global pistachio production reached significant levels, with Iran leading at 649,000 tons, the highest recorded production. Over the years, Iran has maintained its position as the largest producer, benefiting from favorable climates and established farming practices. However, the U.S. is a close competitor, particularly in California, where production has grown due to advancements in agricultural techniques. Global demand for pistachios, especially in snacks and culinary products, has driven increased production. Climate factors, such as droughts, have posed challenges, but demand remains strong in key markets like Europe and Asia.
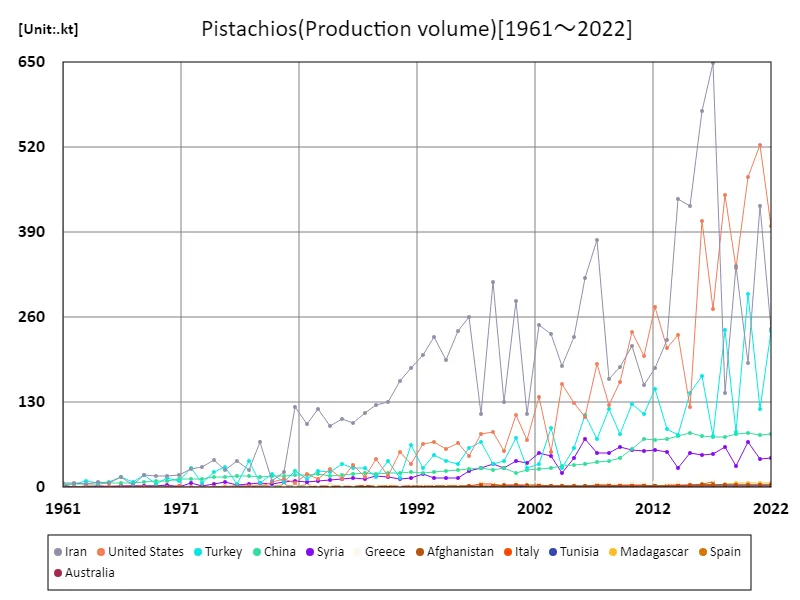
The maximum is 649kt[2017] of Iran, and the current value is about 37.2%
Pistachio production by country (latest year)
In 2022, global pistachio production reached 1.03 million tons, with the United States leading at 400,000 tons, the highest recorded for any country. The average global production stood at 51.3 thousand tons, reflecting a significant concentration in a few key regions. The U.S., particularly California, has seen substantial growth due to advanced farming techniques and optimal growing conditions. While Iran remains a major producer, U.S. output has risen due to strong demand in both domestic and international markets. Challenges such as water availability and climate fluctuations have impacted growth, but global demand continues to rise.
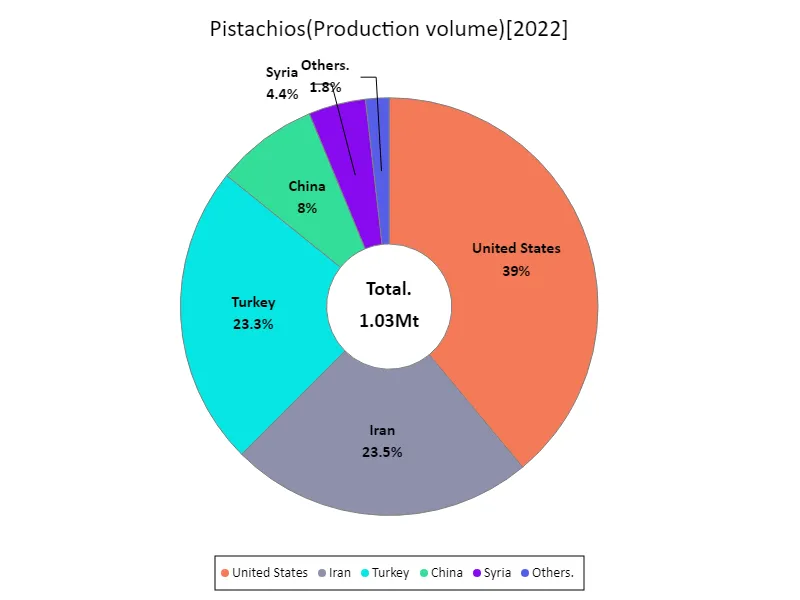
The maximum is 400kt of United States, the average is 54kt, and the total is 1.03Mt
Main data
| Production(Almonds, Production volume) [Mt] | ||||||||||
|---|---|---|---|---|---|---|---|---|---|---|
| World | High-income countries | Americas | North America | United States | Northern America | Asia | Lower-middle-income countries | Europe | European Union | |
| 2022 | 3.63 | 2.69 | 1.91 | 1.86 | 1.86 | 1.86 | 0.6 | 0.49 | 0.41 | 0.41 |
| 2021 | 4.03 | 3.08 | 2.25 | 2.2 | 2.2 | 2.2 | 0.63 | 0.48 | 0.51 | 0.51 |
| 2020 | 4.17 | 3.22 | 2.39 | 2.35 | 2.35 | 2.35 | 0.67 | 0.49 | 0.56 | 0.56 |
| 2019 | 3.58 | 2.65 | 1.96 | 1.91 | 1.91 | 1.91 | 0.65 | 0.51 | 0.48 | 0.47 |
| 2018 | 3.32 | 2.41 | 1.76 | 1.72 | 1.72 | 1.72 | 0.63 | 0.53 | 0.47 | 0.47 |
| 2017 | 3.11 | 2.35 | 1.75 | 1.72 | 1.72 | 1.72 | 0.48 | 0.44 | 0.4 | 0.4 |
| 2016 | 2.86 | 2.16 | 1.65 | 1.62 | 1.62 | 1.62 | 0.43 | 0.43 | 0.32 | 0.32 |
| 2015 | 2.7 | 1.96 | 1.47 | 1.44 | 1.44 | 1.44 | 0.46 | 0.48 | 0.33 | 0.33 |
| 2014 | 2.74 | 2.05 | 1.58 | 1.55 | 1.55 | 1.55 | 0.42 | 0.45 | 0.32 | 0.32 |
| 2013 | 2.95 | 2.2 | 1.76 | 1.73 | 1.73 | 1.73 | 0.51 | 0.45 | 0.27 | 0.27 |
| 2012 | 2.91 | 2.15 | 1.68 | 1.66 | 1.66 | 1.66 | 0.49 | 0.43 | 0.35 | 0.35 |
| 2011 | 3.08 | 2.32 | 1.87 | 1.84 | 1.84 | 1.84 | 0.52 | 0.4 | 0.36 | 0.36 |
| 2010 | 2.58 | 1.91 | 1.44 | 1.41 | 1.41 | 1.41 | 0.44 | 0.39 | 0.38 | 0.38 |
| 2009 | 2.42 | 1.7 | 1.18 | 1.16 | 1.16 | 1.16 | 0.47 | 0.43 | 0.43 | 0.43 |
| 2008 | 2.48 | 1.85 | 1.43 | 1.41 | 1.41 | 1.41 | 0.43 | 0.38 | 0.36 | 0.35 |
| 2007 | 2.29 | 1.65 | 1.23 | 1.21 | 1.21 | 1.21 | 0.44 | 0.41 | 0.36 | 0.36 |
| 2006 | 2.08 | 1.4 | 0.86 | 0.85 | 0.85 | 0.85 | 0.48 | 0.45 | 0.49 | 0.49 |
| 2005 | 1.85 | 1.16 | 0.71 | 0.7 | 0.7 | 0.7 | 0.51 | 0.34 | 0.4 | 0.4 |
| 2004 | 1.61 | 1.08 | 0.8 | 0.79 | 0.79 | 0.79 | 0.36 | 0.29 | 0.26 | 0.26 |
| 2003 | 1.77 | 1.18 | 0.8 | 0.79 | 0.79 | 0.79 | 0.43 | 0.33 | 0.36 | 0.36 |
| 2002 | 1.85 | 1.29 | 0.81 | 0.8 | 0.8 | 0.8 | 0.41 | 0.31 | 0.45 | 0.45 |
| 2001 | 1.55 | 1.07 | 0.62 | 0.61 | 0.61 | 0.61 | 0.31 | 0.31 | 0.43 | 0.43 |
| 2000 | 1.45 | 0.97 | 0.54 | 0.53 | 0.53 | 0.53 | 0.3 | 0.3 | 0.4 | 0.4 |
| 1999 | 1.66 | 1.13 | 0.64 | 0.63 | 0.63 | 0.63 | 0.33 | 0.35 | 0.47 | 0.47 |
| 1998 | 1.31 | 0.8 | 0.4 | 0.39 | 0.39 | 0.39 | 0.35 | 0.34 | 0.38 | 0.38 |
| 1997 | 1.59 | 1.17 | 0.56 | 0.55 | 0.55 | 0.55 | 0.27 | 0.29 | 0.6 | 0.6 |
| 1996 | 1.29 | 0.82 | 0.39 | 0.39 | 0.39 | 0.39 | 0.34 | 0.3 | 0.41 | 0.41 |
| 1995 | 1.05 | 0.63 | 0.28 | 0.28 | 0.28 | 0.28 | 0.29 | 0.27 | 0.34 | 0.34 |
| 1994 | 1.38 | 0.97 | 0.53 | 0.53 | 0.53 | 0.53 | 0.29 | 0.28 | 0.42 | 0.42 |
| 1993 | 1.28 | 0.87 | 0.37 | 0.36 | 0.36 | 0.36 | 0.26 | 0.27 | 0.49 | 0.49 |
| 1992 | 1.32 | 0.92 | 0.42 | 0.41 | 0.41 | 0.41 | 0.25 | 0.25 | 0.5 | 0.5 |
| 1991 | 1.29 | 0.89 | 0.37 | 0.37 | 0.37 | 0.37 | 0.22 | 0.24 | 0.52 | 0.5 |
| 1990 | 1.32 | 0.93 | 0.5 | 0.5 | 0.5 | 0.5 | 0.21 | 0.24 | 0.45 | 0.43 |
| 1989 | 1.27 | 0.89 | 0.37 | 0.37 | 0.37 | 0.37 | 0.22 | 0.21 | 0.53 | 0.52 |
| 1988 | 1.14 | 0.82 | 0.45 | 0.45 | 0.45 | 0.45 | 0.2 | 0.18 | 0.38 | 0.36 |
| 1987 | 1.25 | 0.94 | 0.5 | 0.5 | 0.5 | 0.5 | 0.18 | 0.19 | 0.45 | 0.43 |
| 1986 | 0.98 | 0.62 | 0.19 | 0.19 | 0.19 | 0.19 | 0.24 | 0.2 | 0.43 | 0.42 |
| 1985 | 1.15 | 0.83 | 0.35 | 0.35 | 0.35 | 0.35 | 0.19 | 0.19 | 0.49 | 0.47 |
| 1984 | 1.17 | 0.86 | 0.44 | 0.44 | 0.44 | 0.44 | 0.2 | 0.19 | 0.43 | 0.42 |
| 1983 | 0.85 | 0.57 | 0.18 | 0.18 | 0.18 | 0.18 | 0.19 | 0.16 | 0.39 | 0.38 |
| 1982 | 1.05 | 0.77 | 0.26 | 0.26 | 0.26 | 0.26 | 0.16 | 0.18 | 0.51 | 0.51 |
| 1981 | 1.23 | 0.97 | 0.31 | 0.3 | 0.3 | 0.3 | 0.14 | 0.17 | 0.68 | 0.67 |
| 1980 | 0.92 | 0.68 | 0.24 | 0.24 | 0.24 | 0.24 | 0.15 | 0.15 | 0.44 | 0.44 |
| 1979 | 0.83 | 0.62 | 0.28 | 0.28 | 0.28 | 0.28 | 0.15 | 0.14 | 0.35 | 0.34 |
| 1978 | 0.9 | 0.69 | 0.13 | 0.13 | 0.13 | 0.13 | 0.15 | 0.14 | 0.56 | 0.55 |
| 1977 | 0.81 | 0.61 | 0.23 | 0.23 | 0.23 | 0.23 | 0.14 | 0.13 | 0.39 | 0.38 |
| 1976 | 0.93 | 0.73 | 0.21 | 0.21 | 0.21 | 0.21 | 0.14 | 0.13 | 0.52 | 0.52 |
| 1975 | 0.75 | 0.57 | 0.15 | 0.15 | 0.15 | 0.15 | 0.13 | 0.12 | 0.42 | 0.42 |
| 1974 | 0.86 | 0.67 | 0.17 | 0.17 | 0.17 | 0.17 | 0.14 | 0.12 | 0.5 | 0.5 |
| 1973 | 0.62 | 0.46 | 0.12 | 0.12 | 0.12 | 0.12 | 0.12 | 0.11 | 0.34 | 0.34 |
| 1972 | 0.7 | 0.54 | 0.11 | 0.11 | 0.11 | 0.11 | 0.13 | 0.11 | 0.43 | 0.42 |
| 1971 | 0.58 | 0.45 | 0.12 | 0.12 | 0.12 | 0.12 | 0.1 | 0.09 | 0.33 | 0.33 |
| 1970 | 0.68 | 0.56 | 0.11 | 0.11 | 0.11 | 0.11 | 0.08 | 0.07 | 0.46 | 0.45 |
| 1969 | 0.57 | 0.46 | 0.11 | 0.11 | 0.11 | 0.11 | 0.08 | 0.06 | 0.35 | 0.35 |
| 1968 | 0.71 | 0.58 | 0.07 | 0.07 | 0.07 | 0.07 | 0.1 | 0.08 | 0.51 | 0.51 |
| 1967 | 0.72 | 0.59 | 0.07 | 0.07 | 0.07 | 0.07 | 0.09 | 0.07 | 0.53 | 0.52 |
| 1966 | 0.61 | 0.51 | 0.08 | 0.08 | 0.08 | 0.08 | 0.06 | 0.05 | 0.44 | 0.44 |
| 1965 | 0.61 | 0.5 | 0.07 | 0.07 | 0.07 | 0.07 | 0.07 | 0.07 | 0.44 | 0.43 |
| 1964 | 0.63 | 0.52 | 0.07 | 0.07 | 0.07 | 0.07 | 0.07 | 0.06 | 0.46 | 0.45 |
| 1963 | 0.58 | 0.47 | 0.05 | 0.05 | 0.05 | 0.05 | 0.07 | 0.07 | 0.42 | 0.42 |
| 1962 | 0.44 | 0.32 | 0.04 | 0.04 | 0.04 | 0.04 | 0.08 | 0.08 | 0.28 | 0.28 |
| 1961 | 0.76 | 0.66 | 0.06 | 0.06 | 0.06 | 0.06 | 0.07 | 0.06 | 0.6 | 0.6 |

Comments