
Abstract
Côte d’Ivoire has consistently led global cocoa bean production, dominating the market with significant output. By 2021, it produced 2.07 million tons, underlining its pivotal role in the industry. Historically, Côte d’Ivoire’s cocoa production has been driven by favorable climatic conditions and expansive farming areas. This trend is supported by its well-established infrastructure and large-scale cultivation practices. The country’s dominance reflects a long-term trend where it has been a major supplier to global markets, significantly influencing cocoa prices and trade dynamics.
Cocoa bean exports (worldwide)
From 1961 to 2021, Côte d’Ivoire has consistently been a leading exporter of cocoa beans, peaking at 2.07 million tons in 2021. This represents 100% of its highest recorded export volume. Over the decades, Côte d’Ivoire’s cocoa industry has expanded due to favorable climate conditions and extensive cultivation areas. The country’s growth is also supported by significant investments in infrastructure and farming techniques. Trends show a steady increase in production, though challenges such as price volatility and sustainability concerns remain crucial factors influencing the sector.
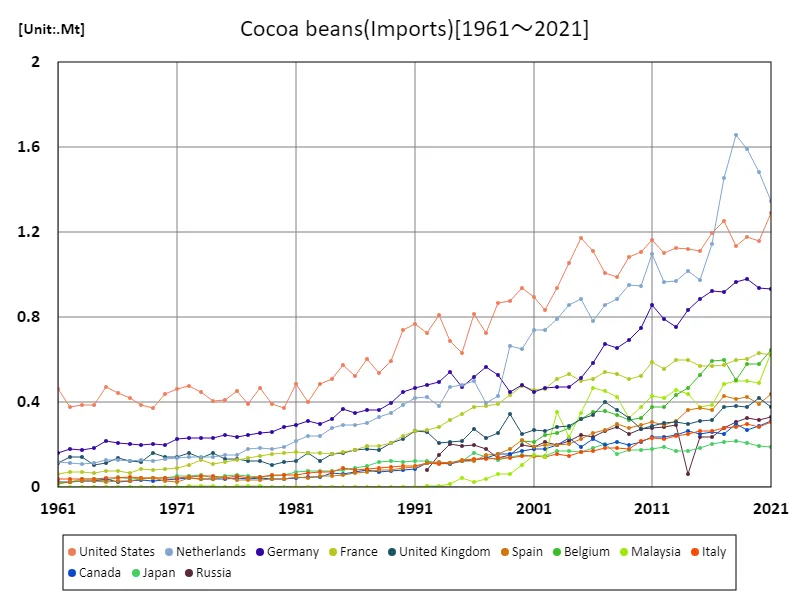
The maximum is 1.66Mt[2018] of Netherlands, and the current value is about 81.3%
Cocoa bean exports (latest year, countries around the world)
In 2021, Côte d’Ivoire emerged as the top global exporter of cocoa beans, with a substantial 2.07 million tons, highlighting its dominant role in the industry. This volume contrasts sharply with the global average export of 66.7 thousand tons and a total global export of 11.7 million tons. The country’s leading position reflects its favorable climate and extensive cultivation practices. Historically, Côte d’Ivoire has been a major supplier, significantly impacting global cocoa markets. Despite this, the industry faces challenges such as fluctuating prices and sustainability issues, influencing future trends.
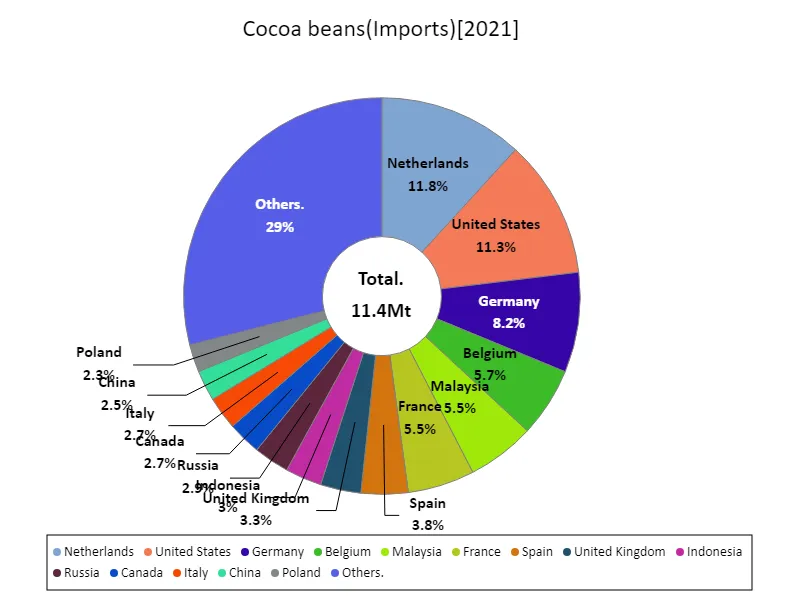
The maximum is 1.35Mt of Netherlands, the average is 62.5kt, and the total is 11.4Mt
Cocoa bean exports (continent)
In 2021, Europe emerged as the top exporter of cocoa beans, reaching 4.92 million tons, the highest recorded volume. This significant figure underscores Europe’s pivotal role in the global cocoa market, driven by robust processing industries and extensive supply chains. Historically, Europe has leveraged its well-established infrastructure and processing capabilities to become a major hub for cocoa distribution. The trend reflects a consistent growth trajectory, supported by strong demand for chocolate products. However, challenges such as supply chain sustainability and price volatility continue to shape the sector.
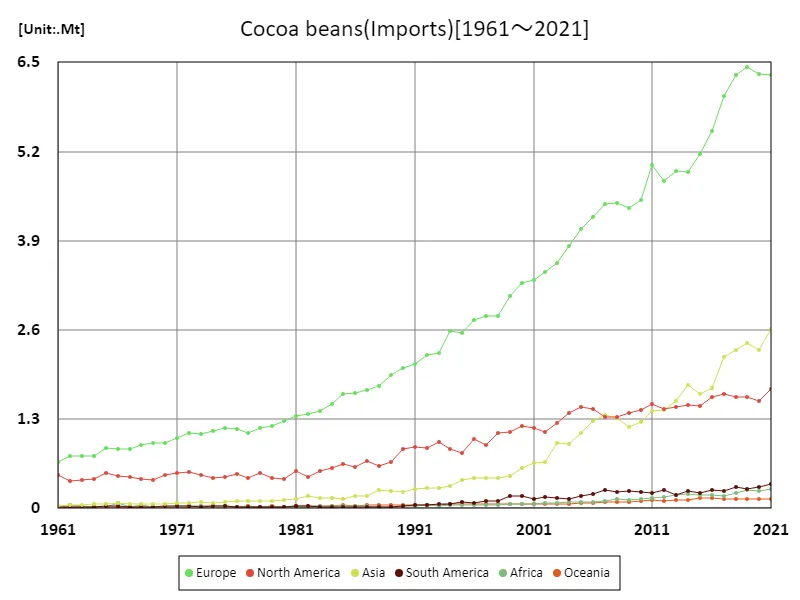
The maximum is 6.43Mt[2019] of Europe, and the current value is about 98.3%
Cocoa bean exports (latest year, continent)
In 2021, Europe led global cocoa bean exports with a substantial 4.92 million tons, far exceeding the average of 1.95 million tons and contributing significantly to the total global export of 11.7 million tons. This dominance reflects Europe’s advanced processing facilities and strong market demand. Historically, Europe’s role as a major cocoa bean exporter has been driven by its robust infrastructure and processing capacity. The consistent high volume highlights the region’s central position in the cocoa supply chain, although it also faces ongoing challenges related to sustainability and market fluctuations.
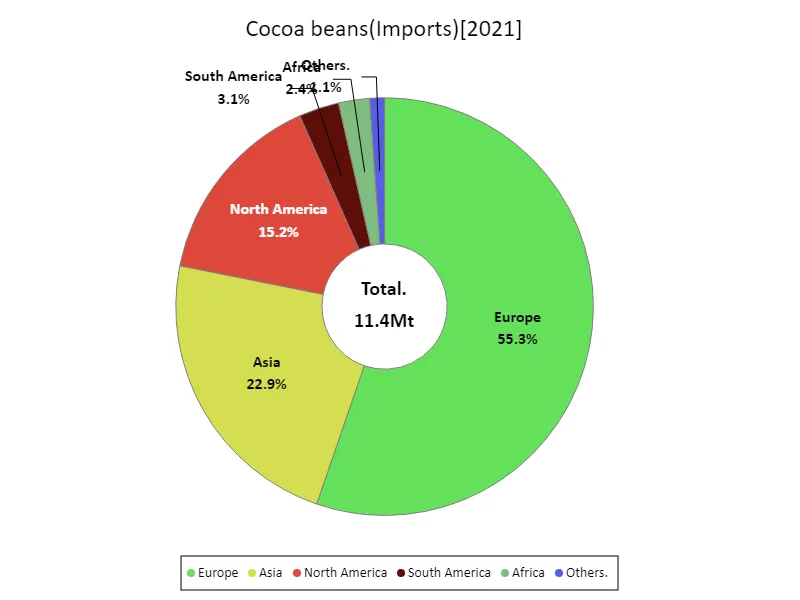
The maximum is 6.32Mt of Europe, the average is 1.91Mt, and the total is 11.4Mt
Main data
| Import and export(Cocoa beans, Imports) [Mt] | ||||||||||
|---|---|---|---|---|---|---|---|---|---|---|
| World | High-income countries | Europe | European Union | Western Europe | Upper-middle-income countries | Asia | Americas | North America | Northern America | |
| 2021 | 11.44 | 8.02 | 6.32 | 5.28 | 3.73 | 2.64 | 2.62 | 2.09 | 1.74 | 1.6 |
| 2020 | 10.89 | 7.87 | 6.32 | 5.28 | 3.81 | 2.31 | 2.31 | 1.87 | 1.56 | 1.45 |
| 2019 | 11.16 | 8.03 | 6.43 | 5.43 | 3.93 | 2.39 | 2.41 | 1.91 | 1.62 | 1.45 |
| 2018 | 10.89 | 7.91 | 6.31 | 5.34 | 3.9 | 2.35 | 2.3 | 1.92 | 1.62 | 1.43 |
| 2017 | 10.45 | 7.74 | 6.01 | 5.1 | 3.7 | 2.15 | 2.2 | 1.92 | 1.67 | 1.5 |
| 2016 | 9.46 | 7.2 | 5.5 | 4.71 | 3.4 | 1.75 | 1.75 | 1.88 | 1.62 | 1.46 |
| 2015 | 8.9 | 6.76 | 5.17 | 4.38 | 3.12 | 1.67 | 1.67 | 1.71 | 1.49 | 1.36 |
| 2014 | 8.79 | 6.63 | 4.91 | 4.28 | 3.07 | 1.64 | 1.79 | 1.76 | 1.51 | 1.39 |
| 2013 | 8.47 | 6.28 | 4.92 | 4.04 | 2.92 | 1.73 | 1.56 | 1.68 | 1.48 | 1.37 |
| 2012 | 8.2 | 6.13 | 4.77 | 3.92 | 2.83 | 1.64 | 1.43 | 1.72 | 1.45 | 1.34 |
| 2011 | 8.44 | 6.41 | 5.01 | 4.16 | 3.07 | 1.58 | 1.42 | 1.74 | 1.51 | 1.4 |
| 2010 | 7.68 | 5.82 | 4.5 | 3.72 | 2.68 | 1.49 | 1.27 | 1.67 | 1.43 | 1.32 |
| 2009 | 7.42 | 5.64 | 4.37 | 3.53 | 2.59 | 1.38 | 1.19 | 1.64 | 1.39 | 1.28 |
| 2008 | 7.55 | 5.58 | 4.44 | 3.51 | 2.52 | 1.55 | 1.32 | 1.56 | 1.33 | 1.21 |
| 2007 | 7.59 | 5.68 | 4.44 | 3.51 | 2.55 | 1.55 | 1.36 | 1.59 | 1.33 | 1.21 |
| 2006 | 7.35 | 5.55 | 4.25 | 3.39 | 2.35 | 1.44 | 1.27 | 1.66 | 1.45 | 1.34 |
| 2005 | 6.98 | 5.34 | 4.07 | 3.22 | 2.34 | 1.27 | 1.1 | 1.66 | 1.47 | 1.37 |
| 2004 | 6.46 | 5.12 | 3.82 | 3.11 | 2.27 | 1.04 | 0.94 | 1.54 | 1.39 | 1.29 |
| 2003 | 6.05 | 4.77 | 3.58 | 2.93 | 2.13 | 1.07 | 0.95 | 1.39 | 1.24 | 1.14 |
| 2002 | 5.54 | 4.46 | 3.44 | 2.8 | 2.01 | 0.83 | 0.68 | 1.28 | 1.11 | 1.02 |
| 2001 | 5.42 | 4.43 | 3.33 | 2.71 | 1.95 | 0.77 | 0.66 | 1.31 | 1.17 | 1.08 |
| 2000 | 5.36 | 4.42 | 3.28 | 2.69 | 1.91 | 0.74 | 0.59 | 1.38 | 1.2 | 1.11 |
| 1999 | 4.98 | 4.07 | 3.1 | 2.47 | 1.79 | 0.61 | 0.48 | 1.29 | 1.12 | 1.04 |
| 1998 | 4.56 | 3.72 | 2.8 | 2.29 | 1.6 | 0.51 | 0.44 | 1.21 | 1.1 | 1.02 |
| 1997 | 4.4 | 3.55 | 2.81 | 2.27 | 1.6 | 0.53 | 0.45 | 1.03 | 0.92 | 0.86 |
| 1996 | 4.39 | 3.63 | 2.75 | 2.18 | 1.6 | 0.5 | 0.44 | 1.09 | 1 | 0.94 |
| 1995 | 3.96 | 3.18 | 2.56 | 2.06 | 1.54 | 0.49 | 0.41 | 0.89 | 0.8 | 0.75 |
| 1994 | 3.94 | 3.22 | 2.58 | 2.08 | 1.57 | 0.46 | 0.33 | 0.94 | 0.87 | 0.8 |
| 1993 | 3.66 | 3.11 | 2.26 | 1.84 | 1.37 | 0.34 | 0.29 | 1.02 | 0.96 | 0.92 |
| 1992 | 3.54 | 3.05 | 2.23 | 1.79 | 1.37 | 0.29 | 0.29 | 0.93 | 0.88 | 0.84 |
| 1991 | 3.4 | 2.96 | 2.11 | 1.67 | 1.34 | 0.28 | 0.28 | 0.94 | 0.89 | 0.86 |
| 1990 | 3.25 | 2.79 | 2.04 | 1.57 | 1.25 | 0.31 | 0.24 | 0.89 | 0.86 | 0.82 |
| 1989 | 2.97 | 2.47 | 1.95 | 1.43 | 1.11 | 0.37 | 0.25 | 0.7 | 0.68 | 0.67 |
| 1988 | 2.76 | 2.33 | 1.79 | 1.36 | 1.03 | 0.32 | 0.27 | 0.64 | 0.62 | 0.61 |
| 1987 | 2.7 | 2.31 | 1.73 | 1.3 | 0.99 | 0.28 | 0.18 | 0.71 | 0.69 | 0.68 |
| 1986 | 2.56 | 2.12 | 1.68 | 1.22 | 0.95 | 0.32 | 0.18 | 0.62 | 0.6 | 0.59 |
| 1985 | 2.55 | 2.14 | 1.66 | 1.23 | 0.96 | 0.29 | 0.14 | 0.67 | 0.64 | 0.64 |
| 1984 | 2.34 | 1.96 | 1.52 | 1.12 | 0.88 | 0.27 | 0.14 | 0.61 | 0.58 | 0.58 |
| 1983 | 2.2 | 1.82 | 1.42 | 1.04 | 0.81 | 0.28 | 0.15 | 0.56 | 0.55 | 0.54 |
| 1982 | 2.1 | 1.74 | 1.38 | 1.02 | 0.83 | 0.25 | 0.18 | 0.49 | 0.46 | 0.45 |
| 1981 | 2.11 | 1.76 | 1.35 | 1.01 | 0.79 | 0.25 | 0.14 | 0.57 | 0.54 | 0.53 |
| 1980 | 1.89 | 1.56 | 1.27 | 0.95 | 0.74 | 0.24 | 0.13 | 0.44 | 0.42 | 0.41 |
| 1979 | 1.81 | 1.51 | 1.2 | 0.89 | 0.69 | 0.23 | 0.11 | 0.46 | 0.44 | 0.43 |
| 1978 | 1.85 | 1.58 | 1.17 | 0.87 | 0.68 | 0.2 | 0.1 | 0.54 | 0.52 | 0.51 |
| 1977 | 1.7 | 1.47 | 1.1 | 0.83 | 0.65 | 0.17 | 0.1 | 0.46 | 0.44 | 0.44 |
| 1976 | 1.82 | 1.52 | 1.16 | 0.82 | 0.61 | 0.24 | 0.1 | 0.53 | 0.5 | 0.5 |
| 1975 | 1.79 | 1.45 | 1.17 | 0.8 | 0.6 | 0.28 | 0.09 | 0.48 | 0.45 | 0.45 |
| 1974 | 1.73 | 1.42 | 1.13 | 0.76 | 0.56 | 0.24 | 0.08 | 0.48 | 0.45 | 0.44 |
| 1973 | 1.75 | 1.48 | 1.09 | 0.77 | 0.59 | 0.2 | 0.09 | 0.52 | 0.49 | 0.49 |
| 1972 | 1.79 | 1.5 | 1.1 | 0.75 | 0.55 | 0.22 | 0.08 | 0.56 | 0.53 | 0.52 |
| 1971 | 1.7 | 1.4 | 1.03 | 0.69 | 0.53 | 0.22 | 0.07 | 0.55 | 0.51 | 0.5 |
| 1970 | 1.57 | 1.32 | 0.95 | 0.63 | 0.49 | 0.19 | 0.06 | 0.51 | 0.48 | 0.48 |
| 1969 | 1.48 | 1.25 | 0.95 | 0.63 | 0.47 | 0.17 | 0.06 | 0.43 | 0.41 | 0.41 |
| 1968 | 1.51 | 1.24 | 0.92 | 0.65 | 0.48 | 0.18 | 0.07 | 0.45 | 0.42 | 0.42 |
| 1967 | 1.45 | 1.24 | 0.86 | 0.61 | 0.45 | 0.15 | 0.07 | 0.48 | 0.45 | 0.45 |
| 1966 | 1.55 | 1.29 | 0.86 | 0.61 | 0.47 | 0.15 | 0.08 | 0.51 | 0.47 | 0.47 |
| 1965 | 1.51 | 1.29 | 0.88 | 0.62 | 0.48 | 0.17 | 0.06 | 0.55 | 0.51 | 0.51 |
| 1964 | 1.3 | 1.13 | 0.76 | 0.54 | 0.42 | 0.13 | 0.06 | 0.45 | 0.42 | 0.42 |
| 1963 | 1.31 | 1.14 | 0.77 | 0.53 | 0.41 | 0.11 | 0.05 | 0.44 | 0.42 | 0.42 |
| 1962 | 1.29 | 1.12 | 0.76 | 0.53 | 0.42 | 0.1 | 0.04 | 0.43 | 0.41 | 0.4 |
| 1961 | 1.26 | 1.14 | 0.67 | 0.48 | 0.4 | 0.07 | 0.03 | 0.51 | 0.49 | 0.49 |


Comments