
Abstract
Portugal’s dominance in wine production per capita in 2021, with 55.2 kg per person, highlights its longstanding winemaking tradition and favorable Mediterranean climate. Historically, Portugal’s wine culture is rooted in regional diversity, including the globally renowned Port and Vinho Verde. Over the past decades, the country has balanced modern viticulture techniques with traditional methods, ensuring high-quality output. The trend of smaller producers embracing innovation while maintaining artisanal approaches has boosted global demand. Portugal’s aging population and stable consumption patterns sustain its domestic market, while exports thrive due to growing international acclaim for its diverse wine portfolio.
Domestic wine supply/population (worldwide)
From 1961 to 2021, global wine production per capita has shown significant shifts, reflecting cultural, economic, and agricultural changes. France’s peak in 1974 at 154 kg per capita marked the height of its wine dominance, fueled by strong domestic consumption and global prestige. However, by 2021, production had fallen to 27.1% of its peak, driven by changing consumption habits, competition from emerging wine regions, and urbanization reducing vineyard space. Globally, traditional producers like Italy, Spain, and Portugal have also adapted, focusing on quality and exports. Meanwhile, new world producers like the U.S. and Australia have risen, reshaping wine production and consumption trends.
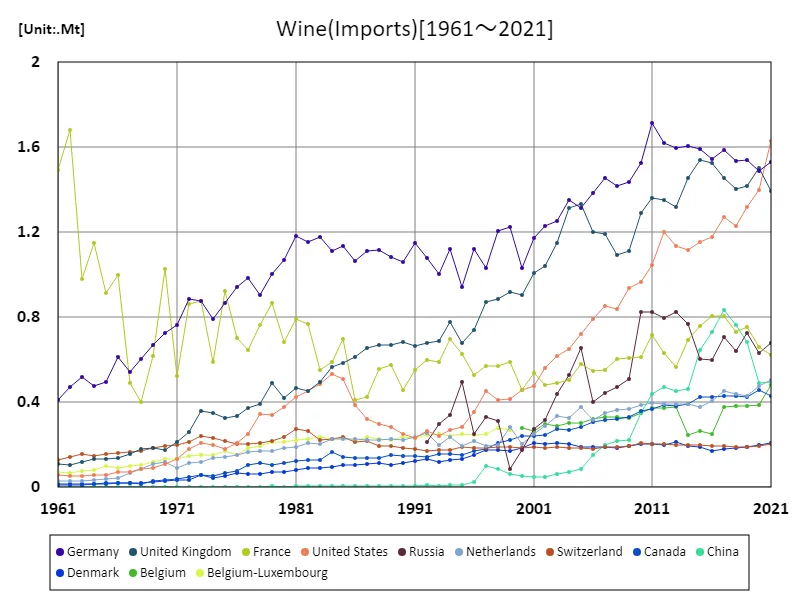
The maximum is 1.72Mt[2011] of Germany, and the current value is about 89.4%
Domestic wine supply/population (latest year, world)
In 2021, Luxembourg led global wine production per capita at 72 kg, far surpassing the global average of 6.22 kg. This reflects the country’s small population and a strong focus on high-quality, localized viticulture. Over time, global per capita wine supply has stabilized, with traditional European producers maintaining dominance but seeing reductions due to changing consumer habits and environmental pressures. Meanwhile, wine regions in the New World, like the Americas and Oceania, have increased production, catering to growing international demand. The global trend now emphasizes sustainability, innovation, and diversification to adapt to evolving market preferences and climate challenges.
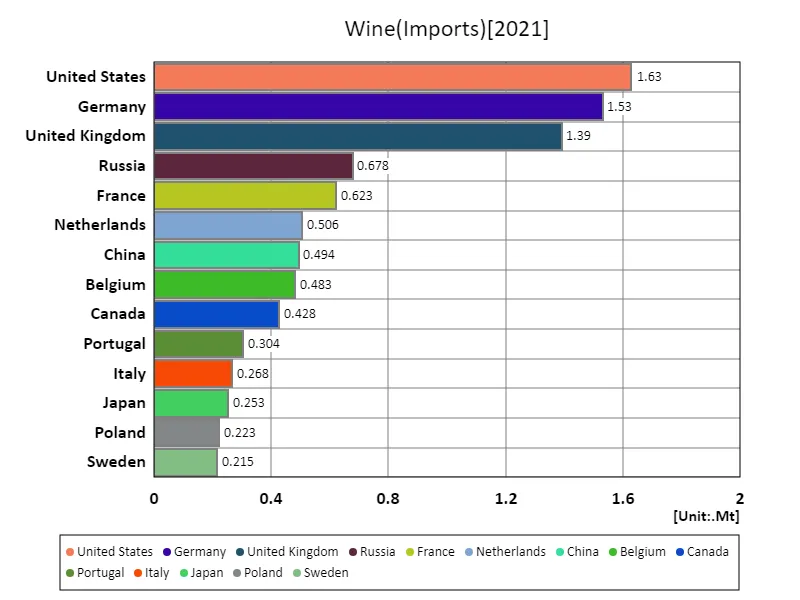
The maximum is 1.63Mt of United States, the average is 66.5kt, and the total is 12Mt
Domestic wine supply/population (continent)
In 2021, Europe led the world in per capita wine supply, averaging 36.6 kg, underscoring its historical and cultural ties to viticulture. This dominance is driven by traditional producers like Italy, France, and Spain, which combine favorable climates, diverse wine varieties, and deep-rooted consumption habits. However, per capita wine production has gradually declined due to changing lifestyles, aging populations, and urbanization reducing vineyard areas. Globally, emerging wine markets outside Europe have gained traction, driven by export growth and shifting preferences toward premium wines. The industry increasingly emphasizes sustainability and innovation to meet modern consumer demands and climate challenges.
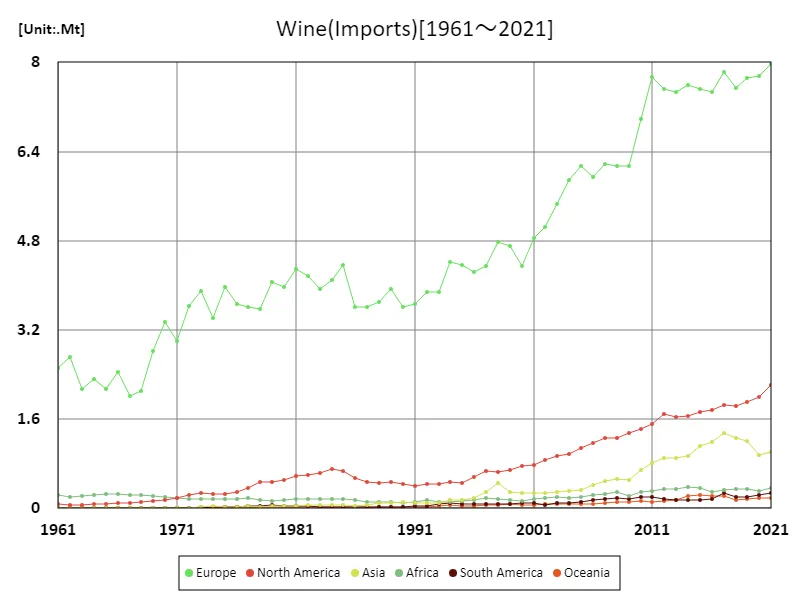
The maximum is the latest one, 7.97Mt of Europe
Domestic wine supply/population (latest year, continent)
In 2021, Europe maintained its leadership in per capita wine supply, with a maximum of 21.3 kg and an average of 8.97 kg, reflecting its long-standing viticultural traditions and cultural integration of wine. The total supply of 53.8 kg highlights the region’s dominance in global production. While Europe’s wine industry remains robust, trends show a decline in per capita production due to changing consumption patterns, demographic shifts, and competition from New World producers. Globally, demand for diverse and premium wines is rising, prompting innovation and sustainability initiatives to address climate challenges and evolving market preferences.
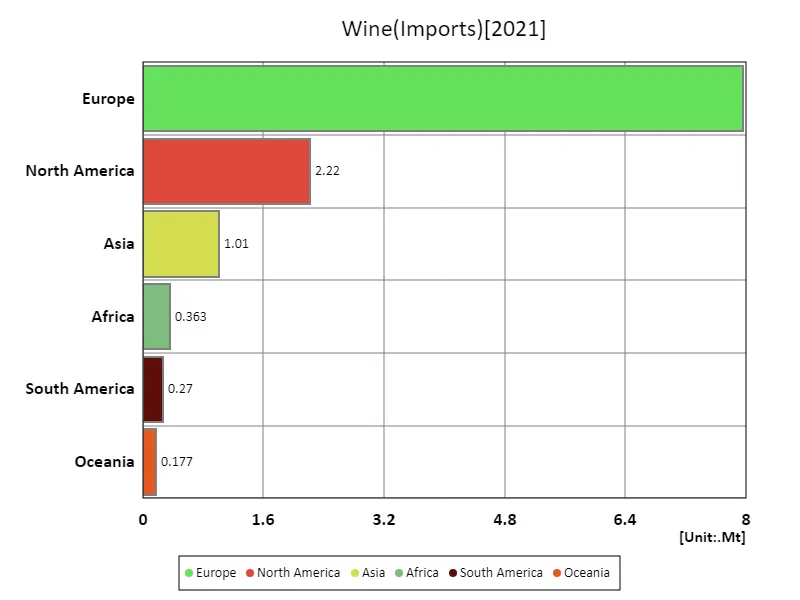
The maximum is 7.97Mt of Europe, the average is 2Mt, and the total is 12Mt
Main data
| Import and export(Wine, Imports) [Mt] | ||||||||||
|---|---|---|---|---|---|---|---|---|---|---|
| World | High-income countries | Europe | European Union | Western Europe | Americas | Northern Europe | North America | Northern America | Upper-middle-income countries | |
| 2021 | 12 | 9.82 | 7.97 | 5.39 | 3.48 | 2.49 | 2.36 | 2.22 | 2.06 | 1.74 |
| 2020 | 11.45 | 9.46 | 7.76 | 5.14 | 3.33 | 2.23 | 2.51 | 1.99 | 1.86 | 1.63 |
| 2019 | 11.54 | 9.23 | 7.72 | 5.14 | 3.42 | 2.11 | 2.34 | 1.91 | 1.74 | 1.95 |
| 2018 | 11.34 | 9.04 | 7.54 | 5.07 | 3.4 | 2.03 | 2.31 | 1.83 | 1.66 | 1.94 |
| 2017 | 11.87 | 9.41 | 7.83 | 5.24 | 3.56 | 2.14 | 2.37 | 1.86 | 1.7 | 2.1 |
| 2016 | 11.09 | 9.02 | 7.46 | 4.92 | 3.34 | 1.93 | 2.41 | 1.76 | 1.6 | 1.75 |
| 2015 | 11.12 | 9.11 | 7.53 | 4.98 | 3.31 | 1.87 | 2.39 | 1.72 | 1.58 | 1.64 |
| 2014 | 10.93 | 8.9 | 7.59 | 4.94 | 3.27 | 1.8 | 2.37 | 1.65 | 1.51 | 1.63 |
| 2013 | 10.64 | 8.59 | 7.48 | 4.9 | 3.24 | 1.78 | 2.18 | 1.64 | 1.52 | 1.65 |
| 2012 | 10.77 | 8.71 | 7.52 | 4.94 | 3.33 | 1.87 | 2.19 | 1.69 | 1.59 | 1.65 |
| 2011 | 10.66 | 8.63 | 7.73 | 5.1 | 3.52 | 1.71 | 2.17 | 1.51 | 1.41 | 1.62 |
| 2010 | 9.73 | 7.84 | 6.98 | 4.47 | 3.19 | 1.64 | 2.03 | 1.43 | 1.33 | 1.56 |
| 2009 | 8.51 | 7.19 | 6.14 | 4.14 | 3.02 | 1.53 | 1.77 | 1.36 | 1.27 | 1.05 |
| 2008 | 8.51 | 7.09 | 6.13 | 4.16 | 2.99 | 1.44 | 1.71 | 1.26 | 1.17 | 1.06 |
| 2007 | 8.44 | 7.1 | 6.17 | 4.11 | 2.98 | 1.43 | 1.81 | 1.26 | 1.17 | 1.01 |
| 2006 | 8.01 | 6.81 | 5.94 | 3.93 | 2.85 | 1.33 | 1.81 | 1.18 | 1.1 | 0.91 |
| 2005 | 7.94 | 6.69 | 6.14 | 3.77 | 2.85 | 1.19 | 1.89 | 1.08 | 1.01 | 1.01 |
| 2004 | 7.54 | 6.49 | 5.89 | 3.69 | 2.75 | 1.08 | 1.89 | 0.98 | 0.92 | 0.83 |
| 2003 | 7.05 | 6.13 | 5.46 | 3.53 | 2.63 | 1.03 | 1.75 | 0.95 | 0.89 | 0.71 |
| 2002 | 6.51 | 5.74 | 5.04 | 3.36 | 2.56 | 0.94 | 1.61 | 0.87 | 0.81 | 0.56 |
| 2001 | 6.22 | 5.54 | 4.85 | 3.26 | 2.5 | 0.87 | 1.55 | 0.78 | 0.72 | 0.5 |
| 2000 | 5.67 | 5.11 | 4.35 | 3 | 2.23 | 0.85 | 1.39 | 0.75 | 0.7 | 0.41 |
| 1999 | 5.97 | 5.25 | 4.7 | 3.42 | 2.61 | 0.77 | 1.39 | 0.68 | 0.64 | 0.31 |
| 1998 | 6.19 | 5.12 | 4.77 | 3.24 | 2.51 | 0.73 | 1.34 | 0.65 | 0.62 | 0.59 |
| 1997 | 5.64 | 4.6 | 4.35 | 2.84 | 2.3 | 0.75 | 1.3 | 0.67 | 0.64 | 0.59 |
| 1996 | 5.23 | 4.36 | 4.23 | 2.94 | 2.33 | 0.63 | 1.15 | 0.55 | 0.53 | 0.45 |
| 1995 | 5.23 | 4.12 | 4.36 | 2.89 | 2.23 | 0.53 | 1.03 | 0.46 | 0.44 | 0.7 |
| 1994 | 5.3 | 4.35 | 4.41 | 3.03 | 2.49 | 0.57 | 1.14 | 0.47 | 0.43 | 0.57 |
| 1993 | 4.62 | 3.77 | 3.87 | 2.62 | 2.24 | 0.5 | 1 | 0.43 | 0.4 | 0.48 |
| 1992 | 4.61 | 3.89 | 3.87 | 2.74 | 2.37 | 0.48 | 1 | 0.44 | 0.41 | 0.33 |
| 1991 | 4.35 | 3.78 | 3.67 | 2.64 | 2.38 | 0.44 | 0.96 | 0.4 | 0.38 | 0.24 |
| 1990 | 4.31 | 3.69 | 3.61 | 2.5 | 2.19 | 0.46 | 0.98 | 0.44 | 0.4 | 0.29 |
| 1989 | 4.67 | 4.02 | 3.94 | 2.78 | 2.33 | 0.49 | 0.96 | 0.46 | 0.44 | 0.32 |
| 1988 | 4.41 | 3.8 | 3.7 | 2.59 | 2.36 | 0.49 | 0.94 | 0.46 | 0.44 | 0.28 |
| 1987 | 4.32 | 3.69 | 3.61 | 2.49 | 2.25 | 0.5 | 0.92 | 0.48 | 0.46 | 0.28 |
| 1986 | 4.39 | 3.67 | 3.61 | 2.44 | 2.16 | 0.57 | 0.87 | 0.54 | 0.53 | 0.37 |
| 1985 | 5.31 | 4.13 | 4.36 | 2.79 | 2.56 | 0.69 | 0.83 | 0.67 | 0.65 | 0.79 |
| 1984 | 5.08 | 3.89 | 4.09 | 2.52 | 2.41 | 0.74 | 0.8 | 0.71 | 0.7 | 0.82 |
| 1983 | 4.82 | 3.72 | 3.93 | 2.53 | 2.42 | 0.65 | 0.73 | 0.63 | 0.62 | 0.72 |
| 1982 | 5.04 | 3.87 | 4.16 | 2.73 | 2.66 | 0.63 | 0.66 | 0.6 | 0.58 | 0.79 |
| 1981 | 5.15 | 3.86 | 4.29 | 2.72 | 2.69 | 0.62 | 0.67 | 0.58 | 0.55 | 0.91 |
| 1980 | 4.75 | 3.47 | 3.98 | 2.46 | 2.41 | 0.56 | 0.61 | 0.52 | 0.5 | 0.93 |
| 1979 | 4.77 | 3.63 | 4.07 | 2.62 | 2.5 | 0.52 | 0.68 | 0.47 | 0.45 | 0.81 |
| 1978 | 4.3 | 3.26 | 3.58 | 2.34 | 2.27 | 0.52 | 0.56 | 0.47 | 0.46 | 0.71 |
| 1977 | 4.25 | 3.15 | 3.62 | 2.36 | 2.22 | 0.41 | 0.56 | 0.37 | 0.35 | 0.76 |
| 1976 | 4.19 | 2.99 | 3.66 | 2.29 | 2.2 | 0.33 | 0.5 | 0.3 | 0.29 | 0.9 |
| 1975 | 4.44 | 3.1 | 3.96 | 2.46 | 2.41 | 0.28 | 0.49 | 0.25 | 0.25 | 1.02 |
| 1974 | 3.92 | 2.74 | 3.41 | 2 | 1.96 | 0.28 | 0.49 | 0.26 | 0.25 | 0.87 |
| 1973 | 4.39 | 3.3 | 3.89 | 2.55 | 2.33 | 0.29 | 0.5 | 0.28 | 0.27 | 0.78 |
| 1972 | 4.07 | 2.89 | 3.62 | 2.32 | 2.27 | 0.25 | 0.39 | 0.24 | 0.23 | 0.86 |
| 1971 | 3.39 | 2.24 | 2.99 | 1.76 | 1.74 | 0.19 | 0.33 | 0.18 | 0.17 | 0.85 |
| 1970 | 3.73 | 2.59 | 3.34 | 2.19 | 2.22 | 0.16 | 0.28 | 0.15 | 0.14 | 0.81 |
| 1969 | 3.2 | 2.08 | 2.82 | 1.7 | 1.72 | 0.14 | 0.28 | 0.13 | 0.12 | 0.78 |
| 1968 | 2.49 | 1.76 | 2.1 | 1.41 | 1.41 | 0.12 | 0.27 | 0.11 | 0.1 | 0.38 |
| 1967 | 2.38 | 1.76 | 2.02 | 1.42 | 1.41 | 0.11 | 0.23 | 0.1 | 0.09 | 0.29 |
| 1966 | 2.83 | 2.25 | 2.45 | 1.93 | 1.96 | 0.1 | 0.21 | 0.09 | 0.09 | 0.23 |
| 1965 | 2.49 | 1.95 | 2.14 | 1.67 | 1.74 | 0.08 | 0.2 | 0.08 | 0.07 | 0.2 |
| 1964 | 2.66 | 2.16 | 2.32 | 1.87 | 1.92 | 0.08 | 0.2 | 0.08 | 0.07 | 0.18 |
| 1963 | 2.45 | 2.02 | 2.15 | 1.75 | 1.81 | 0.07 | 0.18 | 0.07 | 0.06 | 0.13 |
| 1962 | 3.01 | 2.62 | 2.71 | 2.37 | 2.43 | 0.07 | 0.16 | 0.07 | 0.06 | 0.11 |
| 1961 | 2.85 | 2.41 | 2.52 | 2.16 | 2.19 | 0.08 | 0.17 | 0.07 | 0.07 | 0.13 |


Comments