
Abstract
Global cocoa bean trade is primarily dependent on transactions between producing and consuming countries. The main producers of cocoa beans are in West Africa, particularly Côte d’Ivoire, Ghana and Nigeria, which account for the majority of total production. On the other hand, consuming countries are concentrated in Europe and North America, and countries with thriving chocolate industries in particular are major importing countries. The latest 2021 data shows that the Netherlands is the largest importer of cocoa beans, importing 1.35 million tonnes (Mt). Due to its geographical location and logistical convenience, the Netherlands has become an important hub for the collection, processing and re-export of large amounts of cocoa beans. The cocoa bean processing industry is well developed and the Netherlands is known as a large manufacturing base for cocoa products. Historically, European countries have been large importers of cocoa beans, with Belgium and Germany being particularly important importers. We are also seeing growth in the Asian market, with countries such as China and India increasing their consumption of cocoa products. This trend is closely linked to the increase in chocolate consumption globally and changing eating habits. Overall, cocoa bean trade is subject to economic and geopolitical influences due to the regional distribution of production and consumption, and will continue to require adjustments in response to market changes and consumption trends.
Cocoa bean imports (worldwide)
Looking back at cocoa bean import data from 1961 to 2021, the Netherlands stands out as the largest importer for many years. In particular, imports reached a record high of 1.66 million tonnes (Mt) in 2018. Dutch imports that year reflect the concentration of cocoa processing in Europe and its position as an international trade centre. However, recent data shows that Dutch imports have fallen to 81.3% of their peak level. This is due to a few factors. First, changes in demand for cocoa beans and diversifying consumer preferences are having an impact. Fluctuations in the cocoa supply chain and price fluctuations also affect import volumes. In addition, countries outside the Netherlands, especially Asian markets and other European countries, are importing more cocoa beans, which may also contribute to the decline in the Netherlands’ import share. Overall, cocoa bean trade is sensitive to economic fluctuations and market trends in producing and consuming countries, as well as in major importing countries such as the Netherlands. Cocoa bean trade patterns will continue to change in the future in response to changes in international economic conditions and consumer needs.
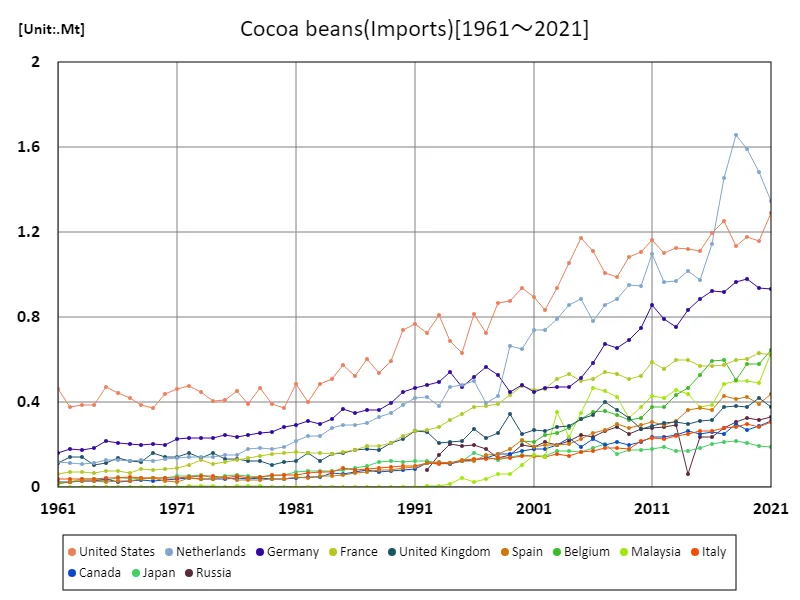
The maximum is 1.66Mt[2018] of Netherlands, and the current value is about 81.3%
Cocoa bean imports (latest year, countries around the world)
In international cocoa bean trade, several notable features and trends emerge from the 2021 data. Overall cocoa bean imports reached 11.4 million tonnes (Mt), indicating that cocoa consumption remains high. The Netherlands is the largest importer, importing 1.35 million tonnes, a significant amount in terms of overall imports. The Netherlands’ geographical location and strong cocoa processing industry make it a major hub in the global cocoa bean market. The overall average import volume was 62.2 thousand tonnes (kt), indicating that many countries import cocoa beans within this range. This reflects widespread demand for cocoa beans, particularly in countries with thriving chocolate industries and in regions with developed cocoa product processing industries. Past trends show that while cocoa bean consumption is increasing, changes in producing countries and unstable supply due to climate change are affecting import volumes. Additionally, while the Netherlands is a particularly important player among European countries, the Asian market is also showing notable growth, and increasing demand in emerging markets is attracting attention. Cocoa bean trade will continue to fluctuate in response to changes in global economic conditions and consumer preferences.
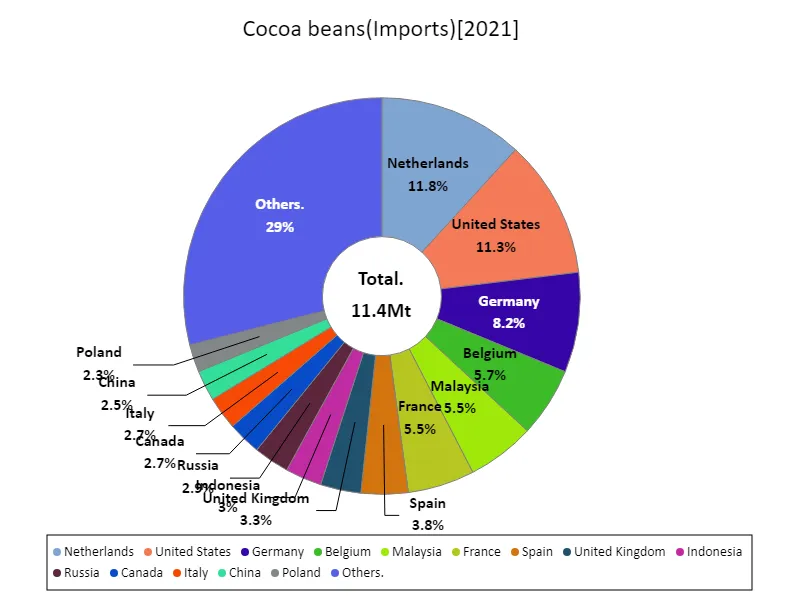
The maximum is 1.35Mt of Netherlands, the average is 62.5kt, and the total is 11.4Mt
Cocoa bean imports (continent)
Based on international cocoa bean trade data for 2021, looking at the characteristics and trends of cocoa bean import volumes, we can see that Europe remains the leading importing region. Europe’s total cocoa bean imports reached 6.43 million tonnes (Mt), the highest figure recorded to date. This import volume shows that Europe is a significant player in the global cocoa bean market. The increase in demand for cocoa beans in Europe is mainly due to the development of the chocolate industry. Countries such as Belgium, Switzerland, and France in particular are known for producing high-quality chocolate, and demand from these countries is driving up overall import volumes. Additionally, Europe plays a key role in the processing and commercialization of cocoa beans, resulting in large imports of these beans. Historically, cocoa bean imports into Europe have remained stable and high, rising in line with economic growth and increased consumption. In addition, cocoa bean import volumes are sensitive to changes in the global supply chain and price fluctuations, and can also be affected by climate change and problems in producing countries. Overall, Europe’s status as the largest cocoa bean importer reflects the strength of its chocolate market demand and processing industry, and the region is likely to continue to play a central role in global cocoa bean trade.
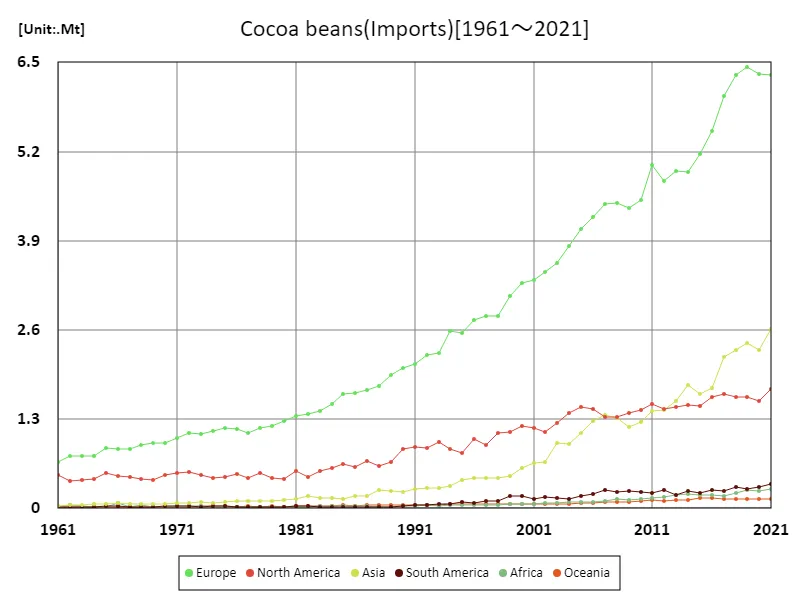
The maximum is 6.43Mt[2019] of Europe, and the current value is about 98.3%
Cocoa bean imports (latest year, continent)
Based on international cocoa bean trade data for 2021, notable features and trends in cocoa bean import volumes emerge. Overall cocoa bean imports reached 11.4 million tonnes (Mt), indicating high global demand for cocoa. Europe was the largest importing region, accounting for 6.32 million tonnes. This volume reflects the strength of Europe’s chocolate industry and its role as a centre for the processing and consumption of cocoa beans. Europe’s cocoa bean imports have been consistently high compared to historical data, accounting for approximately 56% of the total. In this region, countries such as Belgium, Switzerland and France are major consumers of cocoa beans, contributing to the production of high-quality chocolate products. In comparison, the average import volume was 1.91 million tonnes, highlighting Europe’s extremely high import volumes. Overall, cocoa bean imports are concentrated primarily in chocolate-producing countries and are directly influenced by their economic growth and consumption trends. Cocoa bean import volumes will continue to fluctuate in the future depending on fluctuations in global supply chains and changes in market demand, but major importing regions such as Europe are likely to continue to play an important role.
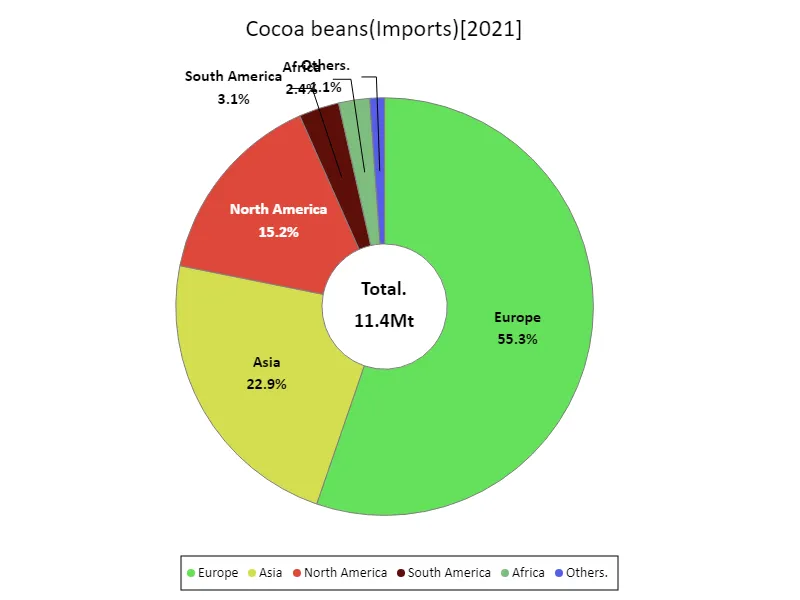
The maximum is 6.32Mt of Europe, the average is 1.91Mt, and the total is 11.4Mt
Main data
| Import and export(Cocoa beans, Imports) [Mt] | ||||||||||
|---|---|---|---|---|---|---|---|---|---|---|
| World | High-income countries | Europe | European Union | Western Europe | Upper-middle-income countries | Asia | Americas | North America | Northern America | |
| 2021 | 11.44 | 8.02 | 6.32 | 5.28 | 3.73 | 2.64 | 2.62 | 2.09 | 1.74 | 1.6 |
| 2020 | 10.89 | 7.87 | 6.32 | 5.28 | 3.81 | 2.31 | 2.31 | 1.87 | 1.56 | 1.45 |
| 2019 | 11.16 | 8.03 | 6.43 | 5.43 | 3.93 | 2.39 | 2.41 | 1.91 | 1.62 | 1.45 |
| 2018 | 10.89 | 7.91 | 6.31 | 5.34 | 3.9 | 2.35 | 2.3 | 1.92 | 1.62 | 1.43 |
| 2017 | 10.45 | 7.74 | 6.01 | 5.1 | 3.7 | 2.15 | 2.2 | 1.92 | 1.67 | 1.5 |
| 2016 | 9.46 | 7.2 | 5.5 | 4.71 | 3.4 | 1.75 | 1.75 | 1.88 | 1.62 | 1.46 |
| 2015 | 8.9 | 6.76 | 5.17 | 4.38 | 3.12 | 1.67 | 1.67 | 1.71 | 1.49 | 1.36 |
| 2014 | 8.79 | 6.63 | 4.91 | 4.28 | 3.07 | 1.64 | 1.79 | 1.76 | 1.51 | 1.39 |
| 2013 | 8.47 | 6.28 | 4.92 | 4.04 | 2.92 | 1.73 | 1.56 | 1.68 | 1.48 | 1.37 |
| 2012 | 8.2 | 6.13 | 4.77 | 3.92 | 2.83 | 1.64 | 1.43 | 1.72 | 1.45 | 1.34 |
| 2011 | 8.44 | 6.41 | 5.01 | 4.16 | 3.07 | 1.58 | 1.42 | 1.74 | 1.51 | 1.4 |
| 2010 | 7.68 | 5.82 | 4.5 | 3.72 | 2.68 | 1.49 | 1.27 | 1.67 | 1.43 | 1.32 |
| 2009 | 7.42 | 5.64 | 4.37 | 3.53 | 2.59 | 1.38 | 1.19 | 1.64 | 1.39 | 1.28 |
| 2008 | 7.55 | 5.58 | 4.44 | 3.51 | 2.52 | 1.55 | 1.32 | 1.56 | 1.33 | 1.21 |
| 2007 | 7.59 | 5.68 | 4.44 | 3.51 | 2.55 | 1.55 | 1.36 | 1.59 | 1.33 | 1.21 |
| 2006 | 7.35 | 5.55 | 4.25 | 3.39 | 2.35 | 1.44 | 1.27 | 1.66 | 1.45 | 1.34 |
| 2005 | 6.98 | 5.34 | 4.07 | 3.22 | 2.34 | 1.27 | 1.1 | 1.66 | 1.47 | 1.37 |
| 2004 | 6.46 | 5.12 | 3.82 | 3.11 | 2.27 | 1.04 | 0.94 | 1.54 | 1.39 | 1.29 |
| 2003 | 6.05 | 4.77 | 3.58 | 2.93 | 2.13 | 1.07 | 0.95 | 1.39 | 1.24 | 1.14 |
| 2002 | 5.54 | 4.46 | 3.44 | 2.8 | 2.01 | 0.83 | 0.68 | 1.28 | 1.11 | 1.02 |
| 2001 | 5.42 | 4.43 | 3.33 | 2.71 | 1.95 | 0.77 | 0.66 | 1.31 | 1.17 | 1.08 |
| 2000 | 5.36 | 4.42 | 3.28 | 2.69 | 1.91 | 0.74 | 0.59 | 1.38 | 1.2 | 1.11 |
| 1999 | 4.98 | 4.07 | 3.1 | 2.47 | 1.79 | 0.61 | 0.48 | 1.29 | 1.12 | 1.04 |
| 1998 | 4.56 | 3.72 | 2.8 | 2.29 | 1.6 | 0.51 | 0.44 | 1.21 | 1.1 | 1.02 |
| 1997 | 4.4 | 3.55 | 2.81 | 2.27 | 1.6 | 0.53 | 0.45 | 1.03 | 0.92 | 0.86 |
| 1996 | 4.39 | 3.63 | 2.75 | 2.18 | 1.6 | 0.5 | 0.44 | 1.09 | 1 | 0.94 |
| 1995 | 3.96 | 3.18 | 2.56 | 2.06 | 1.54 | 0.49 | 0.41 | 0.89 | 0.8 | 0.75 |
| 1994 | 3.94 | 3.22 | 2.58 | 2.08 | 1.57 | 0.46 | 0.33 | 0.94 | 0.87 | 0.8 |
| 1993 | 3.66 | 3.11 | 2.26 | 1.84 | 1.37 | 0.34 | 0.29 | 1.02 | 0.96 | 0.92 |
| 1992 | 3.54 | 3.05 | 2.23 | 1.79 | 1.37 | 0.29 | 0.29 | 0.93 | 0.88 | 0.84 |
| 1991 | 3.4 | 2.96 | 2.11 | 1.67 | 1.34 | 0.28 | 0.28 | 0.94 | 0.89 | 0.86 |
| 1990 | 3.25 | 2.79 | 2.04 | 1.57 | 1.25 | 0.31 | 0.24 | 0.89 | 0.86 | 0.82 |
| 1989 | 2.97 | 2.47 | 1.95 | 1.43 | 1.11 | 0.37 | 0.25 | 0.7 | 0.68 | 0.67 |
| 1988 | 2.76 | 2.33 | 1.79 | 1.36 | 1.03 | 0.32 | 0.27 | 0.64 | 0.62 | 0.61 |
| 1987 | 2.7 | 2.31 | 1.73 | 1.3 | 0.99 | 0.28 | 0.18 | 0.71 | 0.69 | 0.68 |
| 1986 | 2.56 | 2.12 | 1.68 | 1.22 | 0.95 | 0.32 | 0.18 | 0.62 | 0.6 | 0.59 |
| 1985 | 2.55 | 2.14 | 1.66 | 1.23 | 0.96 | 0.29 | 0.14 | 0.67 | 0.64 | 0.64 |
| 1984 | 2.34 | 1.96 | 1.52 | 1.12 | 0.88 | 0.27 | 0.14 | 0.61 | 0.58 | 0.58 |
| 1983 | 2.2 | 1.82 | 1.42 | 1.04 | 0.81 | 0.28 | 0.15 | 0.56 | 0.55 | 0.54 |
| 1982 | 2.1 | 1.74 | 1.38 | 1.02 | 0.83 | 0.25 | 0.18 | 0.49 | 0.46 | 0.45 |
| 1981 | 2.11 | 1.76 | 1.35 | 1.01 | 0.79 | 0.25 | 0.14 | 0.57 | 0.54 | 0.53 |
| 1980 | 1.89 | 1.56 | 1.27 | 0.95 | 0.74 | 0.24 | 0.13 | 0.44 | 0.42 | 0.41 |
| 1979 | 1.81 | 1.51 | 1.2 | 0.89 | 0.69 | 0.23 | 0.11 | 0.46 | 0.44 | 0.43 |
| 1978 | 1.85 | 1.58 | 1.17 | 0.87 | 0.68 | 0.2 | 0.1 | 0.54 | 0.52 | 0.51 |
| 1977 | 1.7 | 1.47 | 1.1 | 0.83 | 0.65 | 0.17 | 0.1 | 0.46 | 0.44 | 0.44 |
| 1976 | 1.82 | 1.52 | 1.16 | 0.82 | 0.61 | 0.24 | 0.1 | 0.53 | 0.5 | 0.5 |
| 1975 | 1.79 | 1.45 | 1.17 | 0.8 | 0.6 | 0.28 | 0.09 | 0.48 | 0.45 | 0.45 |
| 1974 | 1.73 | 1.42 | 1.13 | 0.76 | 0.56 | 0.24 | 0.08 | 0.48 | 0.45 | 0.44 |
| 1973 | 1.75 | 1.48 | 1.09 | 0.77 | 0.59 | 0.2 | 0.09 | 0.52 | 0.49 | 0.49 |
| 1972 | 1.79 | 1.5 | 1.1 | 0.75 | 0.55 | 0.22 | 0.08 | 0.56 | 0.53 | 0.52 |
| 1971 | 1.7 | 1.4 | 1.03 | 0.69 | 0.53 | 0.22 | 0.07 | 0.55 | 0.51 | 0.5 |
| 1970 | 1.57 | 1.32 | 0.95 | 0.63 | 0.49 | 0.19 | 0.06 | 0.51 | 0.48 | 0.48 |
| 1969 | 1.48 | 1.25 | 0.95 | 0.63 | 0.47 | 0.17 | 0.06 | 0.43 | 0.41 | 0.41 |
| 1968 | 1.51 | 1.24 | 0.92 | 0.65 | 0.48 | 0.18 | 0.07 | 0.45 | 0.42 | 0.42 |
| 1967 | 1.45 | 1.24 | 0.86 | 0.61 | 0.45 | 0.15 | 0.07 | 0.48 | 0.45 | 0.45 |
| 1966 | 1.55 | 1.29 | 0.86 | 0.61 | 0.47 | 0.15 | 0.08 | 0.51 | 0.47 | 0.47 |
| 1965 | 1.51 | 1.29 | 0.88 | 0.62 | 0.48 | 0.17 | 0.06 | 0.55 | 0.51 | 0.51 |
| 1964 | 1.3 | 1.13 | 0.76 | 0.54 | 0.42 | 0.13 | 0.06 | 0.45 | 0.42 | 0.42 |
| 1963 | 1.31 | 1.14 | 0.77 | 0.53 | 0.41 | 0.11 | 0.05 | 0.44 | 0.42 | 0.42 |
| 1962 | 1.29 | 1.12 | 0.76 | 0.53 | 0.42 | 0.1 | 0.04 | 0.43 | 0.41 | 0.4 |
| 1961 | 1.26 | 1.14 | 0.67 | 0.48 | 0.4 | 0.07 | 0.03 | 0.51 | 0.49 | 0.49 |


Comments