
Abstract
The global egg industry has seen steady growth over the past few decades, driven by rising demand in both developed and developing countries. China, as the world’s largest egg producer, has also emerged as a top exporter, producing 34.6 million metric tons in 2021. This dominance is partly due to China’s large-scale farms and strong domestic demand, supported by traditional dietary preferences and increasing protein consumption. Historically, the U.S., India, and Japan have also contributed significantly to global egg production, focusing largely on satisfying domestic needs. In recent years, European countries have prioritized welfare standards, such as cage-free production, which influences both cost and supply dynamics. The industry faces challenges like disease outbreaks (e.g., avian influenza) and fluctuating feed costs, yet it continues to grow, fueled by rising global protein demand and a shift toward versatile, affordable animal proteins like eggs.
Domestic egg supply (around the world)
Global egg production has grown consistently since the 1960s, reflecting expanding populations and rising protein demand worldwide. China leads as the largest producer, hitting a peak of 35.2 million metric tons in 2020 and sustaining near-peak levels at 98.3% in 2021. China’s dominance in egg production results from its large-scale farming, technological advances, and strong domestic consumption, driven by eggs’ affordability and dietary role. Over time, production growth in countries like the U.S., India, and Brazil has followed similar trends, focusing on domestic needs rather than exports. Meanwhile, Europe has increasingly shifted toward cage-free systems due to welfare standards, impacting supply and costs. Globally, disease control, feed costs, and evolving consumer demands for sustainable production continue to shape the industry’s trends and challenges.
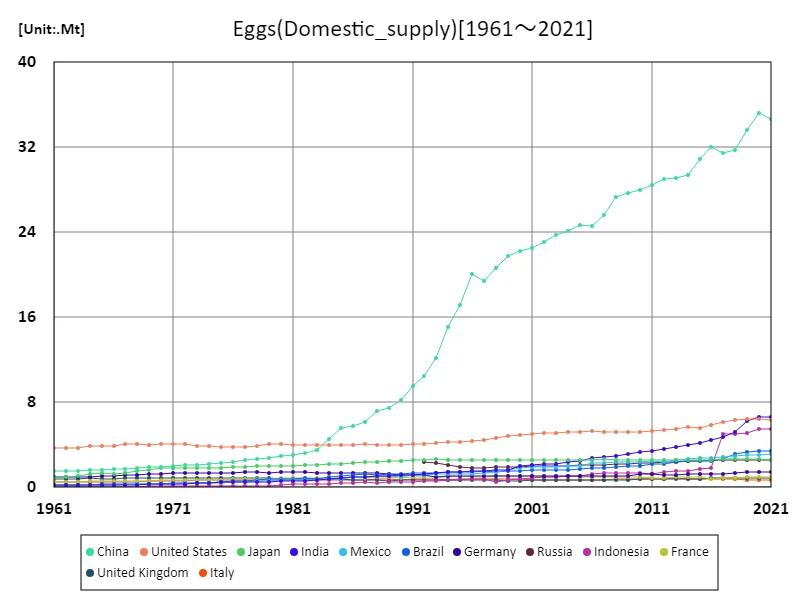
The maximum is 35.2Mt[2020] of China, and the current value is about 98.3%
Domestic egg supply (latest year, worldwide)
In 2021, global egg production reached 92.8 million metric tons, with China contributing the largest share at 34.6 million metric tons. China’s scale, representing a significant portion of global supply, reflects its robust domestic demand and the presence of large, efficient farming operations. The global average production per country was 504,000 metric tons, indicating wide disparities in production capacity across regions. High-population countries such as India and the U.S. also contribute substantially, primarily focusing on domestic supply. European producers have increasingly embraced welfare standards like cage-free production, affecting costs and output. Global trends in egg production continue to be influenced by rising protein demand, evolving animal welfare standards, and challenges like feed price volatility and disease outbreaks. These factors collectively shape the stability and growth of the global egg supply.1/2
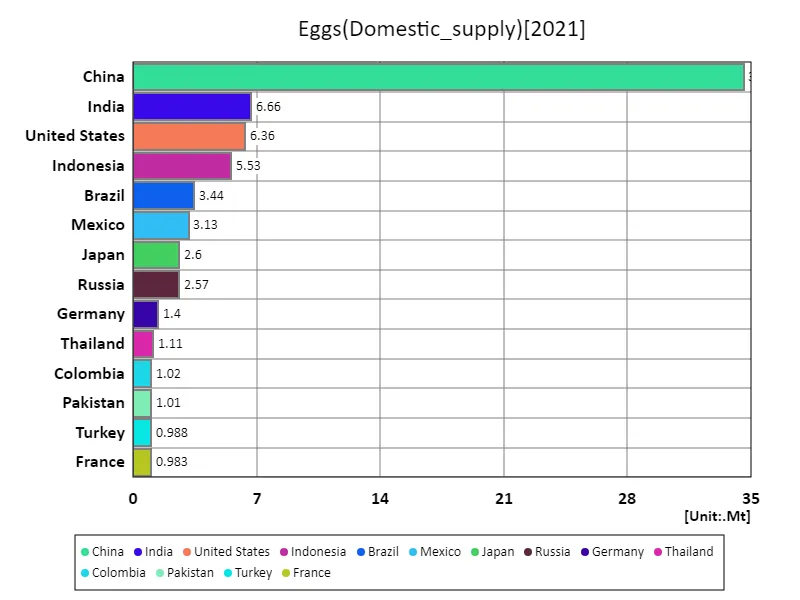
The maximum is 34.6Mt of China, the average is 507kt, and the total is 92.7Mt
Domestic egg supply (continental)
As of 2021, Asia dominated global egg production with a record 60.1 million metric tons, largely due to the scale and growth of egg farming in China, India, and other densely populated countries. Asia’s high production reflects strong domestic demand, driven by the affordability and versatility of eggs as a protein source. The region’s production structure includes both industrial-scale farms and smaller, traditional operations, allowing for a diverse supply base. In recent years, rising incomes, urbanization, and population growth in Asia have sustained demand increases, while government support has fostered farm modernization and improved productivity. Globally, trends in egg production are influenced by factors such as feed prices, biosecurity challenges, and growing consumer interest in welfare-focused and sustainable practices, particularly in Europe and North America.
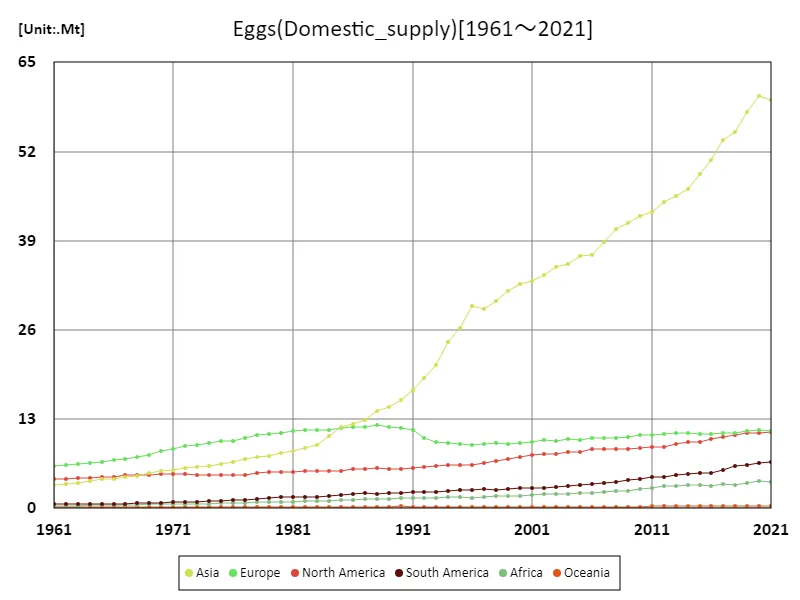
The maximum is 60.1Mt[2020] of Asia, and the current value is about 99.1%
Domestic egg supply (latest year, continent)
In 2021, global egg production totaled 109 million metric tons, with Asia leading at 59.6 million metric tons. Asia’s dominance in egg production reflects the strong domestic demand in densely populated countries like China and India, where eggs are an affordable protein source. With an average regional output of 12.1 million metric tons, the global industry shows significant regional disparities, as Asia alone accounts for over half of the world’s supply. This production structure ranges from large industrial farms to small-scale operations. Key trends shaping the industry include rising protein demand, increased biosecurity measures due to disease risks, and evolving welfare standards, especially in Europe and North America, where cage-free practices are growing. These factors, along with feed costs, continue to impact global egg supply stability.
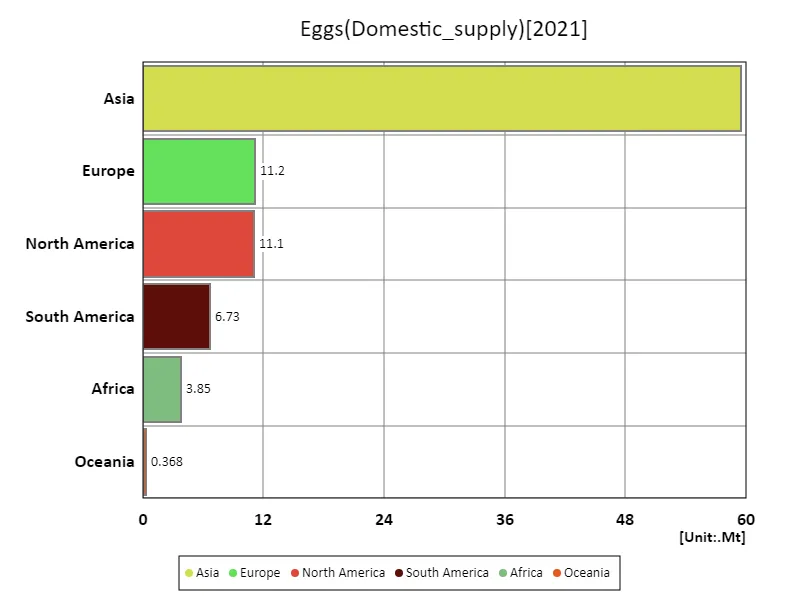
The maximum is 59.6Mt of Asia, the average is 15.5Mt, and the total is 92.8Mt
Main data
| Supply(Eggs, Domestic_supply) [Mt] | ||||||||||
|---|---|---|---|---|---|---|---|---|---|---|
| World | Asia | Upper-middle-income countries | Eastern Asia | China | High-income countries | Americas | Lower-middle-income countries | Europe | North America | |
| 2021 | 92.76 | 59.56 | 56.79 | 38.23 | 34.65 | 20.18 | 17.78 | 14.89 | 11.21 | 11.05 |
| 2020 | 93.49 | 60.08 | 57.3 | 38.82 | 35.23 | 20.33 | 17.66 | 14.92 | 11.46 | 11.02 |
| 2019 | 90.38 | 57.76 | 54.8 | 37.23 | 33.63 | 20.2 | 17.29 | 14.51 | 11.31 | 10.92 |
| 2018 | 86.42 | 54.84 | 52.78 | 35.4 | 31.77 | 19.66 | 16.89 | 13.18 | 10.99 | 10.72 |
| 2017 | 84.46 | 53.74 | 51.68 | 35 | 31.43 | 19.24 | 15.95 | 12.72 | 10.93 | 10.4 |
| 2016 | 80.44 | 50.75 | 48.6 | 35.57 | 32.07 | 18.79 | 15.22 | 12.25 | 10.83 | 10.06 |
| 2015 | 78.16 | 48.72 | 47.17 | 34.36 | 30.9 | 18.26 | 14.83 | 11.93 | 10.85 | 9.66 |
| 2014 | 75.75 | 46.51 | 45.17 | 32.73 | 29.38 | 18.14 | 14.66 | 11.63 | 10.93 | 9.66 |
| 2013 | 74.24 | 45.53 | 44.37 | 32.44 | 29.09 | 17.93 | 14.18 | 11.17 | 10.95 | 9.38 |
| 2012 | 72.48 | 44.67 | 43.55 | 32.33 | 29 | 17.4 | 13.52 | 10.77 | 10.76 | 8.91 |
| 2011 | 70.61 | 43.21 | 42.63 | 31.79 | 28.49 | 17.38 | 13.46 | 9.94 | 10.74 | 8.91 |
| 2010 | 69.35 | 42.53 | 41.82 | 31.31 | 28 | 17.34 | 13.07 | 9.59 | 10.72 | 8.81 |
| 2009 | 67.57 | 41.65 | 41.16 | 31.01 | 27.73 | 17.05 | 12.82 | 8.85 | 10.38 | 8.7 |
| 2008 | 66.27 | 40.73 | 40.19 | 30.62 | 27.31 | 17.04 | 12.44 | 8.57 | 10.31 | 8.63 |
| 2007 | 63.95 | 38.74 | 38.25 | 28.93 | 25.62 | 17.09 | 12.24 | 8.17 | 10.3 | 8.6 |
| 2006 | 61.97 | 36.99 | 36.85 | 27.82 | 24.6 | 16.86 | 12.27 | 7.83 | 10.18 | 8.67 |
| 2005 | 60.71 | 36.72 | 36.11 | 27.96 | 24.73 | 16.66 | 11.64 | 7.5 | 9.97 | 8.27 |
| 2004 | 59.49 | 35.65 | 35 | 27.29 | 24.08 | 16.9 | 11.35 | 7.16 | 10.15 | 8.17 |
| 2003 | 58.28 | 35.1 | 34.5 | 26.98 | 23.7 | 16.56 | 11.05 | 6.79 | 9.84 | 7.97 |
| 2002 | 57.25 | 34.05 | 33.54 | 26.31 | 23.04 | 16.7 | 10.93 | 6.59 | 9.99 | 7.96 |
| 2001 | 55.84 | 33.14 | 32.7 | 25.76 | 22.52 | 16.52 | 10.84 | 6.23 | 9.73 | 7.81 |
| 2000 | 54.7 | 32.73 | 32.21 | 25.42 | 22.23 | 16.18 | 10.46 | 5.93 | 9.48 | 7.51 |
| 1999 | 53.21 | 31.69 | 31.3 | 24.94 | 21.78 | 15.81 | 10.1 | 5.56 | 9.37 | 7.25 |
| 1998 | 51.32 | 30.18 | 29.74 | 23.74 | 20.62 | 15.76 | 9.57 | 5.29 | 9.58 | 6.89 |
| 1997 | 49.56 | 29.06 | 28.48 | 22.56 | 19.38 | 15.5 | 9.38 | 5.08 | 9.35 | 6.61 |
| 1996 | 49.49 | 29.47 | 28.78 | 23.22 | 20.04 | 15.23 | 8.99 | 4.98 | 9.27 | 6.38 |
| 1995 | 46.33 | 26.24 | 25.82 | 20.28 | 17.15 | 15.05 | 8.89 | 4.97 | 9.38 | 6.29 |
| 1994 | 44.27 | 24.19 | 23.9 | 18.28 | 15.13 | 14.94 | 8.75 | 4.93 | 9.55 | 6.25 |
| 1993 | 40.77 | 20.87 | 20.77 | 15.32 | 12.13 | 14.72 | 8.52 | 4.79 | 9.64 | 6.12 |
| 1992 | 39.37 | 19.04 | 19.47 | 13.67 | 10.51 | 14.69 | 8.35 | 4.67 | 10.23 | 6.01 |
| 1991 | 38.76 | 17.27 | 20.22 | 12.63 | 9.51 | 14.45 | 8.3 | 3.53 | 11.44 | 5.93 |
| 1990 | 37.12 | 15.72 | 18.8 | 11.22 | 8.22 | 14.37 | 7.97 | 3.4 | 11.68 | 5.73 |
| 1989 | 36.07 | 14.77 | 17.96 | 10.43 | 7.46 | 14.3 | 7.92 | 3.28 | 11.82 | 5.72 |
| 1988 | 35.8 | 14.14 | 17.56 | 10.14 | 7.18 | 14.55 | 7.96 | 3.17 | 12.11 | 5.81 |
| 1987 | 34.28 | 12.87 | 16.27 | 9.02 | 6.12 | 14.46 | 7.94 | 3.02 | 11.92 | 5.76 |
| 1986 | 33.39 | 12.25 | 15.65 | 8.5 | 5.77 | 14.35 | 7.78 | 2.87 | 11.89 | 5.7 |
| 1985 | 32.34 | 11.79 | 14.84 | 8.18 | 5.56 | 14.23 | 7.44 | 2.77 | 11.7 | 5.5 |
| 1984 | 30.58 | 10.54 | 13.41 | 7.1 | 4.53 | 14.05 | 7.22 | 2.63 | 11.48 | 5.39 |
| 1983 | 29.15 | 9.29 | 12.09 | 6.05 | 3.52 | 14.03 | 7.05 | 2.55 | 11.43 | 5.41 |
| 1982 | 28.54 | 8.73 | 11.71 | 5.72 | 3.25 | 14.02 | 7.1 | 2.34 | 11.37 | 5.39 |
| 1981 | 27.76 | 8.3 | 11.26 | 5.45 | 3.04 | 13.84 | 6.95 | 2.19 | 11.27 | 5.32 |
| 1980 | 27.21 | 8.08 | 10.91 | 5.35 | 2.94 | 13.75 | 6.95 | 2.1 | 10.99 | 5.35 |
| 1979 | 26.41 | 7.64 | 10.31 | 5.17 | 2.79 | 13.7 | 6.78 | 1.94 | 10.85 | 5.29 |
| 1978 | 25.69 | 7.51 | 9.82 | 4.99 | 2.66 | 13.42 | 6.42 | 2.01 | 10.64 | 5.09 |
| 1977 | 24.62 | 7.21 | 9.27 | 4.78 | 2.53 | 13 | 6.08 | 1.93 | 10.29 | 4.88 |
| 1976 | 23.53 | 6.75 | 8.61 | 4.58 | 2.41 | 12.8 | 5.99 | 1.72 | 9.81 | 4.84 |
| 1975 | 23.14 | 6.44 | 8.52 | 4.41 | 2.32 | 12.63 | 5.9 | 1.59 | 9.83 | 4.81 |
| 1974 | 22.39 | 6.15 | 8.1 | 4.28 | 2.22 | 12.46 | 5.8 | 1.46 | 9.53 | 4.79 |
| 1973 | 21.87 | 6.01 | 7.69 | 4.21 | 2.14 | 12.43 | 5.83 | 1.4 | 9.19 | 4.87 |
| 1972 | 21.62 | 5.82 | 7.32 | 4.13 | 2.06 | 12.65 | 5.93 | 1.29 | 9.04 | 5.02 |
| 1971 | 20.97 | 5.61 | 6.96 | 4.03 | 2 | 12.46 | 5.86 | 1.18 | 8.68 | 5.01 |
| 1970 | 20.25 | 5.4 | 6.51 | 3.92 | 1.93 | 12.27 | 5.73 | 1.11 | 8.33 | 4.94 |
| 1969 | 19.32 | 5.16 | 6.12 | 3.72 | 1.87 | 11.75 | 5.6 | 1.09 | 7.79 | 4.84 |
| 1968 | 18.5 | 4.77 | 5.85 | 3.41 | 1.79 | 11.28 | 5.53 | 1.03 | 7.45 | 4.81 |
| 1967 | 17.98 | 4.5 | 5.63 | 3.22 | 1.75 | 11.05 | 5.51 | 0.96 | 7.25 | 4.83 |
| 1966 | 17.21 | 4.24 | 5.32 | 3.04 | 1.69 | 10.66 | 5.29 | 0.89 | 7 | 4.61 |
| 1965 | 16.76 | 4.22 | 5.04 | 3.08 | 1.64 | 10.56 | 5.17 | 0.84 | 6.72 | 4.52 |
| 1964 | 16.27 | 4.01 | 4.74 | 2.94 | 1.61 | 10.41 | 5.08 | 0.78 | 6.57 | 4.46 |
| 1963 | 15.6 | 3.71 | 4.69 | 2.67 | 1.55 | 9.85 | 4.92 | 0.76 | 6.39 | 4.35 |
| 1962 | 15.4 | 3.61 | 4.72 | 2.61 | 1.55 | 9.66 | 4.89 | 0.73 | 6.34 | 4.31 |
| 1961 | 15.03 | 3.44 | 4.64 | 2.5 | 1.53 | 9.38 | 4.82 | 0.7 | 6.22 | 4.22 |


Comments