
Abstract
Trends in global egg imports are largely determined by each country’s balance of demand and supply, as well as domestic production capacity. According to 2021 data, Germany recorded the highest egg imports at 644kt. This trend shows that although Germany has a large livestock industry, it is dependent on imports as domestic consumption exceeds production. Historically, developed and European countries have tended to have higher consumption and higher imports. In particular, countries such as Germany, France and the UK are inclined to seek cheaper imported eggs due to fluctuations in feed prices and domestic production costs. In response to this, emerging and developing countries are trying to increase their domestic production capacity, but imports are also increasing to meet growing consumption. In addition, in recent years, increasing interest in egg quality control and animal welfare has influenced import policies, with the EU and other countries setting particularly strict standards. This has led to a demand for environmentally friendly production methods and high quality eggs. In general, egg import volumes fluctuate based on each country’s production capacity and consumption needs, with developed countries in particular tending to be highly dependent on imports, with quality and animal welfare standards being key influencing factors.
Egg imports (worldwide)
Several important trends emerge from the egg import data from 1961 to 2021. In particular, Germany recorded its highest import volume of 758kt in 2010, but this has now fallen to 644kt, or about 85% of that amount. This decrease is likely due to increased domestic production, improved production efficiency, and the adoption of more sustainable agricultural methods. In the long term, egg consumption is high among developed countries, so imports tend to be relatively high, but this is heavily influenced by economic factors and market trends. For example, rising feed costs and changes in animal welfare standards can affect the price of imported eggs, resulting in increases or decreases in import volumes. International trade policies and environmental regulations also influence egg import trends. On the other hand, in developing countries, consumption increases along with economic growth, and this tends to lead to an increase in imports as well. Overall, import volumes are constantly fluctuating due to international competition and policy changes, and developed countries, in particular, often adjust their import volumes in response to fluctuations in domestic production.
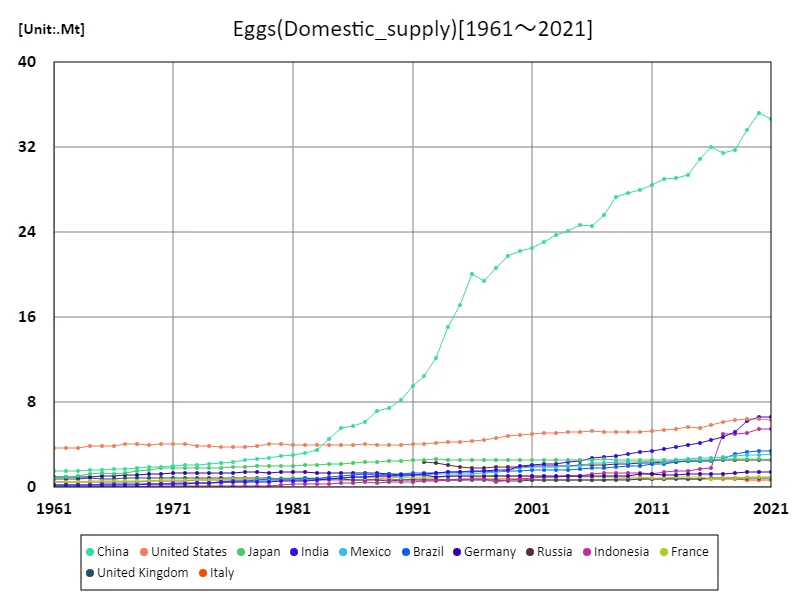
The maximum is 35.2Mt[2020] of China, and the current value is about 98.3%
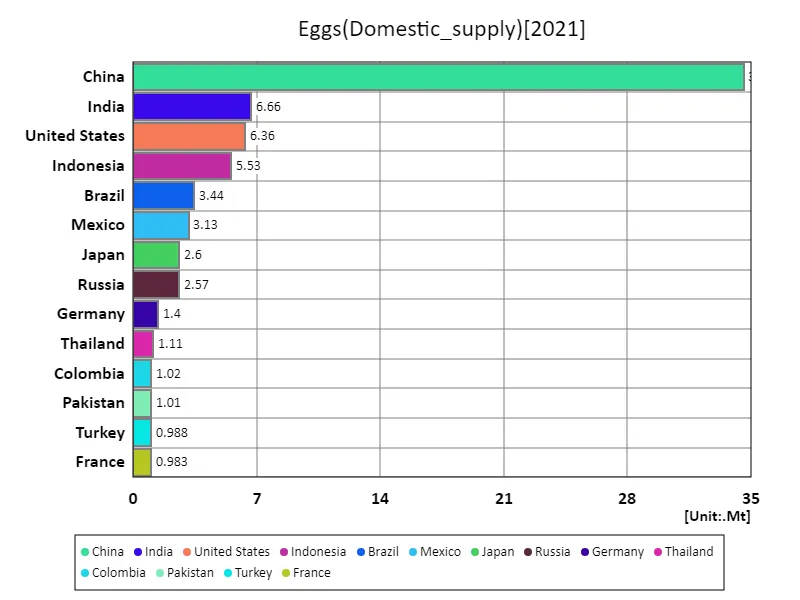
Egg import volume (latest year, countries around the world)
Based on 2021 data, global egg imports totaled 3.38Mt, of which Germany accounted for the largest share at 644kt. The figures show that Germany remains a significant egg importer, reflecting particularly high consumption in developed countries. The average import volume was 18.6kt, with Germany accounting for the majority of the total. Compared to historical data, developed countries still maintain high import volumes because domestic production cannot meet demand or because they seek price stability. For example, Germany imports on a large scale to complement its domestic production and also relies on imported goods to ensure quality and safety. On the other hand, in emerging and developing countries, consumption is increasing in line with economic growth, and import volumes are also on the rise, but they are still relatively low compared to developed countries. Overall, egg imports are subject to fluctuations as they are influenced by national production capacities, consumption, prices and international trade. In particular, major importing countries continue to import at a steady rate in order to balance domestic production and demand.
The maximum is 34.6Mt of China, the average is 507kt, and the total is 92.7Mt
Egg imports (continental)
According to 2021 data, the maximum volume of global egg imports reached 2.25Mt in the European region, which is the highest value among the historical data. This trend shows that Europe is the main importing region for eggs, with large imports occurring to balance high domestic demand and production. European countries, especially Germany, France and the UK, face high consumption and limited production capacity, which has led to a strong reliance on imports. Moreover, domestic production costs and stringent environmental regulations are driving demand for cheaper imports. In the EU in particular, high quality standards mean that there is a demand for imported products that meet these standards, which is also contributing to the increase in imports. In the longer term, there is growing interest in sustainable agriculture and animal welfare in Europe, which is also influencing import policies. As a result, while emphasis is being placed on importing eggs with guaranteed quality and safety, efforts are also being made to increase domestic production and improve self-sufficiency. As a result, Europe’s egg imports have remained steadily high and the country has established itself as a major player on the global market.
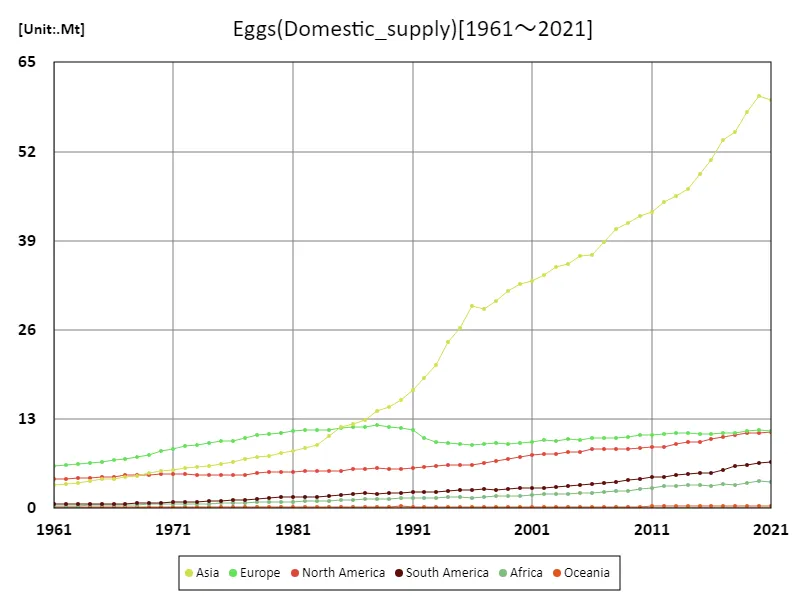
The maximum is 60.1Mt[2020] of Asia, and the current value is about 99.1%
Egg imports (latest year, continental)
According to 2021 data, global egg imports totalled 3.37Mt, of which Europe accounted for the largest share at 2.11Mt. This indicates that Europe accounts for a large portion of the egg import market, with Germany, France and the UK being notable importing countries. The average import volume across Europe was 562kt, with regional imbalances in demand and production capacity reflecting a high reliance on imports. The high import levels in Europe are due to high domestic consumption and limited production. In developed European countries, there is a high demand for imported products due to high consumption and high quality standards. Additionally, the cost and stringent regulations on domestic production are driving demand for cheaper, quality-assured imports. Looking at historical data, we can see that egg imports into Europe have remained at a stable high level and have been increasing year by year. This is thought to be due to changes in consumer tastes, trends in international trade, and adjustments to import volumes in response to fluctuations in domestic production. Overall, Europe is a major player in the global egg market, with import volumes fluctuating significantly depending on regional supply and demand balances and economic factors.
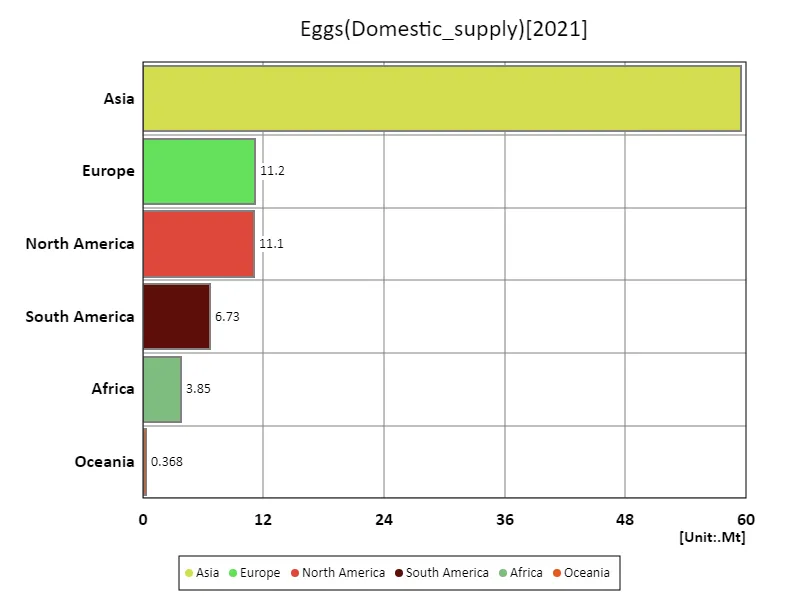
The maximum is 59.6Mt of Asia, the average is 15.5Mt, and the total is 92.8Mt
Main data
| Supply(Eggs, Domestic_supply) [Mt] | ||||||||||
|---|---|---|---|---|---|---|---|---|---|---|
| World | Asia | Upper-middle-income countries | Eastern Asia | China | High-income countries | Americas | Lower-middle-income countries | Europe | North America | |
| 2021 | 92.76 | 59.56 | 56.79 | 38.23 | 34.65 | 20.18 | 17.78 | 14.89 | 11.21 | 11.05 |
| 2020 | 93.49 | 60.08 | 57.3 | 38.82 | 35.23 | 20.33 | 17.66 | 14.92 | 11.46 | 11.02 |
| 2019 | 90.38 | 57.76 | 54.8 | 37.23 | 33.63 | 20.2 | 17.29 | 14.51 | 11.31 | 10.92 |
| 2018 | 86.42 | 54.84 | 52.78 | 35.4 | 31.77 | 19.66 | 16.89 | 13.18 | 10.99 | 10.72 |
| 2017 | 84.46 | 53.74 | 51.68 | 35 | 31.43 | 19.24 | 15.95 | 12.72 | 10.93 | 10.4 |
| 2016 | 80.44 | 50.75 | 48.6 | 35.57 | 32.07 | 18.79 | 15.22 | 12.25 | 10.83 | 10.06 |
| 2015 | 78.16 | 48.72 | 47.17 | 34.36 | 30.9 | 18.26 | 14.83 | 11.93 | 10.85 | 9.66 |
| 2014 | 75.75 | 46.51 | 45.17 | 32.73 | 29.38 | 18.14 | 14.66 | 11.63 | 10.93 | 9.66 |
| 2013 | 74.24 | 45.53 | 44.37 | 32.44 | 29.09 | 17.93 | 14.18 | 11.17 | 10.95 | 9.38 |
| 2012 | 72.48 | 44.67 | 43.55 | 32.33 | 29 | 17.4 | 13.52 | 10.77 | 10.76 | 8.91 |
| 2011 | 70.61 | 43.21 | 42.63 | 31.79 | 28.49 | 17.38 | 13.46 | 9.94 | 10.74 | 8.91 |
| 2010 | 69.35 | 42.53 | 41.82 | 31.31 | 28 | 17.34 | 13.07 | 9.59 | 10.72 | 8.81 |
| 2009 | 67.57 | 41.65 | 41.16 | 31.01 | 27.73 | 17.05 | 12.82 | 8.85 | 10.38 | 8.7 |
| 2008 | 66.27 | 40.73 | 40.19 | 30.62 | 27.31 | 17.04 | 12.44 | 8.57 | 10.31 | 8.63 |
| 2007 | 63.95 | 38.74 | 38.25 | 28.93 | 25.62 | 17.09 | 12.24 | 8.17 | 10.3 | 8.6 |
| 2006 | 61.97 | 36.99 | 36.85 | 27.82 | 24.6 | 16.86 | 12.27 | 7.83 | 10.18 | 8.67 |
| 2005 | 60.71 | 36.72 | 36.11 | 27.96 | 24.73 | 16.66 | 11.64 | 7.5 | 9.97 | 8.27 |
| 2004 | 59.49 | 35.65 | 35 | 27.29 | 24.08 | 16.9 | 11.35 | 7.16 | 10.15 | 8.17 |
| 2003 | 58.28 | 35.1 | 34.5 | 26.98 | 23.7 | 16.56 | 11.05 | 6.79 | 9.84 | 7.97 |
| 2002 | 57.25 | 34.05 | 33.54 | 26.31 | 23.04 | 16.7 | 10.93 | 6.59 | 9.99 | 7.96 |
| 2001 | 55.84 | 33.14 | 32.7 | 25.76 | 22.52 | 16.52 | 10.84 | 6.23 | 9.73 | 7.81 |
| 2000 | 54.7 | 32.73 | 32.21 | 25.42 | 22.23 | 16.18 | 10.46 | 5.93 | 9.48 | 7.51 |
| 1999 | 53.21 | 31.69 | 31.3 | 24.94 | 21.78 | 15.81 | 10.1 | 5.56 | 9.37 | 7.25 |
| 1998 | 51.32 | 30.18 | 29.74 | 23.74 | 20.62 | 15.76 | 9.57 | 5.29 | 9.58 | 6.89 |
| 1997 | 49.56 | 29.06 | 28.48 | 22.56 | 19.38 | 15.5 | 9.38 | 5.08 | 9.35 | 6.61 |
| 1996 | 49.49 | 29.47 | 28.78 | 23.22 | 20.04 | 15.23 | 8.99 | 4.98 | 9.27 | 6.38 |
| 1995 | 46.33 | 26.24 | 25.82 | 20.28 | 17.15 | 15.05 | 8.89 | 4.97 | 9.38 | 6.29 |
| 1994 | 44.27 | 24.19 | 23.9 | 18.28 | 15.13 | 14.94 | 8.75 | 4.93 | 9.55 | 6.25 |
| 1993 | 40.77 | 20.87 | 20.77 | 15.32 | 12.13 | 14.72 | 8.52 | 4.79 | 9.64 | 6.12 |
| 1992 | 39.37 | 19.04 | 19.47 | 13.67 | 10.51 | 14.69 | 8.35 | 4.67 | 10.23 | 6.01 |
| 1991 | 38.76 | 17.27 | 20.22 | 12.63 | 9.51 | 14.45 | 8.3 | 3.53 | 11.44 | 5.93 |
| 1990 | 37.12 | 15.72 | 18.8 | 11.22 | 8.22 | 14.37 | 7.97 | 3.4 | 11.68 | 5.73 |
| 1989 | 36.07 | 14.77 | 17.96 | 10.43 | 7.46 | 14.3 | 7.92 | 3.28 | 11.82 | 5.72 |
| 1988 | 35.8 | 14.14 | 17.56 | 10.14 | 7.18 | 14.55 | 7.96 | 3.17 | 12.11 | 5.81 |
| 1987 | 34.28 | 12.87 | 16.27 | 9.02 | 6.12 | 14.46 | 7.94 | 3.02 | 11.92 | 5.76 |
| 1986 | 33.39 | 12.25 | 15.65 | 8.5 | 5.77 | 14.35 | 7.78 | 2.87 | 11.89 | 5.7 |
| 1985 | 32.34 | 11.79 | 14.84 | 8.18 | 5.56 | 14.23 | 7.44 | 2.77 | 11.7 | 5.5 |
| 1984 | 30.58 | 10.54 | 13.41 | 7.1 | 4.53 | 14.05 | 7.22 | 2.63 | 11.48 | 5.39 |
| 1983 | 29.15 | 9.29 | 12.09 | 6.05 | 3.52 | 14.03 | 7.05 | 2.55 | 11.43 | 5.41 |
| 1982 | 28.54 | 8.73 | 11.71 | 5.72 | 3.25 | 14.02 | 7.1 | 2.34 | 11.37 | 5.39 |
| 1981 | 27.76 | 8.3 | 11.26 | 5.45 | 3.04 | 13.84 | 6.95 | 2.19 | 11.27 | 5.32 |
| 1980 | 27.21 | 8.08 | 10.91 | 5.35 | 2.94 | 13.75 | 6.95 | 2.1 | 10.99 | 5.35 |
| 1979 | 26.41 | 7.64 | 10.31 | 5.17 | 2.79 | 13.7 | 6.78 | 1.94 | 10.85 | 5.29 |
| 1978 | 25.69 | 7.51 | 9.82 | 4.99 | 2.66 | 13.42 | 6.42 | 2.01 | 10.64 | 5.09 |
| 1977 | 24.62 | 7.21 | 9.27 | 4.78 | 2.53 | 13 | 6.08 | 1.93 | 10.29 | 4.88 |
| 1976 | 23.53 | 6.75 | 8.61 | 4.58 | 2.41 | 12.8 | 5.99 | 1.72 | 9.81 | 4.84 |
| 1975 | 23.14 | 6.44 | 8.52 | 4.41 | 2.32 | 12.63 | 5.9 | 1.59 | 9.83 | 4.81 |
| 1974 | 22.39 | 6.15 | 8.1 | 4.28 | 2.22 | 12.46 | 5.8 | 1.46 | 9.53 | 4.79 |
| 1973 | 21.87 | 6.01 | 7.69 | 4.21 | 2.14 | 12.43 | 5.83 | 1.4 | 9.19 | 4.87 |
| 1972 | 21.62 | 5.82 | 7.32 | 4.13 | 2.06 | 12.65 | 5.93 | 1.29 | 9.04 | 5.02 |
| 1971 | 20.97 | 5.61 | 6.96 | 4.03 | 2 | 12.46 | 5.86 | 1.18 | 8.68 | 5.01 |
| 1970 | 20.25 | 5.4 | 6.51 | 3.92 | 1.93 | 12.27 | 5.73 | 1.11 | 8.33 | 4.94 |
| 1969 | 19.32 | 5.16 | 6.12 | 3.72 | 1.87 | 11.75 | 5.6 | 1.09 | 7.79 | 4.84 |
| 1968 | 18.5 | 4.77 | 5.85 | 3.41 | 1.79 | 11.28 | 5.53 | 1.03 | 7.45 | 4.81 |
| 1967 | 17.98 | 4.5 | 5.63 | 3.22 | 1.75 | 11.05 | 5.51 | 0.96 | 7.25 | 4.83 |
| 1966 | 17.21 | 4.24 | 5.32 | 3.04 | 1.69 | 10.66 | 5.29 | 0.89 | 7 | 4.61 |
| 1965 | 16.76 | 4.22 | 5.04 | 3.08 | 1.64 | 10.56 | 5.17 | 0.84 | 6.72 | 4.52 |
| 1964 | 16.27 | 4.01 | 4.74 | 2.94 | 1.61 | 10.41 | 5.08 | 0.78 | 6.57 | 4.46 |
| 1963 | 15.6 | 3.71 | 4.69 | 2.67 | 1.55 | 9.85 | 4.92 | 0.76 | 6.39 | 4.35 |
| 1962 | 15.4 | 3.61 | 4.72 | 2.61 | 1.55 | 9.66 | 4.89 | 0.73 | 6.34 | 4.31 |
| 1961 | 15.03 | 3.44 | 4.64 | 2.5 | 1.53 | 9.38 | 4.82 | 0.7 | 6.22 | 4.22 |


Comments