
Abstract
According to 2022 data, China is the world’s largest egg producer, producing about 34.4 million tonnes (Mt). This indicates China’s overwhelming scale of egg production as an agricultural crop and reflects the importance of eggs to China’s food culture and economy. Over the past few decades, China’s egg production has been steadily increasing, driven by the country’s growing population, expanding middle class and changing dietary habits. In China, eggs are considered an important source of protein and are widely used in home cooking and restaurant menus. As a result, production is increasing to meet domestic demand, and technological innovation and efficiency in the poultry industry is also progressing. Additionally, China’s growing egg production means it has a significant influence in the global egg market. Other major producers include the United States and India, but their production volumes are smaller than that of China. The United States’ egg production is about 9.1 Mt, and India’s is about 6.2 Mt, both of which are small compared to China’s production. Overall, egg production is an important part of agriculture and has a significant impact on food security and international trade. The impact that large-scale producing countries like China have on the market is immeasurable, and their movements will continue to attract attention.
Egg production (worldwide)
Considering data from 1961 to 2022, China’s role in egg production stands out. China recorded the world’s largest production of 35.1 million tonnes (Mt) in 2020, after which current production is 34.4 Mt, or 98% of the peak. The figures indicate that China maintains a sustained advantage in egg production. Over the past few decades, China’s egg production has seen remarkable growth, mainly driven by expanding domestic demand due to population growth and improving living standards. Since the 1960s, China’s egg production has increased dramatically. Rapid urbanization and economic growth, especially since the 1980s, have contributed to a significant increase in production capacity. China’s production increase is partly linked to technological innovations and improved production efficiency in the poultry industry, but it is also due to slowing production growth in recent years. Tightening environmental regulations and improved animal welfare are influential, and fluctuations in international markets are also taken into account. However, China still has an overwhelming presence in the global egg market, and future developments will be closely watched.
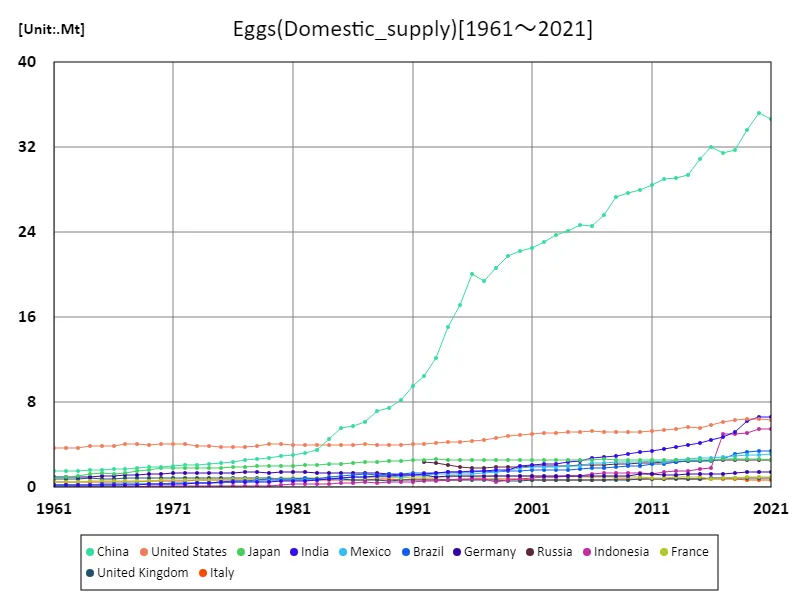
The maximum is 35.2Mt[2020] of China, and the current value is about 98.3%
Egg production (latest year, by country)
According to data for 2022, global egg production will reach a total of 88.2 million tonnes (Mt), with an average production of 516 thousand tonnes (kt). China was the largest producer with 34.4Mt, about 39% of the world’s total production. Egg production in China is one of the most important agricultural crops and is by far the largest in the country. Looking back at historical data, egg production has been on the rise worldwide, with China in particular showing remarkable growth. Data from the 1960s shows that with economic and population growth, demand for eggs has increased and production has expanded accordingly. China’s production not only meets domestic demand, but also has a significant impact on international markets. Other major producers include the United States and India, but their respective production volumes are smaller than China’s. The United States and India account for approximately 9.1Mt and 6.2Mt respectively, and although these countries play an important role in overall production, their production is relatively small compared to China’s. Overall, egg production plays a key role in the international food supply, with increases in production mainly driven by population growth and changing dietary habits. It is expected that trends in major egg-producing countries, including China, will continue to have a major impact on the global egg market.
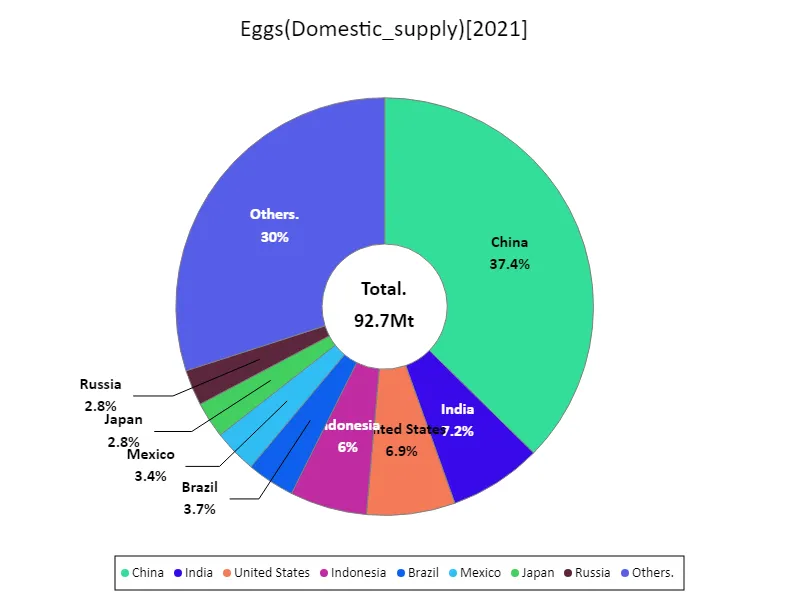
The maximum is 34.6Mt of China, the average is 507kt, and the total is 92.7Mt
Cheese production (worldwide)
According to 2021 data, the United States leads the world in cheese production, reaching 6.46 million tonnes (Mt). This shows that America is the world leader in cheese production, a position it has maintained in recent years. Beyond domestic demand, U.S. cheese production also has an impact on international markets, particularly in terms of exports. The trend over the past few decades has been one of sustained growth in cheese production. Data dating back to the 1960s shows that increased cheese consumption, changing food culture and growing demand for dairy products have driven increases in production. In the United States in particular, technological innovation and efficient production methods in the dairy industry led to a rapid increase in production. Other major producing countries include Germany, France and Italy, which also have important cheese production roles, but do not come close to the amount produced in the United States. Germany and France recorded production of around 2.6 Mt each and Italy around 1.6 Mt, and these countries are known worldwide for the variety and quality of their cheeses. The increase in cheese production is being driven by changes in global diets, particularly the growing demand for processed foods, and international food culture exchange. The U.S. cheese industry continues to play a key role in the global cheese market, supplying international markets in excess of domestic demand. This trend is expected to continue, and U.S. production will remain a focus of attention.
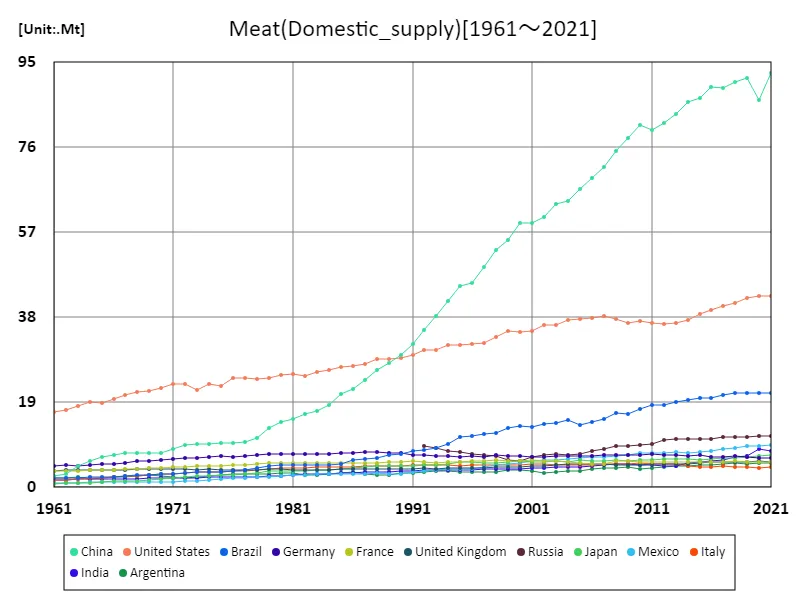
The maximum is the latest one, 92.5Mt of China
Cheese production by country (latest year)
According to 2021 data, global cheese production totals 26.1 million tonnes (Mt), with the United States being the largest producer, accounting for 6.46 Mt. America is currently the world’s largest cheese producer and has a strong influence in the international market. The average production volume was 244 thousand tonnes (kt), which indicates that the production volume of each country is distributed over a certain range. Looking back at historical data, cheese production has been on a long-term upward trend. Looking at growth since the 1960s, the main factors are changes in consumer eating habits and an increase in demand for dairy products. In particular, the United States has dramatically increased its cheese production by taking advantage of efficient production techniques and economies of scale. After the United States, the other major cheese producing countries are Germany, France and Italy. Germany and France each produced around 2.6Mt, while Italy is also a significant producer. These countries have their own cheese cultures and are recognized worldwide for the variety and quality of their cheeses, but they do not come close to the volume of cheese produced in the United States. The increase in cheese production is driven by the expansion of global food culture, as well as the growing demand for processed and convenient foods. Cheese production is expected to continue to grow in the future, and the trends in major producing countries, including the United States, will have a major impact on the global market.
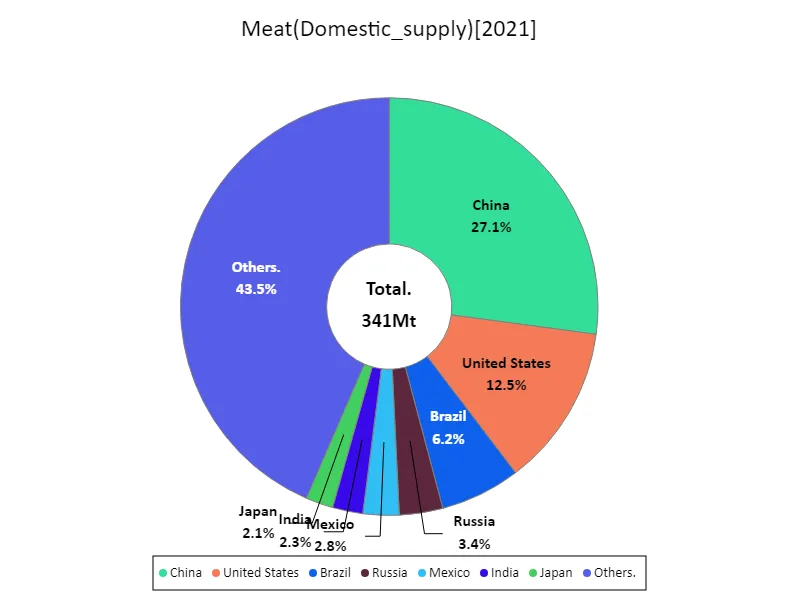
The maximum is 92.5Mt of China, the average is 1.86Mt, and the total is 341Mt
Main data
| Supply(Eggs, Domestic_supply) [Mt] | ||||||||||
|---|---|---|---|---|---|---|---|---|---|---|
| World | Asia | Upper-middle-income countries | Eastern Asia | China | High-income countries | Americas | Lower-middle-income countries | Europe | North America | |
| 2021 | 92.76 | 59.56 | 56.79 | 38.23 | 34.65 | 20.18 | 17.78 | 14.89 | 11.21 | 11.05 |
| 2020 | 93.49 | 60.08 | 57.3 | 38.82 | 35.23 | 20.33 | 17.66 | 14.92 | 11.46 | 11.02 |
| 2019 | 90.38 | 57.76 | 54.8 | 37.23 | 33.63 | 20.2 | 17.29 | 14.51 | 11.31 | 10.92 |
| 2018 | 86.42 | 54.84 | 52.78 | 35.4 | 31.77 | 19.66 | 16.89 | 13.18 | 10.99 | 10.72 |
| 2017 | 84.46 | 53.74 | 51.68 | 35 | 31.43 | 19.24 | 15.95 | 12.72 | 10.93 | 10.4 |
| 2016 | 80.44 | 50.75 | 48.6 | 35.57 | 32.07 | 18.79 | 15.22 | 12.25 | 10.83 | 10.06 |
| 2015 | 78.16 | 48.72 | 47.17 | 34.36 | 30.9 | 18.26 | 14.83 | 11.93 | 10.85 | 9.66 |
| 2014 | 75.75 | 46.51 | 45.17 | 32.73 | 29.38 | 18.14 | 14.66 | 11.63 | 10.93 | 9.66 |
| 2013 | 74.24 | 45.53 | 44.37 | 32.44 | 29.09 | 17.93 | 14.18 | 11.17 | 10.95 | 9.38 |
| 2012 | 72.48 | 44.67 | 43.55 | 32.33 | 29 | 17.4 | 13.52 | 10.77 | 10.76 | 8.91 |
| 2011 | 70.61 | 43.21 | 42.63 | 31.79 | 28.49 | 17.38 | 13.46 | 9.94 | 10.74 | 8.91 |
| 2010 | 69.35 | 42.53 | 41.82 | 31.31 | 28 | 17.34 | 13.07 | 9.59 | 10.72 | 8.81 |
| 2009 | 67.57 | 41.65 | 41.16 | 31.01 | 27.73 | 17.05 | 12.82 | 8.85 | 10.38 | 8.7 |
| 2008 | 66.27 | 40.73 | 40.19 | 30.62 | 27.31 | 17.04 | 12.44 | 8.57 | 10.31 | 8.63 |
| 2007 | 63.95 | 38.74 | 38.25 | 28.93 | 25.62 | 17.09 | 12.24 | 8.17 | 10.3 | 8.6 |
| 2006 | 61.97 | 36.99 | 36.85 | 27.82 | 24.6 | 16.86 | 12.27 | 7.83 | 10.18 | 8.67 |
| 2005 | 60.71 | 36.72 | 36.11 | 27.96 | 24.73 | 16.66 | 11.64 | 7.5 | 9.97 | 8.27 |
| 2004 | 59.49 | 35.65 | 35 | 27.29 | 24.08 | 16.9 | 11.35 | 7.16 | 10.15 | 8.17 |
| 2003 | 58.28 | 35.1 | 34.5 | 26.98 | 23.7 | 16.56 | 11.05 | 6.79 | 9.84 | 7.97 |
| 2002 | 57.25 | 34.05 | 33.54 | 26.31 | 23.04 | 16.7 | 10.93 | 6.59 | 9.99 | 7.96 |
| 2001 | 55.84 | 33.14 | 32.7 | 25.76 | 22.52 | 16.52 | 10.84 | 6.23 | 9.73 | 7.81 |
| 2000 | 54.7 | 32.73 | 32.21 | 25.42 | 22.23 | 16.18 | 10.46 | 5.93 | 9.48 | 7.51 |
| 1999 | 53.21 | 31.69 | 31.3 | 24.94 | 21.78 | 15.81 | 10.1 | 5.56 | 9.37 | 7.25 |
| 1998 | 51.32 | 30.18 | 29.74 | 23.74 | 20.62 | 15.76 | 9.57 | 5.29 | 9.58 | 6.89 |
| 1997 | 49.56 | 29.06 | 28.48 | 22.56 | 19.38 | 15.5 | 9.38 | 5.08 | 9.35 | 6.61 |
| 1996 | 49.49 | 29.47 | 28.78 | 23.22 | 20.04 | 15.23 | 8.99 | 4.98 | 9.27 | 6.38 |
| 1995 | 46.33 | 26.24 | 25.82 | 20.28 | 17.15 | 15.05 | 8.89 | 4.97 | 9.38 | 6.29 |
| 1994 | 44.27 | 24.19 | 23.9 | 18.28 | 15.13 | 14.94 | 8.75 | 4.93 | 9.55 | 6.25 |
| 1993 | 40.77 | 20.87 | 20.77 | 15.32 | 12.13 | 14.72 | 8.52 | 4.79 | 9.64 | 6.12 |
| 1992 | 39.37 | 19.04 | 19.47 | 13.67 | 10.51 | 14.69 | 8.35 | 4.67 | 10.23 | 6.01 |
| 1991 | 38.76 | 17.27 | 20.22 | 12.63 | 9.51 | 14.45 | 8.3 | 3.53 | 11.44 | 5.93 |
| 1990 | 37.12 | 15.72 | 18.8 | 11.22 | 8.22 | 14.37 | 7.97 | 3.4 | 11.68 | 5.73 |
| 1989 | 36.07 | 14.77 | 17.96 | 10.43 | 7.46 | 14.3 | 7.92 | 3.28 | 11.82 | 5.72 |
| 1988 | 35.8 | 14.14 | 17.56 | 10.14 | 7.18 | 14.55 | 7.96 | 3.17 | 12.11 | 5.81 |
| 1987 | 34.28 | 12.87 | 16.27 | 9.02 | 6.12 | 14.46 | 7.94 | 3.02 | 11.92 | 5.76 |
| 1986 | 33.39 | 12.25 | 15.65 | 8.5 | 5.77 | 14.35 | 7.78 | 2.87 | 11.89 | 5.7 |
| 1985 | 32.34 | 11.79 | 14.84 | 8.18 | 5.56 | 14.23 | 7.44 | 2.77 | 11.7 | 5.5 |
| 1984 | 30.58 | 10.54 | 13.41 | 7.1 | 4.53 | 14.05 | 7.22 | 2.63 | 11.48 | 5.39 |
| 1983 | 29.15 | 9.29 | 12.09 | 6.05 | 3.52 | 14.03 | 7.05 | 2.55 | 11.43 | 5.41 |
| 1982 | 28.54 | 8.73 | 11.71 | 5.72 | 3.25 | 14.02 | 7.1 | 2.34 | 11.37 | 5.39 |
| 1981 | 27.76 | 8.3 | 11.26 | 5.45 | 3.04 | 13.84 | 6.95 | 2.19 | 11.27 | 5.32 |
| 1980 | 27.21 | 8.08 | 10.91 | 5.35 | 2.94 | 13.75 | 6.95 | 2.1 | 10.99 | 5.35 |
| 1979 | 26.41 | 7.64 | 10.31 | 5.17 | 2.79 | 13.7 | 6.78 | 1.94 | 10.85 | 5.29 |
| 1978 | 25.69 | 7.51 | 9.82 | 4.99 | 2.66 | 13.42 | 6.42 | 2.01 | 10.64 | 5.09 |
| 1977 | 24.62 | 7.21 | 9.27 | 4.78 | 2.53 | 13 | 6.08 | 1.93 | 10.29 | 4.88 |
| 1976 | 23.53 | 6.75 | 8.61 | 4.58 | 2.41 | 12.8 | 5.99 | 1.72 | 9.81 | 4.84 |
| 1975 | 23.14 | 6.44 | 8.52 | 4.41 | 2.32 | 12.63 | 5.9 | 1.59 | 9.83 | 4.81 |
| 1974 | 22.39 | 6.15 | 8.1 | 4.28 | 2.22 | 12.46 | 5.8 | 1.46 | 9.53 | 4.79 |
| 1973 | 21.87 | 6.01 | 7.69 | 4.21 | 2.14 | 12.43 | 5.83 | 1.4 | 9.19 | 4.87 |
| 1972 | 21.62 | 5.82 | 7.32 | 4.13 | 2.06 | 12.65 | 5.93 | 1.29 | 9.04 | 5.02 |
| 1971 | 20.97 | 5.61 | 6.96 | 4.03 | 2 | 12.46 | 5.86 | 1.18 | 8.68 | 5.01 |
| 1970 | 20.25 | 5.4 | 6.51 | 3.92 | 1.93 | 12.27 | 5.73 | 1.11 | 8.33 | 4.94 |
| 1969 | 19.32 | 5.16 | 6.12 | 3.72 | 1.87 | 11.75 | 5.6 | 1.09 | 7.79 | 4.84 |
| 1968 | 18.5 | 4.77 | 5.85 | 3.41 | 1.79 | 11.28 | 5.53 | 1.03 | 7.45 | 4.81 |
| 1967 | 17.98 | 4.5 | 5.63 | 3.22 | 1.75 | 11.05 | 5.51 | 0.96 | 7.25 | 4.83 |
| 1966 | 17.21 | 4.24 | 5.32 | 3.04 | 1.69 | 10.66 | 5.29 | 0.89 | 7 | 4.61 |
| 1965 | 16.76 | 4.22 | 5.04 | 3.08 | 1.64 | 10.56 | 5.17 | 0.84 | 6.72 | 4.52 |
| 1964 | 16.27 | 4.01 | 4.74 | 2.94 | 1.61 | 10.41 | 5.08 | 0.78 | 6.57 | 4.46 |
| 1963 | 15.6 | 3.71 | 4.69 | 2.67 | 1.55 | 9.85 | 4.92 | 0.76 | 6.39 | 4.35 |
| 1962 | 15.4 | 3.61 | 4.72 | 2.61 | 1.55 | 9.66 | 4.89 | 0.73 | 6.34 | 4.31 |
| 1961 | 15.03 | 3.44 | 4.64 | 2.5 | 1.53 | 9.38 | 4.82 | 0.7 | 6.22 | 4.22 |


Comments