Abstract
Olive production and exports are important, with the Mediterranean region being the main producer. According to 2021 data, Spain recorded 1.2 million tonnes (Mt) of olive exports, making it the world’s largest exporter. Due to its climatic conditions and soil suitability, Spain is extremely well suited to olive cultivation, and it has large olive plantations and produces high-quality olive oil. After Spain, Italy and Greece are also important olive producing countries, each with their own unique varieties and production methods. Italy is known for producing high-quality olive oil, while Greece has inherited ancient traditions of olive cultivation. In recent years, the demand for olives has increased along with growing health consciousness, and consumption is expanding worldwide. The growth in the North American and Asian markets is particularly notable. As a result, exporting countries are not only focusing on increasing production volume, but also on improving quality and production efficiency. In addition, olive production is affected by climate change and pests, so there is a demand for the introduction of sustainable agricultural practices. Overall, the olive industry is adapting strategically to meet global demand while taking advantage of regional characteristics.
Olive exports (worldwide)
Olive exports are led by Spain, which recorded the highest export volume in 2020 at 1.23 million tonnes (Mt), according to data from 1961 to 2021. Spain has vast olive plantations along the Mediterranean coast and, thanks to its ideal climate and soil conditions, has long been the world’s largest olive exporter. Current export volumes are down to 97.4% of peak levels, a decline that is believed to be due to fluctuations in production volumes, the effects of climate change, and increased competition in the international market. From the 1960s to the 1990s, there was steady growth, but in the 21st century, climate change and changes in agricultural policies have had an impact. Spain is making strategic adjustments to meet emerging market demand while improving olive oil quality and production efficiency. Also, other major producers such as Italy and Greece are starting to influence the market, increasing competition. Overall, the olive export market is volatile, but Spain remains an important player.
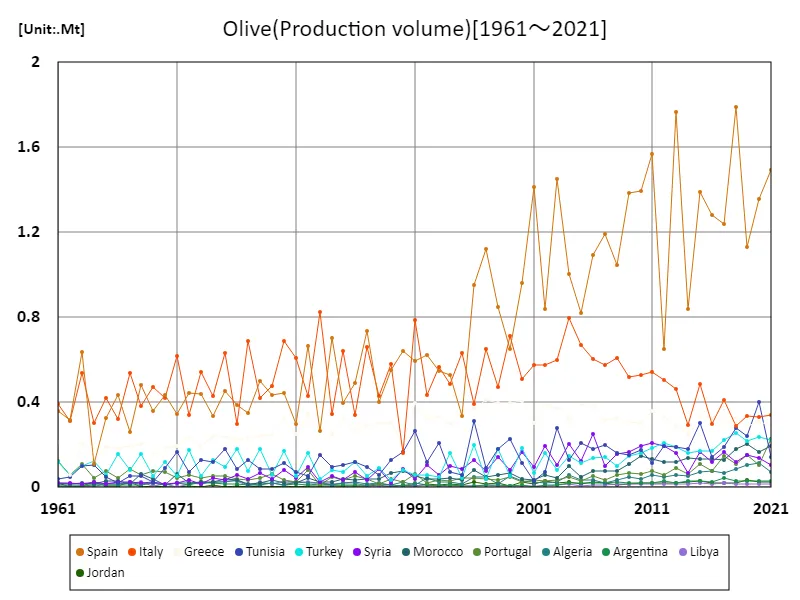
The maximum is 1.79Mt[2018] of Spain, and the current value is about 83.3%
Olive exports by country (latest year)
According to 2021 data, Spain stands out in terms of olive exports, making it the world’s largest exporter with 1.2 million tonnes (Mt). Total exports were 2.47 million tonnes, with Spain dominating the market. With an average export volume of 17.7 thousand tonnes (kt), Spain’s large share stands out. The olive export market is centered in the Mediterranean region, with Spain, Italy and Greece being the major exporters. Spain has favorable climate conditions, large olive plantations, and has a strong influence worldwide in the quality and production of olive oil. Other countries besides Spain also play an important role, with Italy and Greece, for example, making use of their own unique production characteristics, but not on the same scale as Spain. In recent years, the demand for olives has increased along with growing health consciousness, and the markets in North America and Asia have been expanding. As a result, the global olive export market continues to grow, with countries striving to increase production efficiency and improve quality. Large producers like Spain are driving market trends with their size and quality and are likely to continue to play a key role in the future.
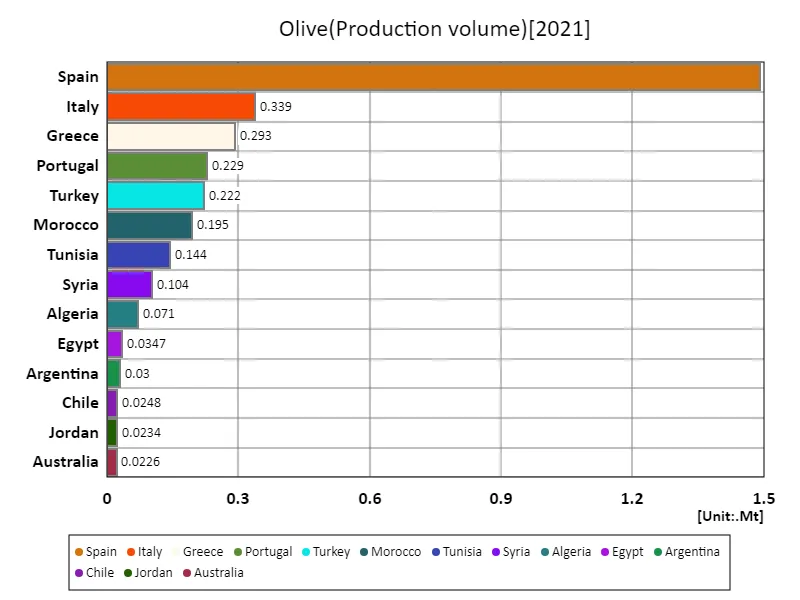
The maximum is 1.49Mt of Spain, the average is 90.5kt, and the total is 3.35Mt
Olive exports (continental)
According to 2021 data, olive exports are led by Europe, which recorded the largest global exports at 2.11 million tonnes (Mt). This figure is the highest compared to previous years and shows that Europe is the centre of olive exports. The increase in European exports was mainly due to contributions from major producers such as Spain, Italy and Greece, with Spain dominating the list. Historically, the Mediterranean region has been positioned as a major olive-producing region, and these countries, thanks to their favorable climatic conditions and soil, produce high-quality olives and olive oil. Spain in particular is a large producer and exporter, while Italy and Greece also have an impact on the international market with their high-quality products. In recent years, the demand for olive oil has increased along with growing health consciousness, which is driving an increase in exports from Europe. In addition, with demands for more sustainable agricultural practices and improved quality, European producers are working hard to meet these demands. Overall, the European olive export market is expected to continue to maintain its importance in the future.
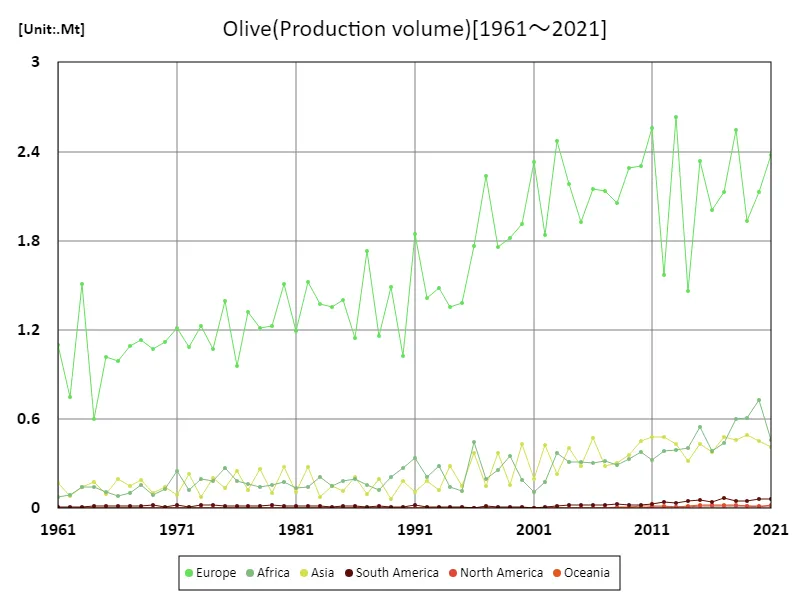
The maximum is 2.63Mt[2013] of Europe, and the current value is about 90.3%
Olive exports (latest year, continental)
Data for 2021 shows Europe’s overwhelming leadership in olive exports, recording the world’s largest export volume at 2.05 million tonnes (Mt). Overall exports were 2.47 million tonnes, with Europe accounting for the majority of the volume. With an average export volume of 412 thousand tonnes (kt), Europe’s contribution stands out. Olive production and export is mainly concentrated in the Mediterranean region, with Spain, Italy and Greece being the main exporters. Spain stands out as a particularly large producer and has been the world’s largest olive exporter for many years. Italy and Greece also produce high-quality olives and olive oil and have an important influence on the international market. In recent years, demand for olives has increased due to health consciousness and the popularity of the Mediterranean diet, which has encouraged an increase in exports from Europe. In the face of climate change and the need for greater production efficiency, European producers are implementing sustainable agricultural practices to maintain and improve quality. With these efforts, the European olive export market will continue to play an important role and maintain its central position in the market for years to come.
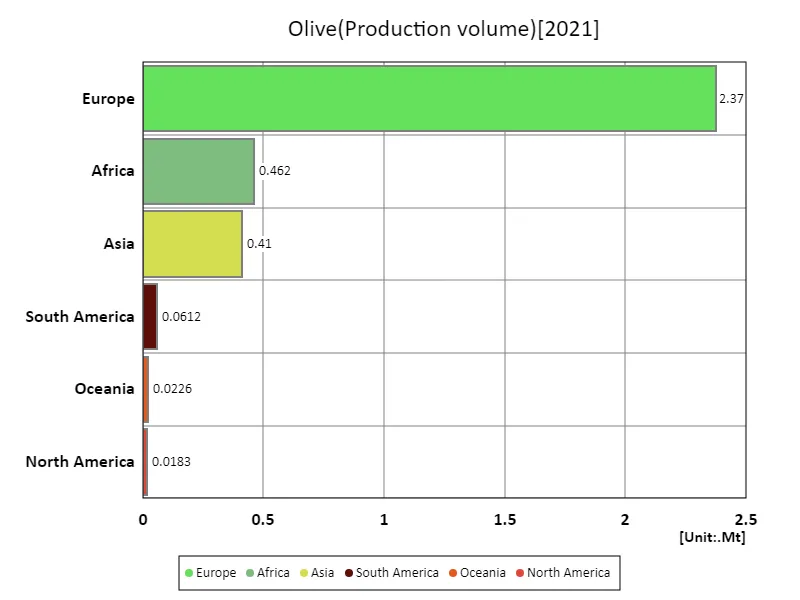
The maximum is 2.37Mt of Europe, the average is 558kt, and the total is 3.35Mt
Main data
| Production(Olive, Production volume) [Mt] | ||||||||||
|---|---|---|---|---|---|---|---|---|---|---|
| World | High-income countries | Europe | Southern Europe | European Union | Spain | Lower-middle-income countries | Northern Africa | Africa | Asia | |
| 2021 | 3.35 | 2.44 | 2.37 | 2.37 | 2.37 | 1.49 | 0.49 | 0.46 | 0.46 | 0.41 |
| 2020 | 3.4 | 2.18 | 2.13 | 2.12 | 2.12 | 1.36 | 0.76 | 0.73 | 0.73 | 0.46 |
| 2019 | 3.13 | 1.99 | 1.93 | 1.93 | 1.92 | 1.13 | 0.65 | 0.61 | 0.61 | 0.5 |
| 2018 | 3.69 | 2.61 | 2.54 | 2.54 | 2.53 | 1.79 | 0.63 | 0.6 | 0.6 | 0.46 |
| 2017 | 3.15 | 2.19 | 2.13 | 2.12 | 2.12 | 1.24 | 0.47 | 0.44 | 0.44 | 0.48 |
| 2016 | 2.85 | 2.06 | 2 | 2 | 1.99 | 1.28 | 0.42 | 0.39 | 0.39 | 0.38 |
| 2015 | 3.4 | 2.4 | 2.34 | 2.33 | 2.33 | 1.39 | 0.58 | 0.55 | 0.55 | 0.43 |
| 2014 | 2.25 | 1.51 | 1.46 | 1.46 | 1.45 | 0.84 | 0.43 | 0.4 | 0.4 | 0.32 |
| 2013 | 3.51 | 2.67 | 2.63 | 2.63 | 2.62 | 1.77 | 0.42 | 0.39 | 0.39 | 0.43 |
| 2012 | 2.5 | 1.6 | 1.57 | 1.56 | 1.56 | 0.65 | 0.41 | 0.38 | 0.38 | 0.48 |
| 2011 | 3.41 | 2.59 | 2.56 | 2.55 | 2.55 | 1.57 | 0.36 | 0.32 | 0.32 | 0.48 |
| 2010 | 3.18 | 2.33 | 2.3 | 2.3 | 2.3 | 1.4 | 0.43 | 0.38 | 0.38 | 0.45 |
| 2009 | 3.01 | 2.31 | 2.29 | 2.28 | 2.29 | 1.38 | 0.35 | 0.33 | 0.33 | 0.36 |
| 2008 | 2.69 | 2.07 | 2.05 | 2.05 | 2.05 | 1.04 | 0.3 | 0.29 | 0.29 | 0.31 |
| 2007 | 2.77 | 2.14 | 2.13 | 2.13 | 2.13 | 1.19 | 0.34 | 0.32 | 0.32 | 0.29 |
| 2006 | 2.95 | 2.15 | 2.15 | 2.14 | 2.14 | 1.09 | 0.33 | 0.3 | 0.3 | 0.47 |
| 2005 | 2.54 | 1.93 | 1.92 | 1.92 | 1.92 | 0.82 | 0.33 | 0.31 | 0.31 | 0.28 |
| 2004 | 2.93 | 2.19 | 2.18 | 2.18 | 2.18 | 1.01 | 0.33 | 0.31 | 0.31 | 0.41 |
| 2003 | 3.09 | 2.48 | 2.47 | 2.47 | 2.47 | 1.45 | 0.39 | 0.37 | 0.37 | 0.23 |
| 2002 | 2.45 | 1.84 | 1.84 | 1.83 | 1.84 | 0.84 | 0.2 | 0.17 | 0.17 | 0.42 |
| 2001 | 2.64 | 2.34 | 2.33 | 2.33 | 2.33 | 1.41 | 0.13 | 0.11 | 0.11 | 0.2 |
| 2000 | 2.54 | 1.92 | 1.91 | 1.91 | 1.91 | 0.96 | 0.23 | 0.19 | 0.19 | 0.43 |
| 1999 | 2.34 | 1.82 | 1.82 | 1.82 | 1.82 | 0.65 | 0.36 | 0.35 | 0.35 | 0.16 |
| 1998 | 2.4 | 1.76 | 1.76 | 1.75 | 1.76 | 0.85 | 0.28 | 0.26 | 0.26 | 0.37 |
| 1997 | 2.59 | 2.23 | 2.23 | 2.23 | 2.23 | 1.12 | 0.21 | 0.19 | 0.19 | 0.15 |
| 1996 | 2.58 | 1.76 | 1.76 | 1.76 | 1.76 | 0.95 | 0.47 | 0.44 | 0.44 | 0.37 |
| 1995 | 1.66 | 1.38 | 1.38 | 1.38 | 1.38 | 0.34 | 0.13 | 0.12 | 0.12 | 0.15 |
| 1994 | 1.79 | 1.35 | 1.35 | 1.35 | 1.35 | 0.53 | 0.16 | 0.15 | 0.15 | 0.28 |
| 1993 | 1.9 | 1.48 | 1.48 | 1.48 | 1.48 | 0.55 | 0.29 | 0.28 | 0.28 | 0.12 |
| 1992 | 1.82 | 1.42 | 1.42 | 1.41 | 1.42 | 0.62 | 0.22 | 0.21 | 0.21 | 0.18 |
| 1991 | 2.32 | 1.84 | 1.85 | 1.85 | 1.84 | 0.59 | 0.34 | 0.34 | 0.34 | 0.11 |
| 1990 | 1.49 | 1.03 | 1.03 | 1.03 | 1.03 | 0.64 | 0.28 | 0.27 | 0.27 | 0.18 |
| 1989 | 1.78 | 1.48 | 1.49 | 1.49 | 1.48 | 0.55 | 0.21 | 0.21 | 0.21 | 0.06 |
| 1988 | 1.49 | 1.16 | 1.16 | 1.16 | 1.15 | 0.4 | 0.13 | 0.12 | 0.12 | 0.19 |
| 1987 | 2 | 1.72 | 1.73 | 1.73 | 1.72 | 0.73 | 0.16 | 0.16 | 0.16 | 0.1 |
| 1986 | 1.57 | 1.15 | 1.15 | 1.15 | 1.14 | 0.49 | 0.19 | 0.2 | 0.2 | 0.21 |
| 1985 | 1.72 | 1.4 | 1.4 | 1.4 | 1.4 | 0.4 | 0.17 | 0.19 | 0.19 | 0.11 |
| 1984 | 1.66 | 1.35 | 1.35 | 1.35 | 1.35 | 0.7 | 0.15 | 0.15 | 0.15 | 0.15 |
| 1983 | 1.69 | 1.37 | 1.38 | 1.38 | 1.37 | 0.27 | 0.2 | 0.21 | 0.21 | 0.08 |
| 1982 | 1.96 | 1.53 | 1.52 | 1.52 | 1.52 | 0.67 | 0.14 | 0.14 | 0.14 | 0.28 |
| 1981 | 1.46 | 1.19 | 1.19 | 1.19 | 1.18 | 0.3 | 0.12 | 0.14 | 0.14 | 0.11 |
| 1980 | 1.98 | 1.51 | 1.51 | 1.51 | 1.5 | 0.45 | 0.17 | 0.18 | 0.18 | 0.28 |
| 1979 | 1.51 | 1.22 | 1.23 | 1.22 | 1.22 | 0.43 | 0.14 | 0.16 | 0.16 | 0.11 |
| 1978 | 1.64 | 1.21 | 1.21 | 1.21 | 1.21 | 0.5 | 0.13 | 0.14 | 0.14 | 0.27 |
| 1977 | 1.62 | 1.31 | 1.32 | 1.32 | 1.31 | 0.35 | 0.16 | 0.16 | 0.16 | 0.12 |
| 1976 | 1.41 | 0.96 | 0.96 | 0.96 | 0.95 | 0.39 | 0.17 | 0.18 | 0.18 | 0.25 |
| 1975 | 1.82 | 1.39 | 1.39 | 1.39 | 1.38 | 0.46 | 0.25 | 0.27 | 0.27 | 0.14 |
| 1974 | 1.48 | 1.07 | 1.07 | 1.07 | 1.06 | 0.33 | 0.19 | 0.18 | 0.18 | 0.2 |
| 1973 | 1.53 | 1.22 | 1.23 | 1.23 | 1.22 | 0.44 | 0.18 | 0.2 | 0.2 | 0.07 |
| 1972 | 1.45 | 1.09 | 1.08 | 1.08 | 1.08 | 0.44 | 0.12 | 0.13 | 0.13 | 0.23 |
| 1971 | 1.58 | 1.21 | 1.21 | 1.21 | 1.21 | 0.34 | 0.27 | 0.25 | 0.25 | 0.09 |
| 1970 | 1.41 | 1.12 | 1.12 | 1.12 | 1.12 | 0.43 | 0.13 | 0.13 | 0.13 | 0.15 |
| 1969 | 1.29 | 1.08 | 1.07 | 1.07 | 1.07 | 0.36 | 0.1 | 0.09 | 0.09 | 0.1 |
| 1968 | 1.5 | 1.14 | 1.13 | 1.13 | 1.13 | 0.48 | 0.14 | 0.16 | 0.16 | 0.19 |
| 1967 | 1.36 | 1.09 | 1.09 | 1.09 | 1.08 | 0.26 | 0.12 | 0.1 | 0.1 | 0.15 |
| 1966 | 1.29 | 0.99 | 0.99 | 0.99 | 0.99 | 0.44 | 0.08 | 0.08 | 0.08 | 0.2 |
| 1965 | 1.24 | 1.02 | 1.02 | 1.02 | 1.02 | 0.32 | 0.11 | 0.11 | 0.11 | 0.1 |
| 1964 | 0.94 | 0.59 | 0.6 | 0.6 | 0.59 | 0.11 | 0.17 | 0.14 | 0.14 | 0.18 |
| 1963 | 1.81 | 1.5 | 1.51 | 1.51 | 1.5 | 0.64 | 0.16 | 0.14 | 0.14 | 0.14 |
| 1962 | 0.93 | 0.75 | 0.75 | 0.75 | 0.74 | 0.32 | 0.08 | 0.09 | 0.09 | 0.08 |
| 1961 | 1.36 | 1.1 | 1.1 | 1.1 | 1.1 | 0.36 | 0.1 | 0.08 | 0.08 | 0.17 |


Comments