Abstract
Jute is an agricultural crop primarily used as a fiber crop and is mainly produced in India and Bangladesh. Data for 2021 shows the United States as the largest exporter of jute, reaching 706,000 tonnes (Mt), which is a bit of an odd result. This is because the United States is not a major jute producer and it is unlikely that export volumes would reach this scale. Usually, India and Bangladesh stand out in terms of jute exports. Looking at historical trends, India and Bangladesh are the major exporters of jute, accounting for a majority of its production. Jute applications include packaging materials, fabrics and ropes, which are widely used in agriculture and the construction industry. Recent trends include an increase in the demand for jute as a renewable material due to environmental concerns, which is impacting the market. In addition, jute prices are often dependent on weather conditions and the policies of producing countries, which also affect export volumes. Jute prefers a humid climate and grows primarily in monsoon regions, so it is directly affected by climate change and policy changes. In the future, it is likely that the use of jute will receive more attention from the perspective of environmental protection and sustainable agriculture.
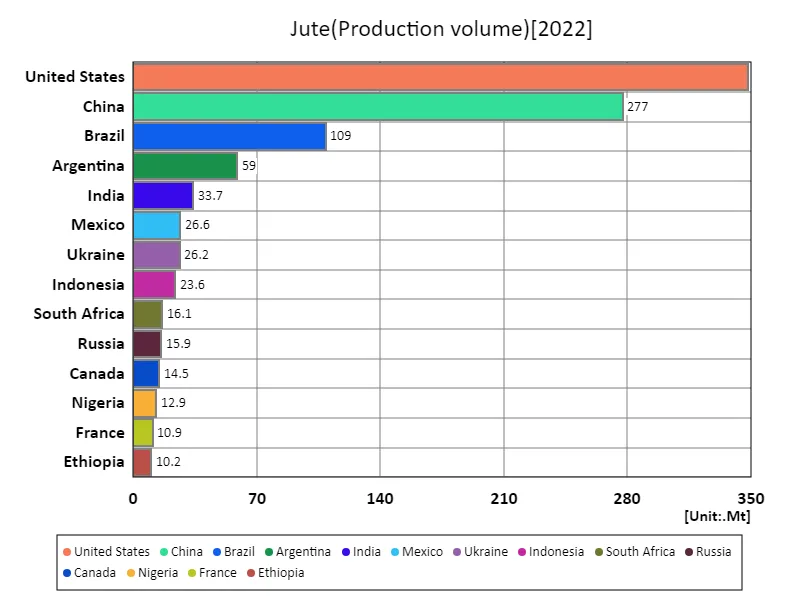
Jute exports (worldwide)
The data on jute exports covers a long period from 1961 to 2021, and recent trends are of particular interest. The United States recorded the highest jute exports in 2021 at 706,000 tonnes (Mt), 100% compared to the previous peak, which is unusual when compared to other major producing countries. Typically, the major jute producing countries are India and Bangladesh, which together account for a large portion of the market. Looking back at historical data, jute exports have been dominated by India and Bangladesh, with these countries accounting for the lion’s share of the total. However, the US’s rapid growth is an anomaly, and the US is not actually a major producer of jute. This means that there may be errors in the data, changes in measurement methods, or certain temporary factors that may have influenced the results. Additionally, the demand for jute has increased in recent years due to its renewable nature and environmental friendliness. In particular, its use as packaging and building materials has attracted attention, and it is gaining recognition as a sustainable resource. It is also characterised by large fluctuations in production and exports due to climate change and policy influences. In future, jute is expected to become even more important from an environmental conservation perspective.
The maximum is 412Mt[2016] of United States, and the current value is about 84.6%
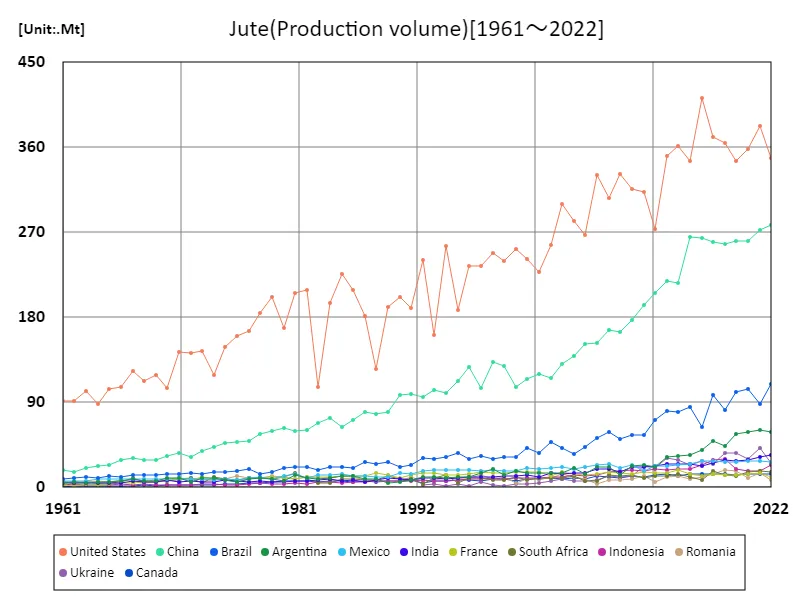
Jute exports (latest year, countries around the world)
The 2021 jute export volume data is notable, especially for the US record. That year, the United States recorded the largest amount of jute exports at 706,000 tonnes (Mt), accounting for the overwhelming share of the total. On the other hand, the overall export volume averaged 12,800 tons, totalling 2.06 million tons. These data differ in many ways from normal jute production and export trends, which may indicate some abnormal or special circumstances. Historically, jute has been primarily produced in India and Bangladesh, and these countries have dominated the market as major exporters. Due to its strength and biodegradability, jute is widely used for packaging materials, ropes, fabrics, etc., and demand is increasing as environmental awareness grows. Typically, India and Bangladesh account for the majority of jute exports, so the US’s impressive figures could be due to outliers in market data or idiosyncratic factors. Furthermore, fluctuations in jute export volumes are easily affected by weather conditions and policies, which have a significant impact on trends in producing and exporting countries. Demand for jute is increasing, especially amid growing interest in climate change and sustainability, and future market trends will be closely watched.
The maximum is 349Mt of United States, the average is 6.88Mt, and the total is 1.16Gt
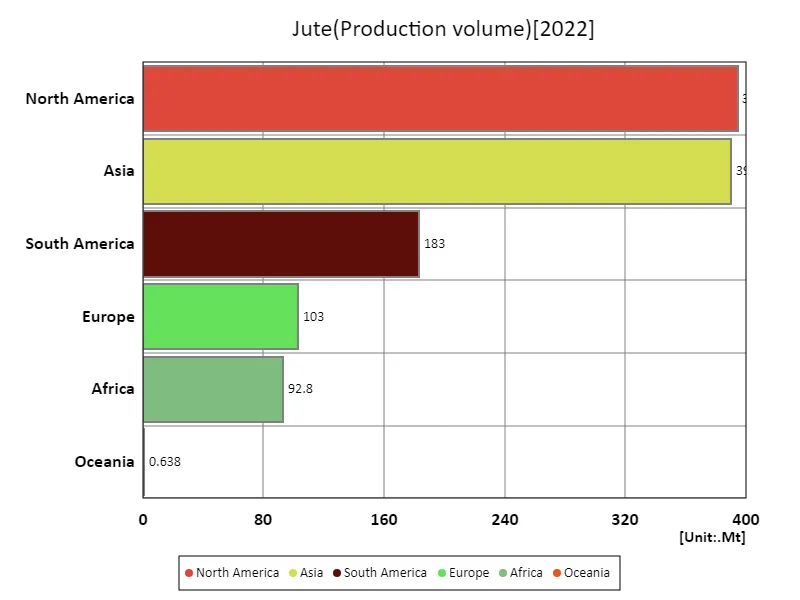
Jute exports (continental)
Data on jute exports for 2021 shows South America recorded the largest volume at 823,000 tonnes (Mt), the highest on record. This figure is unusually large compared to the other major jute producing countries, India and Bangladesh, and suggests that the jute market in South America is growing rapidly. Jute is produced especially in India and Bangladesh, which have accounted for the majority of the world’s jute exports. In contrast, the sharp increase in exports from South America could be due to increased local production capacity, new market developments, or temporary factors. Jute is mainly used for packaging materials, ropes and fabrics, and as a renewable material, demand for it is increasing along with growing environmental awareness. South America’s rapid growth in this area can be attributed to environmental policies, the introduction of new production technologies, and improved access to international markets. Additionally, jute prices and demand are heavily influenced by weather conditions and international economic trends, which may also be contributing to the increase in South American exports. It will be important to continue to keep an eye on trends in the jute market, and as environmental awareness grows, the use of jute is expected to expand.
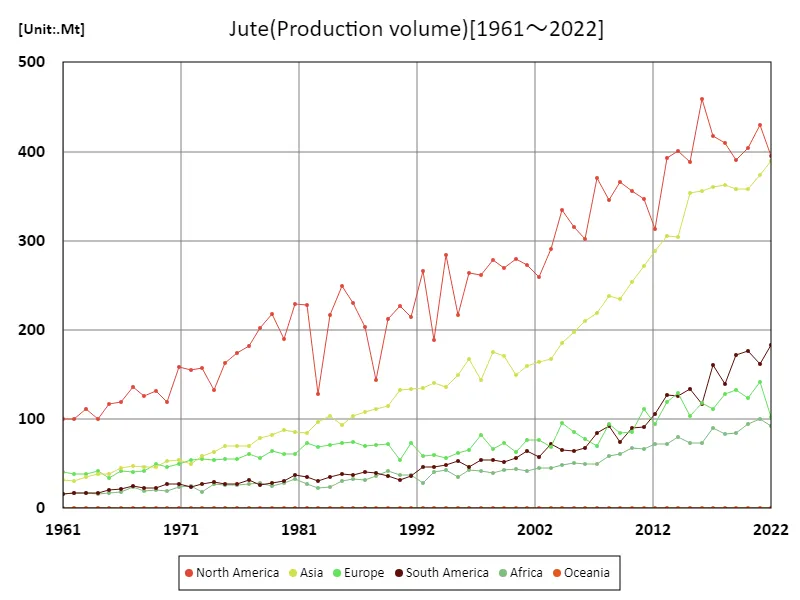
The maximum is 459Mt[2016] of North America, and the current value is about 85.9%
Jute exports (latest year, continental)
Jute export volume data for 2021 shows that North America recorded the largest volume at 730,000 tonnes (Mt), a notable figure across the board. Meanwhile, the overall average export volume was 343,000 tons, totaling 2.06 million tons. The data is distinctive in that it diverges from the usual jute production and export pattern, with North America playing a leading role. Jute is typically produced in South Asian countries such as India and Bangladesh, which have long dominated the market as major exporters. In contrast, the sharp increase in North America may be due to changes in market structure, specific policies, or data inconsistencies. The increase in North American jute exports may reflect advances in agricultural technology and changes in demand. Due to its renewable and environmentally friendly nature, jute is widely used for packaging materials, fabrics, ropes, etc., and in recent years demand for it as a sustainable resource has been increasing. The price and export volume of jute are affected by weather conditions and international market trends, and these fluctuations have a significant impact on the export volume. Future market trends will require further evaluation of jute’s sustainability, while also keeping a close eye on the role of North America and trends in other regions.
The maximum is 394Mt of North America, the average is 194Mt, and the total is 1.16Gt
Main data
| Production(Jute, Production volume) [Gt] | ||||||||||
|---|---|---|---|---|---|---|---|---|---|---|
| World | Americas | Upper-middle-income countries | High-income countries | North America | Asia | Northern America | United States | Eastern Asia | China | |
| 2022 | 1.16 | 0.58 | 0.57 | 0.42 | 0.39 | 0.39 | 0.36 | 0.35 | 0.28 | 0.28 |
| 2021 | 1.21 | 0.59 | 0.54 | 0.47 | 0.43 | 0.37 | 0.4 | 0.38 | 0.28 | 0.27 |
| 2020 | 1.16 | 0.58 | 0.54 | 0.44 | 0.4 | 0.36 | 0.37 | 0.36 | 0.26 | 0.26 |
| 2019 | 1.14 | 0.56 | 0.53 | 0.43 | 0.39 | 0.36 | 0.36 | 0.35 | 0.26 | 0.26 |
| 2018 | 1.12 | 0.55 | 0.51 | 0.45 | 0.41 | 0.36 | 0.38 | 0.36 | 0.26 | 0.26 |
| 2017 | 1.14 | 0.58 | 0.53 | 0.45 | 0.42 | 0.36 | 0.39 | 0.37 | 0.26 | 0.26 |
| 2016 | 1.12 | 0.58 | 0.48 | 0.49 | 0.46 | 0.36 | 0.43 | 0.41 | 0.27 | 0.26 |
| 2015 | 1.05 | 0.52 | 0.49 | 0.42 | 0.39 | 0.35 | 0.36 | 0.35 | 0.27 | 0.27 |
| 2014 | 1.04 | 0.53 | 0.44 | 0.45 | 0.4 | 0.3 | 0.37 | 0.36 | 0.22 | 0.22 |
| 2013 | 1.02 | 0.52 | 0.44 | 0.43 | 0.39 | 0.31 | 0.37 | 0.35 | 0.22 | 0.22 |
| 2012 | 0.87 | 0.42 | 0.39 | 0.35 | 0.31 | 0.29 | 0.29 | 0.27 | 0.21 | 0.21 |
| 2011 | 0.89 | 0.44 | 0.36 | 0.4 | 0.35 | 0.27 | 0.32 | 0.31 | 0.19 | 0.19 |
| 2010 | 0.85 | 0.45 | 0.35 | 0.39 | 0.36 | 0.25 | 0.33 | 0.32 | 0.18 | 0.18 |
| 2009 | 0.82 | 0.44 | 0.31 | 0.4 | 0.37 | 0.23 | 0.34 | 0.33 | 0.17 | 0.16 |
| 2008 | 0.83 | 0.44 | 0.34 | 0.38 | 0.35 | 0.24 | 0.32 | 0.31 | 0.17 | 0.17 |
| 2007 | 0.79 | 0.46 | 0.3 | 0.4 | 0.37 | 0.22 | 0.34 | 0.33 | 0.15 | 0.15 |
| 2006 | 0.71 | 0.37 | 0.28 | 0.34 | 0.3 | 0.21 | 0.28 | 0.27 | 0.15 | 0.15 |
| 2005 | 0.71 | 0.38 | 0.27 | 0.36 | 0.31 | 0.2 | 0.29 | 0.28 | 0.14 | 0.14 |
| 2004 | 0.73 | 0.4 | 0.26 | 0.38 | 0.33 | 0.18 | 0.31 | 0.3 | 0.13 | 0.13 |
| 2003 | 0.65 | 0.36 | 0.24 | 0.32 | 0.29 | 0.17 | 0.27 | 0.26 | 0.12 | 0.12 |
| 2002 | 0.6 | 0.32 | 0.23 | 0.3 | 0.26 | 0.16 | 0.24 | 0.23 | 0.12 | 0.12 |
| 2001 | 0.62 | 0.34 | 0.23 | 0.31 | 0.27 | 0.16 | 0.25 | 0.24 | 0.12 | 0.11 |
| 2000 | 0.59 | 0.34 | 0.21 | 0.31 | 0.28 | 0.15 | 0.26 | 0.25 | 0.11 | 0.11 |
| 1999 | 0.61 | 0.32 | 0.23 | 0.31 | 0.27 | 0.17 | 0.25 | 0.24 | 0.13 | 0.13 |
| 1998 | 0.62 | 0.33 | 0.24 | 0.31 | 0.28 | 0.18 | 0.26 | 0.25 | 0.14 | 0.13 |
| 1997 | 0.58 | 0.32 | 0.21 | 0.31 | 0.26 | 0.14 | 0.24 | 0.23 | 0.11 | 0.1 |
| 1996 | 0.59 | 0.31 | 0.22 | 0.3 | 0.26 | 0.17 | 0.24 | 0.23 | 0.13 | 0.13 |
| 1995 | 0.52 | 0.27 | 0.21 | 0.25 | 0.22 | 0.15 | 0.2 | 0.19 | 0.11 | 0.11 |
| 1994 | 0.57 | 0.33 | 0.2 | 0.31 | 0.28 | 0.14 | 0.26 | 0.26 | 0.1 | 0.1 |
| 1993 | 0.48 | 0.24 | 0.2 | 0.22 | 0.19 | 0.14 | 0.17 | 0.16 | 0.11 | 0.1 |
| 1992 | 0.53 | 0.31 | 0.18 | 0.29 | 0.27 | 0.13 | 0.25 | 0.24 | 0.1 | 0.1 |
| 1991 | 0.49 | 0.25 | 0.2 | 0.25 | 0.21 | 0.13 | 0.2 | 0.19 | 0.1 | 0.1 |
| 1990 | 0.48 | 0.26 | 0.18 | 0.25 | 0.23 | 0.13 | 0.21 | 0.2 | 0.1 | 0.1 |
| 1989 | 0.48 | 0.25 | 0.18 | 0.24 | 0.21 | 0.11 | 0.2 | 0.19 | 0.08 | 0.08 |
| 1988 | 0.4 | 0.18 | 0.18 | 0.18 | 0.14 | 0.11 | 0.13 | 0.13 | 0.08 | 0.08 |
| 1987 | 0.45 | 0.24 | 0.18 | 0.23 | 0.2 | 0.11 | 0.19 | 0.18 | 0.08 | 0.08 |
| 1986 | 0.48 | 0.27 | 0.17 | 0.26 | 0.23 | 0.1 | 0.21 | 0.21 | 0.07 | 0.07 |
| 1985 | 0.49 | 0.29 | 0.16 | 0.28 | 0.25 | 0.09 | 0.23 | 0.23 | 0.07 | 0.06 |
| 1984 | 0.45 | 0.25 | 0.17 | 0.25 | 0.22 | 0.1 | 0.2 | 0.19 | 0.08 | 0.07 |
| 1983 | 0.35 | 0.16 | 0.16 | 0.15 | 0.13 | 0.1 | 0.11 | 0.11 | 0.07 | 0.07 |
| 1982 | 0.45 | 0.26 | 0.15 | 0.26 | 0.23 | 0.08 | 0.22 | 0.21 | 0.06 | 0.06 |
| 1981 | 0.45 | 0.27 | 0.16 | 0.25 | 0.23 | 0.09 | 0.21 | 0.21 | 0.06 | 0.06 |
| 1980 | 0.4 | 0.22 | 0.15 | 0.21 | 0.19 | 0.09 | 0.17 | 0.17 | 0.07 | 0.06 |
| 1979 | 0.42 | 0.25 | 0.14 | 0.25 | 0.22 | 0.08 | 0.21 | 0.2 | 0.06 | 0.06 |
| 1978 | 0.39 | 0.23 | 0.13 | 0.23 | 0.2 | 0.08 | 0.19 | 0.18 | 0.06 | 0.06 |
| 1977 | 0.37 | 0.21 | 0.13 | 0.21 | 0.18 | 0.07 | 0.17 | 0.17 | 0.05 | 0.05 |
| 1976 | 0.35 | 0.2 | 0.12 | 0.2 | 0.17 | 0.07 | 0.16 | 0.16 | 0.05 | 0.05 |
| 1975 | 0.34 | 0.19 | 0.12 | 0.19 | 0.16 | 0.07 | 0.15 | 0.15 | 0.05 | 0.05 |
| 1974 | 0.31 | 0.16 | 0.12 | 0.15 | 0.13 | 0.06 | 0.12 | 0.12 | 0.05 | 0.04 |
| 1973 | 0.32 | 0.18 | 0.11 | 0.18 | 0.16 | 0.06 | 0.15 | 0.14 | 0.04 | 0.04 |
| 1972 | 0.31 | 0.18 | 0.1 | 0.18 | 0.16 | 0.05 | 0.14 | 0.14 | 0.03 | 0.03 |
| 1971 | 0.31 | 0.19 | 0.11 | 0.18 | 0.16 | 0.05 | 0.15 | 0.14 | 0.04 | 0.04 |
| 1970 | 0.27 | 0.15 | 0.1 | 0.14 | 0.12 | 0.05 | 0.11 | 0.11 | 0.03 | 0.03 |
| 1969 | 0.27 | 0.15 | 0.09 | 0.15 | 0.13 | 0.05 | 0.12 | 0.12 | 0.03 | 0.03 |
| 1968 | 0.26 | 0.15 | 0.09 | 0.14 | 0.13 | 0.05 | 0.12 | 0.11 | 0.03 | 0.03 |
| 1967 | 0.27 | 0.16 | 0.1 | 0.15 | 0.14 | 0.05 | 0.13 | 0.12 | 0.03 | 0.03 |
| 1966 | 0.25 | 0.14 | 0.09 | 0.13 | 0.12 | 0.05 | 0.11 | 0.11 | 0.03 | 0.03 |
| 1965 | 0.23 | 0.14 | 0.08 | 0.12 | 0.12 | 0.04 | 0.11 | 0.1 | 0.03 | 0.02 |
| 1964 | 0.22 | 0.12 | 0.08 | 0.11 | 0.1 | 0.04 | 0.09 | 0.09 | 0.02 | 0.02 |
| 1963 | 0.22 | 0.13 | 0.07 | 0.12 | 0.11 | 0.03 | 0.1 | 0.1 | 0.02 | 0.02 |
| 1962 | 0.2 | 0.12 | 0.07 | 0.11 | 0.1 | 0.03 | 0.09 | 0.09 | 0.02 | 0.02 |
| 1961 | 0.21 | 0.12 | 0.07 | 0.11 | 0.1 | 0.03 | 0.09 | 0.09 | 0.02 | 0.02 |


Comments