Abstract
Global vegetable production has experienced steady growth in recent decades, driven by increasing demand for diverse diets, population growth, and advances in agricultural technologies. As of 2021, the United States led in production with 22.2 million metric tons (Mt), emphasizing its role as a significant producer and exporter. Key characteristics of vegetable agriculture include regional specialization, with countries focusing on crops suited to their climates and economies. For example, China dominates in leafy greens, while the U.S. excels in tomatoes and sweet corn. Despite the growth, challenges such as climate change, water scarcity, and trade disruptions continue to influence global trends.
Vegetable imports (worldwide)
From 1961 to 2021, global vegetable imports have steadily increased, driven by rising population, urbanization, and demand for diverse, year-round produce. The United States, which reached its peak vegetable import record of 22.2 Mt in 2021, highlights the trend of growing reliance on imports to meet consumer needs. Currently at 100% of its peak, the U.S. reflects the broader pattern of globalization in agriculture, characterized by improved trade networks and advancements in storage and transportation. However, this growth has been tempered by factors like trade policies, climate change, and fluctuating production in exporting nations, underscoring the sector’s complexity.
The maximum is 1.46G[2021] of China, and the current value is about 97.8%
Vegetable imports (latest year, countries around the world)
In 2021, global agricultural vegetable imports totaled 143 Mt, with the United States leading at a record 22.2 Mt, significantly above the global average of 775 kt. This disparity highlights the U.S.’s strong dependence on imported vegetables to meet diverse consumer demand, reflecting broader trends of globalization in agriculture. Over time, vegetable imports have grown due to rising population, urbanization, and year-round consumption needs. The trend is marked by regional trade disparities, with developed nations importing more, while exporters rely on favorable climates and competitive pricing. Trade policies and climate risks remain key influences on future trends.
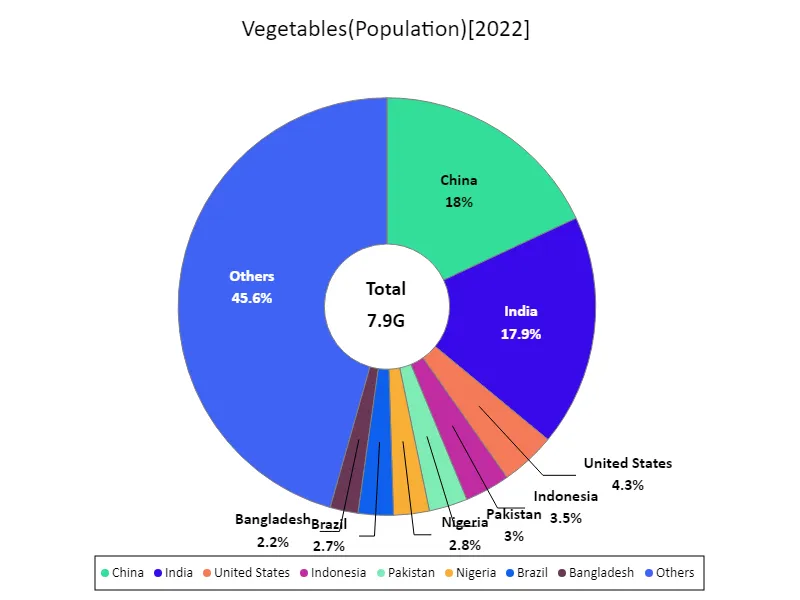
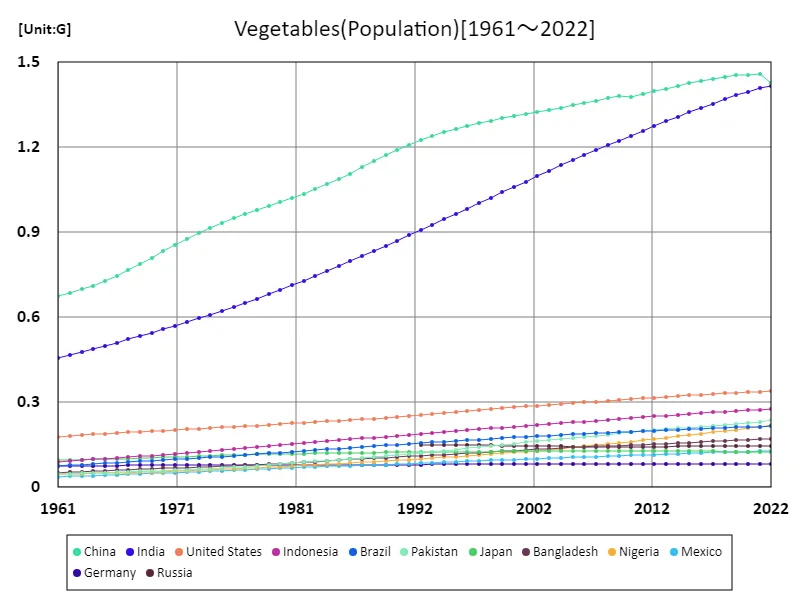
全体の最大はChinaの1.43Gで、平均は41.6M、Totalは7.9G
Vegetable imports (continent)
In 2021, Europe led global agricultural vegetable imports with a record 72.2 Mt, underscoring the region’s role as a major consumer and importer of fresh produce. This dominance reflects Europe’s reliance on imports to meet diverse dietary preferences, seasonal demands, and regional production shortfalls. Global vegetable imports have shown steady growth over recent decades, driven by population increases, urbanization, and improved trade networks. Europe exemplifies the trend of strong import reliance in developed regions, while exporters focus on leveraging competitive climates and lower production costs. Climate challenges and trade policies will shape future dynamics.
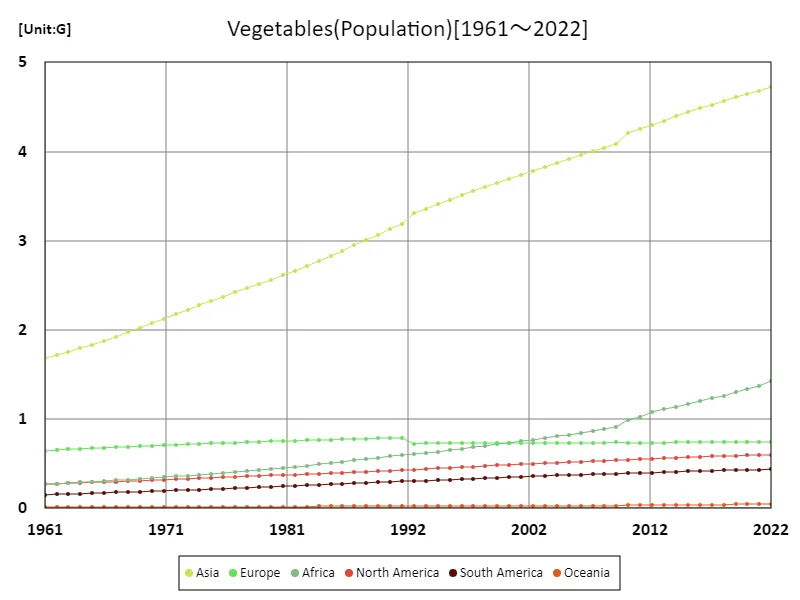
The maximum is the latest one, 4.72G of Asia
Vegetable imports (latest year, continent)
In 2021, global agricultural vegetable imports totaled 200 Mt, with Europe dominating at 72.2 Mt, far exceeding the global average of 22.2 Mt. This highlights Europe’s reliance on imports to meet diverse consumer demands and supplement domestic production. The steady rise in global vegetable imports reflects growing populations, urbanization, and year-round consumption needs, facilitated by advancements in trade networks and storage technologies. Europe’s import volume underscores the significant role of developed regions in driving trade. Future trends will likely be shaped by trade policies, climate change, and efforts to improve local production sustainability.
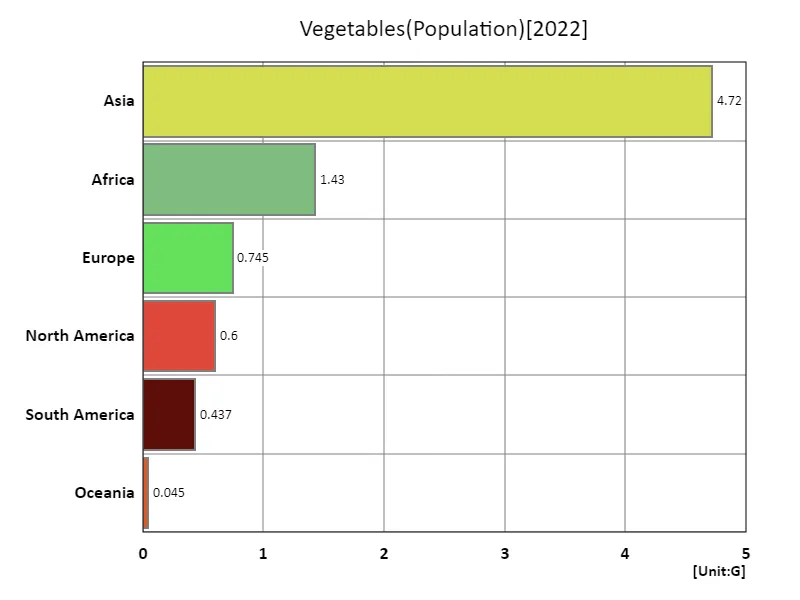
The maximum is 4.72G of Asia, the average is 1.33G, and the total is 7.98G
Main data
| Others(Vegetables, Population) [G] | ||||||||||
|---|---|---|---|---|---|---|---|---|---|---|
| World | Asia | Lower-middle-income countries | Upper-middle-income countries | Africa | China | India | High-income countries | Europe | Low-income countries | |
| 2022 | 7.98 | 4.72 | 3.45 | 2.56 | 1.43 | 1.43 | 1.42 | 1.22 | 0.74 | 0.72 |
| 2021 | 7.91 | 4.68 | 3.41 | 2.55 | 1.37 | 1.46 | 1.41 | 1.22 | 0.74 | 0.7 |
| 2020 | 7.84 | 4.65 | 3.37 | 2.54 | 1.34 | 1.46 | 1.4 | 1.22 | 0.74 | 0.68 |
| 2019 | 7.76 | 4.61 | 3.33 | 2.53 | 1.3 | 1.45 | 1.38 | 1.21 | 0.74 | 0.66 |
| 2018 | 7.68 | 4.57 | 3.28 | 2.52 | 1.26 | 1.45 | 1.37 | 1.21 | 0.74 | 0.64 |
| 2017 | 7.6 | 4.53 | 3.24 | 2.5 | 1.23 | 1.44 | 1.35 | 1.2 | 0.74 | 0.63 |
| 2016 | 7.51 | 4.48 | 3.19 | 2.48 | 1.2 | 1.43 | 1.34 | 1.2 | 0.74 | 0.61 |
| 2015 | 7.43 | 4.44 | 3.14 | 2.46 | 1.17 | 1.43 | 1.32 | 1.19 | 0.74 | 0.59 |
| 2014 | 7.34 | 4.39 | 3.1 | 2.44 | 1.14 | 1.42 | 1.31 | 1.18 | 0.74 | 0.58 |
| 2013 | 7.25 | 4.35 | 3.05 | 2.42 | 1.11 | 1.41 | 1.29 | 1.18 | 0.74 | 0.56 |
| 2012 | 7.16 | 4.3 | 3.01 | 2.4 | 1.08 | 1.4 | 1.27 | 1.17 | 0.74 | 0.55 |
| 2011 | 7.07 | 4.25 | 2.96 | 2.38 | 1.02 | 1.39 | 1.26 | 1.16 | 0.73 | 0.54 |
| 2010 | 6.99 | 4.2 | 2.91 | 2.36 | 0.99 | 1.38 | 1.24 | 1.15 | 0.73 | 0.52 |
| 2009 | 6.9 | 4.09 | 2.87 | 2.35 | 0.91 | 1.38 | 1.22 | 1.15 | 0.74 | 0.51 |
| 2008 | 6.81 | 4.04 | 2.82 | 2.33 | 0.89 | 1.37 | 1.21 | 1.14 | 0.74 | 0.49 |
| 2007 | 6.73 | 4 | 2.78 | 2.31 | 0.87 | 1.36 | 1.19 | 1.13 | 0.74 | 0.48 |
| 2006 | 6.64 | 3.96 | 2.74 | 2.29 | 0.85 | 1.36 | 1.17 | 1.12 | 0.73 | 0.46 |
| 2005 | 6.56 | 3.91 | 2.69 | 2.28 | 0.83 | 1.35 | 1.15 | 1.11 | 0.73 | 0.45 |
| 2004 | 6.48 | 3.87 | 2.65 | 2.26 | 0.81 | 1.34 | 1.14 | 1.1 | 0.73 | 0.44 |
| 2003 | 6.39 | 3.83 | 2.6 | 2.24 | 0.79 | 1.33 | 1.12 | 1.09 | 0.73 | 0.43 |
| 2002 | 6.31 | 3.78 | 2.56 | 2.23 | 0.77 | 1.32 | 1.1 | 1.09 | 0.73 | 0.41 |
| 2001 | 6.23 | 3.74 | 2.51 | 2.21 | 0.75 | 1.32 | 1.08 | 1.08 | 0.73 | 0.4 |
| 2000 | 6.15 | 3.69 | 2.47 | 2.19 | 0.74 | 1.31 | 1.06 | 1.07 | 0.73 | 0.39 |
| 1999 | 6.07 | 3.65 | 2.42 | 2.17 | 0.72 | 1.3 | 1.04 | 1.07 | 0.73 | 0.38 |
| 1998 | 5.99 | 3.6 | 2.38 | 2.16 | 0.7 | 1.29 | 1.02 | 1.06 | 0.73 | 0.37 |
| 1997 | 5.91 | 3.56 | 2.33 | 2.14 | 0.68 | 1.29 | 1 | 1.05 | 0.73 | 0.36 |
| 1996 | 5.83 | 3.51 | 2.29 | 2.12 | 0.67 | 1.28 | 0.98 | 1.05 | 0.73 | 0.35 |
| 1995 | 5.74 | 3.46 | 2.24 | 2.1 | 0.65 | 1.27 | 0.96 | 1.04 | 0.73 | 0.34 |
| 1994 | 5.66 | 3.41 | 2.2 | 2.08 | 0.64 | 1.25 | 0.95 | 1.03 | 0.73 | 0.33 |
| 1993 | 5.58 | 3.36 | 2.15 | 2.05 | 0.62 | 1.24 | 0.93 | 1.02 | 0.73 | 0.32 |
| 1992 | 5.49 | 3.31 | 2.11 | 2.03 | 0.61 | 1.23 | 0.91 | 1.02 | 0.73 | 0.31 |
| 1991 | 5.41 | 3.18 | 2.07 | 2.01 | 0.6 | 1.21 | 0.89 | 1.01 | 0.79 | 0.3 |
| 1990 | 5.32 | 3.13 | 2.02 | 1.98 | 0.58 | 1.19 | 0.87 | 1 | 0.79 | 0.3 |
| 1989 | 5.22 | 3.07 | 1.98 | 1.95 | 0.57 | 1.17 | 0.85 | 0.99 | 0.79 | 0.29 |
| 1988 | 5.13 | 3.01 | 1.93 | 1.92 | 0.55 | 1.15 | 0.83 | 0.99 | 0.78 | 0.28 |
| 1987 | 5.04 | 2.95 | 1.89 | 1.88 | 0.54 | 1.13 | 0.82 | 0.98 | 0.78 | 0.27 |
| 1986 | 4.95 | 2.89 | 1.84 | 1.85 | 0.52 | 1.11 | 0.8 | 0.97 | 0.77 | 0.27 |
| 1985 | 4.86 | 2.83 | 1.8 | 1.82 | 0.51 | 1.09 | 0.78 | 0.96 | 0.77 | 0.26 |
| 1984 | 4.78 | 2.77 | 1.76 | 1.79 | 0.49 | 1.07 | 0.76 | 0.96 | 0.77 | 0.25 |
| 1983 | 4.69 | 2.72 | 1.72 | 1.76 | 0.48 | 1.05 | 0.75 | 0.95 | 0.76 | 0.25 |
| 1982 | 4.61 | 2.67 | 1.67 | 1.73 | 0.47 | 1.04 | 0.73 | 0.94 | 0.76 | 0.24 |
| 1981 | 4.52 | 2.61 | 1.63 | 1.71 | 0.45 | 1.02 | 0.71 | 0.94 | 0.75 | 0.23 |
| 1980 | 4.44 | 2.56 | 1.59 | 1.68 | 0.44 | 1.01 | 0.7 | 0.93 | 0.75 | 0.23 |
| 1979 | 4.37 | 2.51 | 1.55 | 1.65 | 0.43 | 0.99 | 0.68 | 0.92 | 0.75 | 0.23 |
| 1978 | 4.29 | 2.47 | 1.51 | 1.63 | 0.42 | 0.98 | 0.67 | 0.91 | 0.74 | 0.22 |
| 1977 | 4.22 | 2.42 | 1.48 | 1.6 | 0.41 | 0.97 | 0.65 | 0.9 | 0.74 | 0.21 |
| 1976 | 4.14 | 2.37 | 1.44 | 1.58 | 0.4 | 0.95 | 0.64 | 0.9 | 0.73 | 0.21 |
| 1975 | 4.07 | 2.32 | 1.41 | 1.55 | 0.39 | 0.93 | 0.62 | 0.89 | 0.73 | 0.2 |
| 1974 | 4 | 2.27 | 1.38 | 1.52 | 0.38 | 0.92 | 0.61 | 0.88 | 0.72 | 0.2 |
| 1973 | 3.92 | 2.22 | 1.35 | 1.49 | 0.37 | 0.9 | 0.6 | 0.87 | 0.72 | 0.19 |
| 1972 | 3.84 | 2.17 | 1.32 | 1.46 | 0.36 | 0.88 | 0.58 | 0.87 | 0.71 | 0.19 |
| 1971 | 3.77 | 2.12 | 1.29 | 1.43 | 0.35 | 0.85 | 0.57 | 0.86 | 0.71 | 0.18 |
| 1970 | 3.7 | 2.07 | 1.26 | 1.4 | 0.34 | 0.83 | 0.56 | 0.85 | 0.7 | 0.18 |
| 1969 | 3.62 | 2.02 | 1.23 | 1.37 | 0.33 | 0.81 | 0.55 | 0.84 | 0.7 | 0.17 |
| 1968 | 3.55 | 1.97 | 1.2 | 1.34 | 0.32 | 0.79 | 0.53 | 0.83 | 0.69 | 0.17 |
| 1967 | 3.48 | 1.92 | 1.17 | 1.31 | 0.31 | 0.77 | 0.52 | 0.82 | 0.69 | 0.16 |
| 1966 | 3.41 | 1.88 | 1.14 | 1.28 | 0.31 | 0.75 | 0.51 | 0.81 | 0.68 | 0.16 |
| 1965 | 3.34 | 1.83 | 1.12 | 1.25 | 0.3 | 0.73 | 0.5 | 0.8 | 0.68 | 0.16 |
| 1964 | 3.27 | 1.79 | 1.09 | 1.22 | 0.29 | 0.71 | 0.49 | 0.79 | 0.67 | 0.15 |
| 1963 | 3.2 | 1.75 | 1.07 | 1.18 | 0.28 | 0.7 | 0.48 | 0.78 | 0.66 | 0.15 |
| 1962 | 3.13 | 1.72 | 1.04 | 1.15 | 0.28 | 0.69 | 0.47 | 0.78 | 0.65 | 0.15 |
| 1961 | 3.07 | 1.69 | 1.02 | 1.13 | 0.27 | 0.68 | 0.46 | 0.77 | 0.65 | 0.14 |


Comments