
Abstract
In recent years, China has emerged as a dominant player in global seafood exports, reflecting its extensive aquaculture operations and growing international demand. By 2021, China led with 8.83 million tonnes in seafood exports, underscoring a consistent upward trend in its export volumes. This surge can be attributed to advancements in aquaculture technology, favorable trade policies, and increased global consumption of seafood. Historically, China’s seafood sector has evolved from primarily domestic consumption to becoming a key exporter, influencing global market dynamics significantly.
Seafood exports (worldwide)
From 1961 to 2021, Peru’s seafood export volumes peaked at 11.1 million tonnes in 1968, reflecting its significant role in the global seafood market. Since then, Peru’s exports have declined to 46.3% of that peak, influenced by overfishing, regulatory changes, and fluctuating fish stocks. Despite this decline, Peru remains a major player, adapting with more sustainable practices and diversifying its seafood products. Overall, the trend highlights a shift from peak production to more regulated and balanced export volumes, aligning with global sustainability efforts.
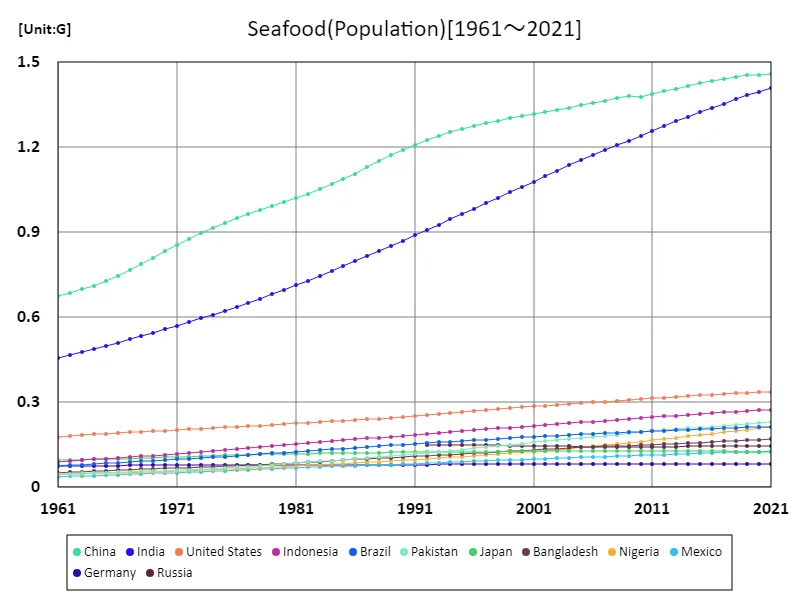
The maximum is the latest one, 1.46G of China
Seafood export volume (latest year, countries around the world)
In 2021, global seafood exports totaled 61.4 million tonnes, with China leading at 8.83 million tonnes, highlighting its dominance in the market. The average export volume across countries was 333,000 tonnes, illustrating a wide disparity in export levels. Trends show China’s significant role driven by advanced aquaculture and rising global demand. Overall, the data reflects a robust global seafood trade with China at the forefront, while other countries contribute to a diverse and balanced export landscape.
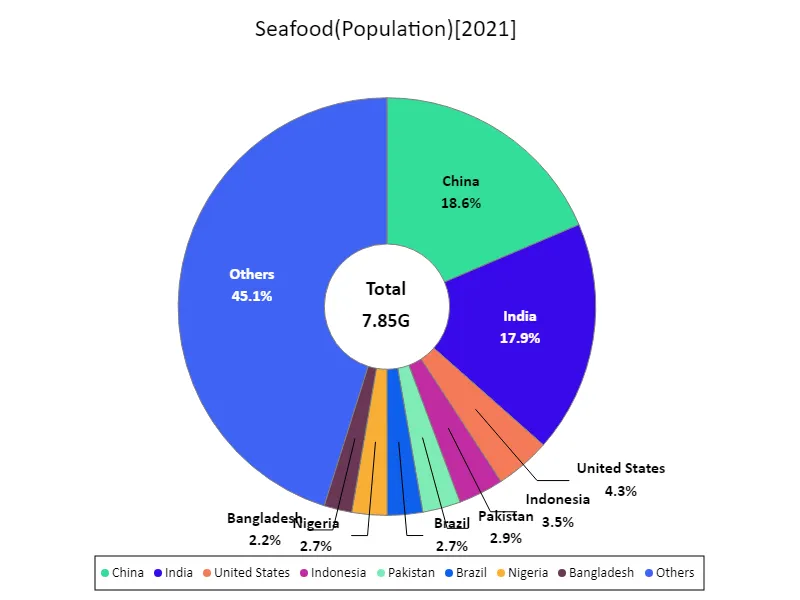
全体の最大はChinaの1.46Gで、平均は42.9M、Totalは7.85G
Seafood exports (continent)
In 2021, Asia led global agricultural and seafood exports with a maximum volume of 23 million tonnes, underscoring its critical role in international trade. This dominance reflects Asia’s extensive agricultural production, diverse seafood aquaculture, and significant export infrastructure. The trend highlights Asia’s growing influence in global markets, driven by large-scale production and increasing demand for its diverse products. Overall, Asia’s leadership in export volumes represents a shift toward greater regional contribution to global food supply chains.
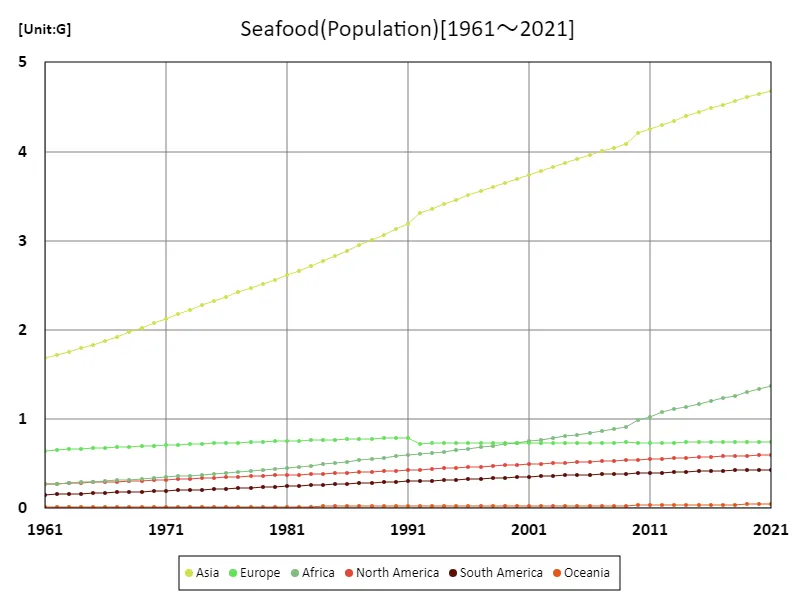
The maximum is the latest one, 4.68G of Asia
Seafood exports (latest year, continental)
In 2021, Asia was the leading region in global agricultural crop and seafood exports, with a total of 22.9 million tonnes, reflecting its substantial role in the market. The regional average was 10.2 million tonnes, contributing to a global total of 61 million tonnes. This trend indicates Asia’s significant production capabilities and export strength, driven by large-scale agriculture and advanced aquaculture. The data underscores Asia’s pivotal position in the global supply chain, balancing high export volumes with diverse regional contributions.
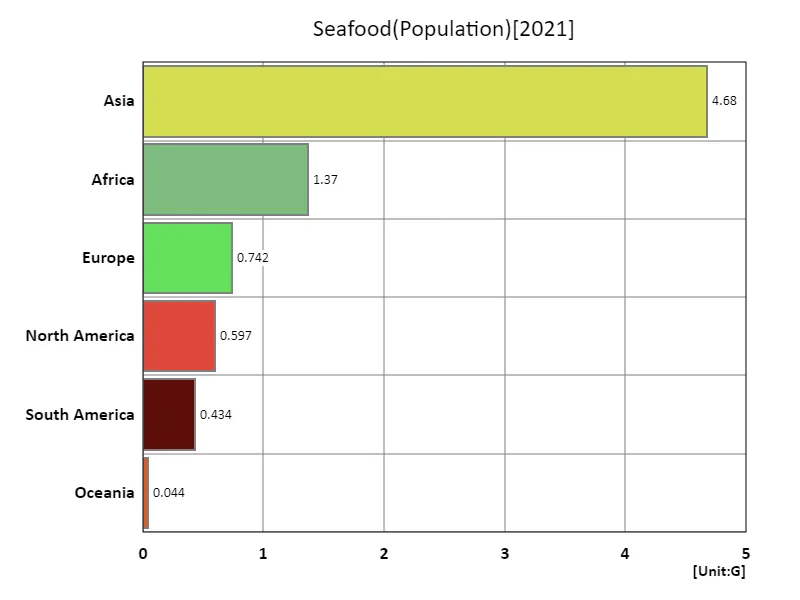
The maximum is 4.68G of Asia, the average is 1.31G, and the total is 7.86G
Main data
| Others(Seafood, Population) [G] | ||||||||||
|---|---|---|---|---|---|---|---|---|---|---|
| World | Asia | Lower-middle-income countries | Upper-middle-income countries | Southern Asia | Net Food Importing Developing Countries | Eastern Asia | China | India | Africa | |
| 2021 | 7.91 | 4.68 | 3.41 | 2.55 | 1.99 | 1.7 | 1.66 | 1.46 | 1.41 | 1.37 |
| 2020 | 7.84 | 4.65 | 3.37 | 2.54 | 1.97 | 1.67 | 1.66 | 1.46 | 1.4 | 1.34 |
| 2019 | 7.76 | 4.61 | 3.33 | 2.53 | 1.95 | 1.63 | 1.66 | 1.45 | 1.38 | 1.3 |
| 2018 | 7.68 | 4.57 | 3.28 | 2.52 | 1.93 | 1.59 | 1.66 | 1.45 | 1.37 | 1.26 |
| 2017 | 7.6 | 4.53 | 3.24 | 2.5 | 1.9 | 1.56 | 1.65 | 1.44 | 1.35 | 1.23 |
| 2016 | 7.51 | 4.48 | 3.19 | 2.48 | 1.88 | 1.53 | 1.64 | 1.43 | 1.34 | 1.2 |
| 2015 | 7.43 | 4.44 | 3.14 | 2.46 | 1.86 | 1.5 | 1.63 | 1.43 | 1.32 | 1.17 |
| 2014 | 7.34 | 4.39 | 3.1 | 2.44 | 1.83 | 1.46 | 1.62 | 1.42 | 1.31 | 1.14 |
| 2013 | 7.25 | 4.35 | 3.05 | 2.42 | 1.81 | 1.43 | 1.61 | 1.41 | 1.29 | 1.11 |
| 2012 | 7.16 | 4.3 | 3.01 | 2.4 | 1.79 | 1.4 | 1.6 | 1.4 | 1.27 | 1.08 |
| 2011 | 7.07 | 4.25 | 2.96 | 2.38 | 1.76 | 1.34 | 1.59 | 1.39 | 1.26 | 1.02 |
| 2010 | 6.99 | 4.2 | 2.91 | 2.36 | 1.74 | 1.31 | 1.58 | 1.38 | 1.24 | 0.99 |
| 2009 | 6.9 | 4.09 | 2.87 | 2.35 | 1.66 | 1.21 | 1.58 | 1.38 | 1.22 | 0.91 |
| 2008 | 6.81 | 4.04 | 2.82 | 2.33 | 1.64 | 1.19 | 1.58 | 1.37 | 1.21 | 0.89 |
| 2007 | 6.73 | 4 | 2.78 | 2.31 | 1.61 | 1.17 | 1.57 | 1.36 | 1.19 | 0.87 |
| 2006 | 6.64 | 3.96 | 2.74 | 2.29 | 1.59 | 1.14 | 1.56 | 1.36 | 1.17 | 0.85 |
| 2005 | 6.56 | 3.91 | 2.69 | 2.28 | 1.57 | 1.12 | 1.55 | 1.35 | 1.15 | 0.83 |
| 2004 | 6.48 | 3.87 | 2.65 | 2.26 | 1.55 | 1.1 | 1.54 | 1.34 | 1.14 | 0.81 |
| 2003 | 6.39 | 3.83 | 2.6 | 2.24 | 1.52 | 1.08 | 1.53 | 1.33 | 1.12 | 0.79 |
| 2002 | 6.31 | 3.78 | 2.56 | 2.23 | 1.5 | 1.06 | 1.52 | 1.32 | 1.1 | 0.77 |
| 2001 | 6.23 | 3.74 | 2.51 | 2.21 | 1.47 | 1.03 | 1.51 | 1.32 | 1.08 | 0.75 |
| 2000 | 6.15 | 3.69 | 2.47 | 2.19 | 1.45 | 1.01 | 1.51 | 1.31 | 1.06 | 0.74 |
| 1999 | 6.07 | 3.65 | 2.42 | 2.17 | 1.42 | 0.99 | 1.5 | 1.3 | 1.04 | 0.72 |
| 1998 | 5.99 | 3.6 | 2.38 | 2.16 | 1.4 | 0.97 | 1.49 | 1.29 | 1.02 | 0.7 |
| 1997 | 5.91 | 3.56 | 2.33 | 2.14 | 1.37 | 0.95 | 1.48 | 1.29 | 1 | 0.68 |
| 1996 | 5.83 | 3.51 | 2.29 | 2.12 | 1.35 | 0.93 | 1.47 | 1.28 | 0.98 | 0.67 |
| 1995 | 5.74 | 3.46 | 2.24 | 2.1 | 1.32 | 0.9 | 1.46 | 1.27 | 0.96 | 0.65 |
| 1994 | 5.66 | 3.41 | 2.2 | 2.08 | 1.29 | 0.88 | 1.45 | 1.25 | 0.95 | 0.64 |
| 1993 | 5.58 | 3.36 | 2.15 | 2.05 | 1.27 | 0.86 | 1.43 | 1.24 | 0.93 | 0.62 |
| 1992 | 5.49 | 3.31 | 2.11 | 2.03 | 1.24 | 0.85 | 1.42 | 1.23 | 0.91 | 0.61 |
| 1991 | 5.41 | 3.18 | 2.07 | 2.01 | 1.22 | 0.82 | 1.4 | 1.21 | 0.89 | 0.6 |
| 1990 | 5.32 | 3.13 | 2.02 | 1.98 | 1.19 | 0.8 | 1.38 | 1.19 | 0.87 | 0.58 |
| 1989 | 5.22 | 3.07 | 1.98 | 1.95 | 1.17 | 0.78 | 1.36 | 1.17 | 0.85 | 0.57 |
| 1988 | 5.13 | 3.01 | 1.93 | 1.92 | 1.14 | 0.76 | 1.34 | 1.15 | 0.83 | 0.55 |
| 1987 | 5.04 | 2.95 | 1.89 | 1.88 | 1.11 | 0.74 | 1.31 | 1.13 | 0.82 | 0.54 |
| 1986 | 4.95 | 2.89 | 1.84 | 1.85 | 1.09 | 0.72 | 1.29 | 1.11 | 0.8 | 0.52 |
| 1985 | 4.86 | 2.83 | 1.8 | 1.82 | 1.06 | 0.71 | 1.27 | 1.09 | 0.78 | 0.51 |
| 1984 | 4.78 | 2.77 | 1.76 | 1.79 | 1.04 | 0.69 | 1.25 | 1.07 | 0.76 | 0.49 |
| 1983 | 4.69 | 2.72 | 1.72 | 1.76 | 1.01 | 0.67 | 1.23 | 1.05 | 0.75 | 0.48 |
| 1982 | 4.61 | 2.67 | 1.67 | 1.73 | 0.99 | 0.65 | 1.21 | 1.04 | 0.73 | 0.47 |
| 1981 | 4.52 | 2.61 | 1.63 | 1.71 | 0.97 | 0.63 | 1.2 | 1.02 | 0.71 | 0.45 |
| 1980 | 4.44 | 2.56 | 1.59 | 1.68 | 0.94 | 0.62 | 1.18 | 1.01 | 0.7 | 0.44 |
| 1979 | 4.37 | 2.51 | 1.55 | 1.65 | 0.92 | 0.6 | 1.16 | 0.99 | 0.68 | 0.43 |
| 1978 | 4.29 | 2.47 | 1.51 | 1.63 | 0.9 | 0.59 | 1.15 | 0.98 | 0.67 | 0.42 |
| 1977 | 4.22 | 2.42 | 1.48 | 1.6 | 0.88 | 0.57 | 1.13 | 0.97 | 0.65 | 0.41 |
| 1976 | 4.14 | 2.37 | 1.44 | 1.58 | 0.86 | 0.56 | 1.12 | 0.95 | 0.64 | 0.4 |
| 1975 | 4.07 | 2.32 | 1.41 | 1.55 | 0.83 | 0.55 | 1.1 | 0.93 | 0.62 | 0.39 |
| 1974 | 4 | 2.27 | 1.38 | 1.52 | 0.82 | 0.53 | 1.08 | 0.92 | 0.61 | 0.38 |
| 1973 | 3.92 | 2.22 | 1.35 | 1.49 | 0.8 | 0.52 | 1.06 | 0.9 | 0.6 | 0.37 |
| 1972 | 3.84 | 2.17 | 1.32 | 1.46 | 0.78 | 0.51 | 1.03 | 0.88 | 0.58 | 0.36 |
| 1971 | 3.77 | 2.12 | 1.29 | 1.43 | 0.76 | 0.49 | 1.01 | 0.85 | 0.57 | 0.35 |
| 1970 | 3.7 | 2.07 | 1.26 | 1.4 | 0.74 | 0.48 | 0.98 | 0.83 | 0.56 | 0.34 |
| 1969 | 3.62 | 2.02 | 1.23 | 1.37 | 0.73 | 0.47 | 0.96 | 0.81 | 0.55 | 0.33 |
| 1968 | 3.55 | 1.97 | 1.2 | 1.34 | 0.71 | 0.46 | 0.93 | 0.79 | 0.53 | 0.32 |
| 1967 | 3.48 | 1.92 | 1.17 | 1.31 | 0.69 | 0.45 | 0.91 | 0.77 | 0.52 | 0.31 |
| 1966 | 3.41 | 1.88 | 1.14 | 1.28 | 0.68 | 0.44 | 0.89 | 0.75 | 0.51 | 0.31 |
| 1965 | 3.34 | 1.83 | 1.12 | 1.25 | 0.66 | 0.42 | 0.87 | 0.73 | 0.5 | 0.3 |
| 1964 | 3.27 | 1.79 | 1.09 | 1.22 | 0.65 | 0.41 | 0.85 | 0.71 | 0.49 | 0.29 |
| 1963 | 3.2 | 1.75 | 1.07 | 1.18 | 0.63 | 0.4 | 0.83 | 0.7 | 0.48 | 0.28 |
| 1962 | 3.13 | 1.72 | 1.04 | 1.15 | 0.62 | 0.39 | 0.82 | 0.69 | 0.47 | 0.28 |
| 1961 | 3.07 | 1.69 | 1.02 | 1.13 | 0.61 | 0.38 | 0.81 | 0.68 | 0.46 | 0.27 |


Comments