Abstract
In recent years, global meat production has been influenced by growing populations and rising demand, particularly in developing countries. China has consistently led as the largest producer of farm meat, reaching 11 million tons in 2021, driven by its massive population and expanding middle class. The U.S. and Brazil also rank among the top producers, with their meat industries bolstered by large-scale farming and exports. Over time, global meat consumption has shifted towards poultry and pork, while beef production has faced challenges like environmental concerns and changing dietary habits. Imports and exports are increasingly concentrated in a few key countries, reflecting both regional demand and trade policies.
Meat import volume (worldwide)
Global meat imports have seen significant growth from 1961 to 2021, with China being the dominant player. In 2020, China reached a peak of 11.8 million tons, representing the highest import volume globally. As of recent data, China’s imports are at 92.7% of this peak, indicating sustained demand despite fluctuations. This trend reflects China’s growing middle class and changing dietary preferences, particularly for pork and beef. Other major importers, like the U.S., the EU, and Japan, also play key roles. The global meat trade has become increasingly concentrated, with a few nations driving demand and shaping international market dynamics.
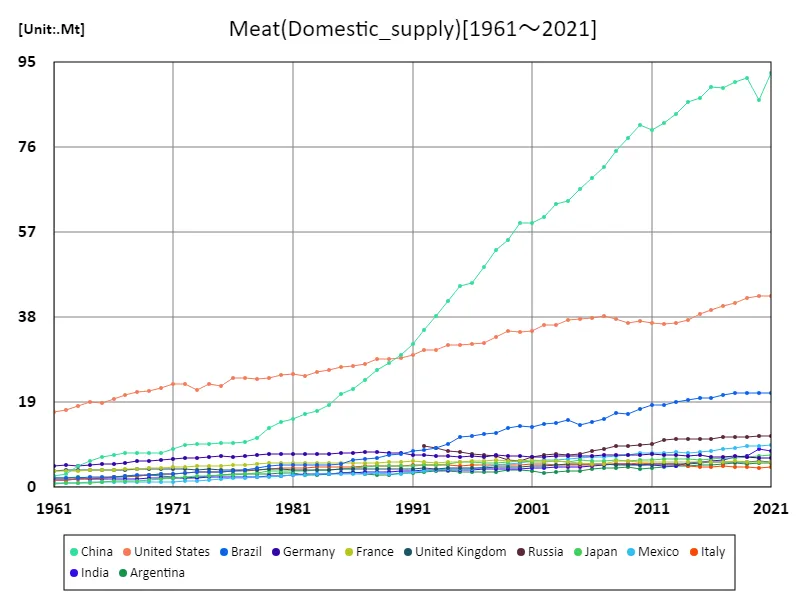
The maximum is the latest one, 92.5Mt of China
Meat imports (latest year, countries around the world)
In 2021, global agricultural meat imports totaled 53.7 million tons, with China as the largest importer at 11 million tons, far surpassing the global average of 290,000 tons per country. This reflects China’s strong demand for meat, driven by its large population and shifting dietary preferences, particularly for pork and beef. Other key importers include the U.S., the EU, and Japan, which also contribute significantly to global meat trade. Trends indicate a concentration of imports in a few major markets, with China continuing to dominate, while overall import volumes have steadily risen due to growing global demand and urbanization.
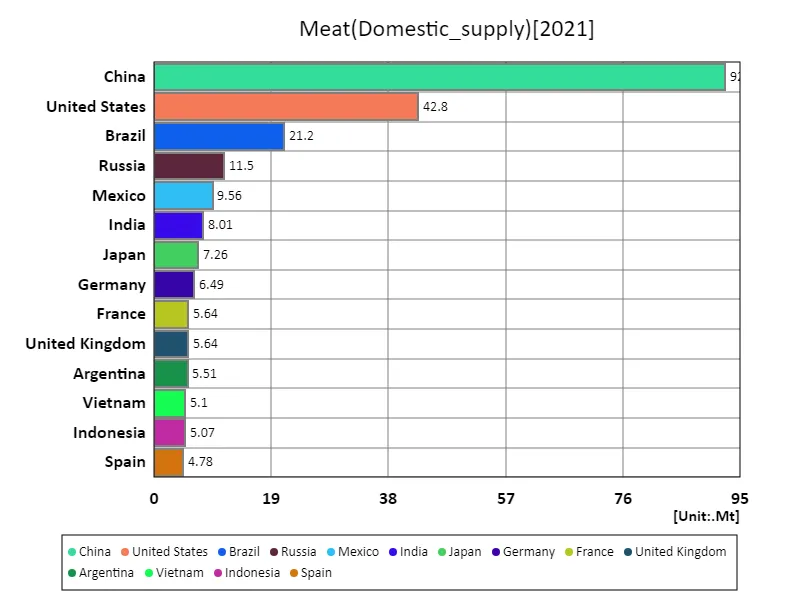
The maximum is 92.5Mt of China, the average is 1.86Mt, and the total is 341Mt
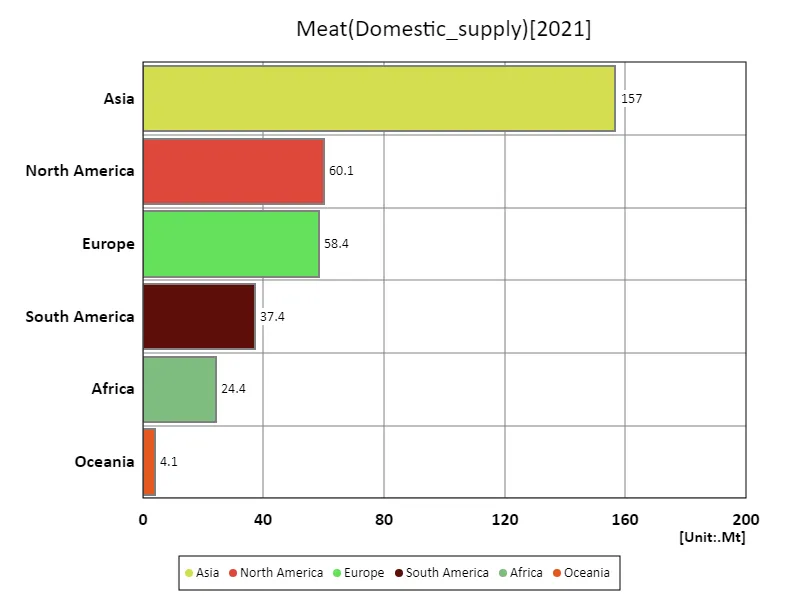
Meat imports (continent)
In 2021, Asia emerged as the largest importer of agricultural meat, accounting for 22.7 million tons, the highest value globally. This trend reflects the region’s growing demand driven by large populations, increasing urbanization, and shifting dietary preferences. China, as the dominant force in Asia, continues to lead meat imports, especially pork and beef. Other key importers in the region include Japan, South Korea, and the Philippines. Overall, the concentration of meat imports in Asia highlights the region’s critical role in global agricultural trade, with rising consumption trends expected to continue due to economic growth and changing food habits.
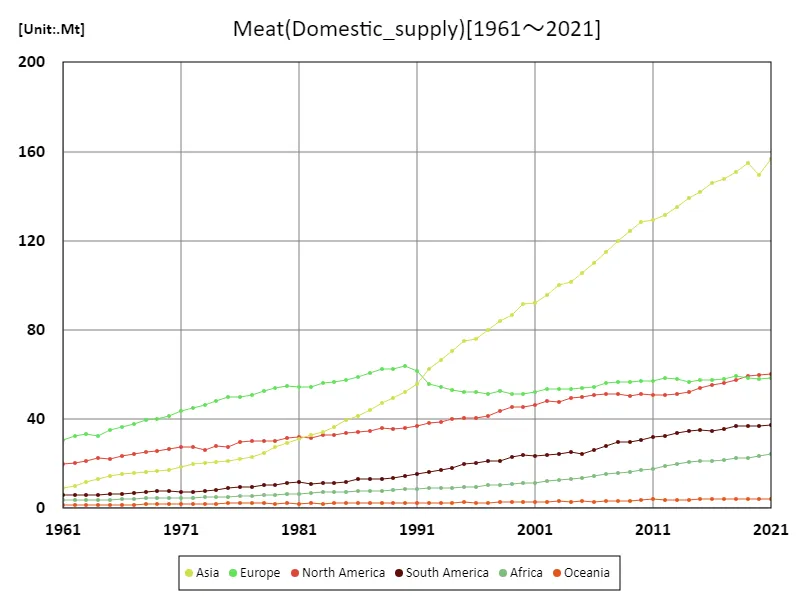
The maximum is the latest one, 157Mt of Asia
Meat import volume (latest year, continental)
In 2021, Asia accounted for the largest share of global agricultural meat imports, reaching 22.6 million tons, well above the regional average of 8.91 million tons. This highlights Asia’s dominant role in global meat trade, driven by rapidly growing economies, urbanization, and evolving dietary preferences, particularly in countries like China, Japan, and South Korea. The total global meat import volume for 2021 was 53.4 million tons. The trends reflect increased demand for protein-rich diets across Asia, with expectations for continued growth as income levels rise and consumer preferences shift towards higher meat consumption.
The maximum is 157Mt of Asia, the average is 56.8Mt, and the total is 341Mt
Main data
| Supply(Meat, Domestic_supply) [Mt] | ||||||||||
|---|---|---|---|---|---|---|---|---|---|---|
| World | Upper-middle-income countries | Asia | High-income countries | Eastern Asia | Americas | China | North America | Europe | Lower-middle-income countries | |
| 2021 | 340.96 | 170.58 | 156.5 | 114.55 | 104.78 | 97.48 | 92.53 | 60.09 | 58.44 | 47.67 |
| 2020 | 331.95 | 162.94 | 149.48 | 114.16 | 98.47 | 96.62 | 86.55 | 59.85 | 58.18 | 46.79 |
| 2019 | 336.27 | 167.28 | 154.7 | 113.74 | 103.2 | 96.21 | 91.56 | 59.35 | 58.49 | 47.32 |
| 2018 | 330.73 | 163.82 | 150.7 | 112.39 | 101.95 | 94.27 | 90.59 | 57.56 | 59.11 | 47.33 |
| 2017 | 323.18 | 161.3 | 147.56 | 109.68 | 100.34 | 92.1 | 89.34 | 56.32 | 57.87 | 45.23 |
| 2016 | 319 | 159.45 | 145.98 | 109.16 | 100.13 | 89.99 | 89.49 | 55.17 | 57.74 | 43.54 |
| 2015 | 313.67 | 156.93 | 141.85 | 107.4 | 97.5 | 89.06 | 87.1 | 53.94 | 57.52 | 42.58 |
| 2014 | 307.48 | 154.82 | 139.11 | 104.79 | 96.49 | 86.67 | 86.23 | 52.09 | 56.83 | 41.1 |
| 2013 | 301.97 | 151.17 | 135.22 | 104.64 | 93.68 | 85.09 | 83.43 | 51.38 | 58.03 | 39.83 |
| 2012 | 295.92 | 146.79 | 131.49 | 104.51 | 91.3 | 83.34 | 81.35 | 50.89 | 58.3 | 38.45 |
| 2011 | 290.77 | 143.22 | 129.27 | 104.55 | 89.68 | 82.77 | 79.91 | 50.84 | 57.07 | 37.82 |
| 2010 | 288.35 | 142.12 | 128.52 | 104.47 | 90.51 | 81.78 | 80.99 | 51.2 | 57.23 | 36.65 |
| 2009 | 280.91 | 136.7 | 124.43 | 103.54 | 87.2 | 80.3 | 77.98 | 50.51 | 56.69 | 35.49 |
| 2008 | 276.67 | 133.31 | 119.67 | 104.34 | 84.36 | 81.03 | 75.13 | 51.19 | 56.85 | 33.89 |
| 2007 | 268.91 | 126.6 | 114.96 | 104.85 | 80.72 | 79.27 | 71.55 | 51.47 | 56.01 | 32.54 |
| 2006 | 258.55 | 120.96 | 110.02 | 102.54 | 78.2 | 76.92 | 69.18 | 50.65 | 54.17 | 30.32 |
| 2005 | 250.87 | 114.98 | 105.67 | 101.77 | 75.56 | 74.42 | 66.65 | 49.86 | 53.9 | 29.37 |
| 2004 | 245.27 | 111.95 | 101.41 | 100.47 | 72.42 | 74.5 | 64.07 | 49.35 | 53.37 | 28.34 |
| 2003 | 241.5 | 109.95 | 100.04 | 100.06 | 72.22 | 72.09 | 63.43 | 47.87 | 53.66 | 27.11 |
| 2002 | 235.67 | 106.01 | 95.52 | 99.42 | 69.09 | 71.75 | 60.44 | 47.9 | 53.37 | 25.98 |
| 2001 | 228.47 | 102.76 | 92.27 | 97.13 | 67.31 | 69.72 | 59.03 | 46.11 | 52.08 | 24.63 |
| 2000 | 226.55 | 101.85 | 91.78 | 96.67 | 67.55 | 69.39 | 59.06 | 45.65 | 51.14 | 24.2 |
| 1999 | 220.15 | 96.65 | 86.87 | 95.26 | 63.59 | 68.25 | 55.35 | 45.41 | 51.25 | 23.62 |
| 1998 | 214.7 | 93.77 | 83.82 | 93.5 | 60.72 | 64.93 | 53.09 | 43.52 | 52.77 | 23.04 |
| 1997 | 206.41 | 89.66 | 80.02 | 89.79 | 56.95 | 62.37 | 49.25 | 41.37 | 51.13 | 22.75 |
| 1996 | 201.49 | 85.31 | 75.86 | 90.09 | 53.55 | 61.04 | 45.66 | 40.69 | 52.31 | 21.93 |
| 1995 | 199.3 | 84.54 | 74.87 | 88.89 | 52.61 | 60.1 | 44.9 | 40.42 | 52.16 | 21.86 |
| 1994 | 193.75 | 80.37 | 70.73 | 87.95 | 48.81 | 58.35 | 41.64 | 40.22 | 52.86 | 21.57 |
| 1993 | 187.99 | 76.34 | 66.48 | 86.71 | 45.22 | 55.71 | 38.19 | 38.72 | 54.32 | 21.03 |
| 1992 | 184.55 | 73.91 | 62.57 | 85.49 | 42.21 | 54.55 | 35.19 | 38.47 | 55.84 | 21.1 |
| 1991 | 181.03 | 78.81 | 55.55 | 82.77 | 38.77 | 52.59 | 32.12 | 37.12 | 61.55 | 15.37 |
| 1990 | 177.51 | 77.17 | 52.17 | 81.74 | 36.05 | 50.54 | 29.62 | 36.03 | 63.72 | 14.68 |
| 1989 | 172.05 | 73.66 | 49.45 | 80.26 | 34.01 | 49.37 | 27.72 | 35.61 | 62.68 | 14.29 |
| 1988 | 169.09 | 71.38 | 47.36 | 80.08 | 32.42 | 49.07 | 26.33 | 35.81 | 62.31 | 13.86 |
| 1987 | 162.87 | 67.42 | 44.16 | 78.31 | 29.71 | 47.68 | 23.88 | 34.7 | 60.83 | 13.48 |
| 1986 | 157.23 | 64.4 | 41.34 | 76.27 | 27.48 | 47.26 | 21.96 | 34.22 | 58.67 | 12.81 |
| 1985 | 152.43 | 61.33 | 39.39 | 75.06 | 26.15 | 45.57 | 20.81 | 33.77 | 57.67 | 12.39 |
| 1984 | 147.05 | 57.82 | 36.46 | 73.47 | 23.59 | 44.29 | 18.47 | 33.06 | 56.83 | 12.17 |
| 1983 | 143.37 | 55.34 | 34.25 | 72.59 | 21.94 | 43.87 | 17 | 32.7 | 56.02 | 11.89 |
| 1982 | 139.02 | 52.95 | 32.82 | 71.17 | 21.06 | 42.62 | 16.34 | 31.5 | 54.45 | 11.34 |
| 1981 | 137.58 | 51.99 | 31.03 | 71.34 | 19.95 | 43.39 | 15.36 | 31.82 | 54.49 | 10.72 |
| 1980 | 135.39 | 50.59 | 29.47 | 71.2 | 19.19 | 42.58 | 14.7 | 31.31 | 54.8 | 10.16 |
| 1979 | 130.93 | 48.24 | 27.67 | 69.7 | 17.81 | 40.95 | 13.27 | 30.28 | 54.16 | 9.62 |
| 1978 | 125.78 | 45.18 | 24.58 | 68.05 | 15.15 | 40.28 | 11.05 | 30.03 | 52.59 | 9.25 |
| 1977 | 120.92 | 42.65 | 22.78 | 66.36 | 13.91 | 39.7 | 10.21 | 30.13 | 50.59 | 8.82 |
| 1976 | 118.61 | 41.82 | 21.94 | 65.35 | 13.41 | 39.08 | 9.99 | 29.74 | 49.84 | 8.46 |
| 1975 | 114.97 | 41.47 | 21.43 | 62.47 | 13.16 | 36.5 | 9.92 | 27.59 | 49.73 | 8.12 |
| 1974 | 111.94 | 39.15 | 20.86 | 61.9 | 12.79 | 36.25 | 9.68 | 27.88 | 48.22 | 8.07 |
| 1973 | 107.82 | 37.69 | 20.38 | 59.54 | 12.62 | 34.11 | 9.57 | 26.35 | 46.53 | 7.87 |
| 1972 | 106.8 | 36.34 | 19.68 | 60.14 | 12.27 | 35.08 | 9.44 | 27.57 | 45.17 | 7.62 |
| 1971 | 103.34 | 34.43 | 18.45 | 58.72 | 11.14 | 34.73 | 8.59 | 27.38 | 43.56 | 7.5 |
| 1970 | 99.16 | 32.67 | 17.05 | 56.45 | 9.89 | 34.16 | 7.58 | 26.46 | 41.53 | 7.3 |
| 1969 | 96.07 | 32.19 | 16.64 | 54.06 | 9.64 | 33.18 | 7.57 | 25.52 | 39.86 | 7.17 |
| 1968 | 94.31 | 31.87 | 16.3 | 52.87 | 9.52 | 32.5 | 7.67 | 25.18 | 39.38 | 6.96 |
| 1967 | 91.16 | 30.87 | 16.02 | 51.06 | 9.5 | 31.32 | 7.71 | 24.49 | 38.01 | 6.71 |
| 1966 | 87.3 | 29.4 | 15.3 | 48.98 | 8.95 | 29.83 | 7.24 | 23.29 | 36.46 | 6.5 |
| 1965 | 83.54 | 27.95 | 14.28 | 47.01 | 8.19 | 28.55 | 6.68 | 22.33 | 35.17 | 6.28 |
| 1964 | 79.57 | 24.86 | 13.24 | 46.43 | 7.35 | 28.42 | 5.91 | 22.47 | 32.46 | 6.05 |
| 1963 | 78 | 25.36 | 11.68 | 44.55 | 5.96 | 27.59 | 4.68 | 21.42 | 33.45 | 5.88 |
| 1962 | 74.1 | 23.06 | 9.88 | 43.08 | 4.28 | 26.52 | 3.06 | 20.43 | 32.49 | 5.79 |
| 1961 | 70.65 | 21.43 | 9.01 | 41.44 | 3.63 | 25.77 | 2.57 | 19.9 | 30.82 | 5.69 |


Comments