
Abstract
In recent years, U.S. grain production has fluctuated based on weather conditions, technological advances, and market demands. Corn, the largest crop, reached its peak of 349 million tons (Mt) in 2022, driven by high demand for ethanol and livestock feed. Wheat and soybean production also show variability, influenced by global demand and domestic uses. Export volumes remain strong, particularly for corn and soybeans, with the U.S. as a major global supplier. Animal feed production is closely tied to grain outputs, with a large portion of grains like corn used for livestock consumption.
Production (by vegetables)
U.S. grain production has shown significant growth from 1961 to 2022, with corn leading the way. The peak production of 412 million tons (Mt) in 2016 highlights the success of modern agricultural techniques, such as improved seed varieties and technology. Since then, corn production has remained strong but currently stands at 84.6% of its peak level. This decline is attributed to fluctuating weather patterns, changes in land use, and market conditions. Other grains, like soybeans and wheat, have also seen varying trends, reflecting domestic demand and global market shifts.

The maximum is 15.9Mt[2014] of Production volume, and the current value is about 64.3%
Yield(by vegetable)
U.S. grain production for food use has evolved significantly from 1961 to 2021. Wheat, with a peak of 29.6 million tons (Mt) in 2021, is at the forefront, meeting both domestic consumption and export demand. The trend has been marked by steady growth in wheat production, driven by advances in crop management and a focus on meeting global food needs. While wheat remains at its peak, other grains like corn and rice have also played significant roles in food production. The U.S. has increasingly focused on improving yields to maintain food security amid changing climate conditions and market demands.

The maximum is 99.1t/ha[2020] of Tomato, and the current value is about 96.5%
Land use (by vegetables)
U.S. grain exports have shown steady growth since 1961, with corn being the dominant export. The peak export volume for corn was 70.6 million tons (Mt), far exceeding the average of 13.2Mt, reflecting global demand, particularly for livestock feed and ethanol production. The total grain export volume in 1961 was 106Mt. Over the decades, U.S. exports have remained a crucial part of the global grain market, with fluctuations influenced by international trade agreements, weather patterns, and competition from other producing nations. Corn continues to lead, though other grains like wheat and soybeans have also seen growing export shares.
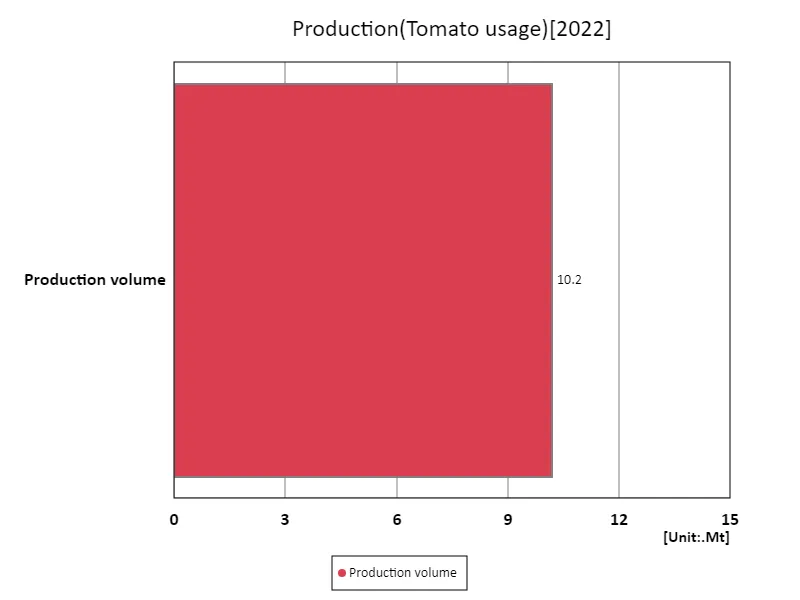
The maximum is 10.2Mt of Production volume, the average is 10.2Mt, and the total is 10.2Mt
Tomato usage
Since 1961, U.S. grain production for animal feed has been a significant part of the agricultural sector, with corn leading the way. The peak of 156 million tons (Mt) of corn for animal feed reflects the growing demand for livestock and poultry production. Over the years, the share of grains used for animal feed has fluctuated in response to changes in livestock numbers, feed efficiency, and market conditions. While corn remains the dominant grain used for feed, other grains, such as soybeans and wheat, have also contributed to animal nutrition, adapting to shifts in production and consumption patterns.

The maximum is 15.9Mt[2014] of Production volume, and the current value is about 64.3%


Comments