Abstract
The harvested area of hay and haylage in American agriculture is prominent even on a global scale, reaching 29.5 miles-on-acres in 2023 data. Considering past trends, the United States has a high demand for hay as grain and livestock feed, and production has increased accordingly. In particular, there is a high demand for it as feed for cattle and sheep, which has led to an expansion of the harvested area. In addition, there is a growing demand for haylage (blue feed) as livestock feed, and it is being actively cultivated by farmers. Advances and efficiency in agricultural technology have also contributed to the increase in the harvested area, and productivity has improved through mechanization and breeding. These characteristics also show that American agriculture has global leadership in the production of hay and haylage, and has a production system in place to meet demand.
Hay and haylage all classes
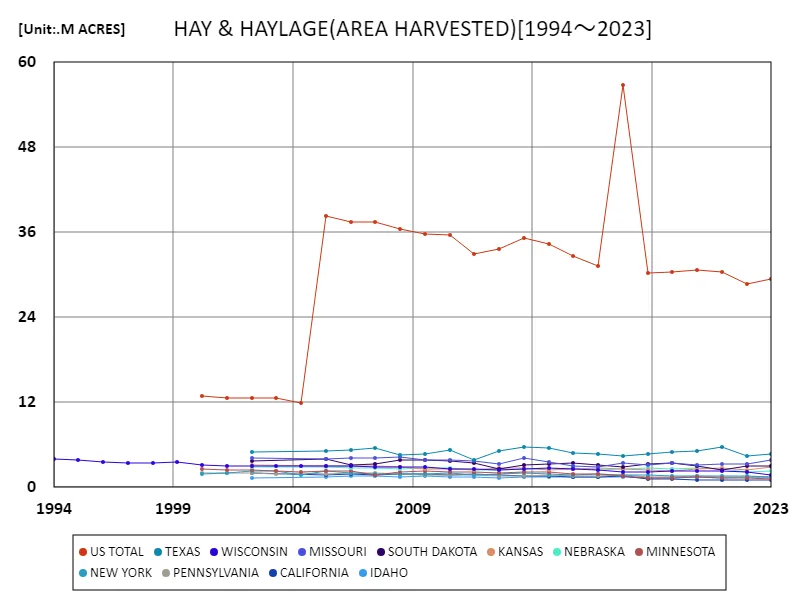
Based on data from 1994 to 2023, the harvested area of hay and haylage in the United States has fluctuated. At its peak in 2017, the total harvested area reached 56.9 miles-on-acres, but has since declined slightly, currently at 51.8%. There are several factors behind this fluctuation. First, technological innovation and efficiency in agriculture have made it possible to harvest more from the same area. Changes in demand may also be a factor, with a decrease in demand for livestock feed such as cattle and sheep, and the emergence of alternatives. In addition, factors such as climate change and natural disasters may also affect the harvested area. Overall, the harvested area of hay and haylage in the United States has changed over time, indicating a combination of demand, technology, and environmental factors.


The maximum is 56.9M ACRES[2017] of US TOTAL, and the current value is about 51.8%
Hay and haylage all classes (each state)
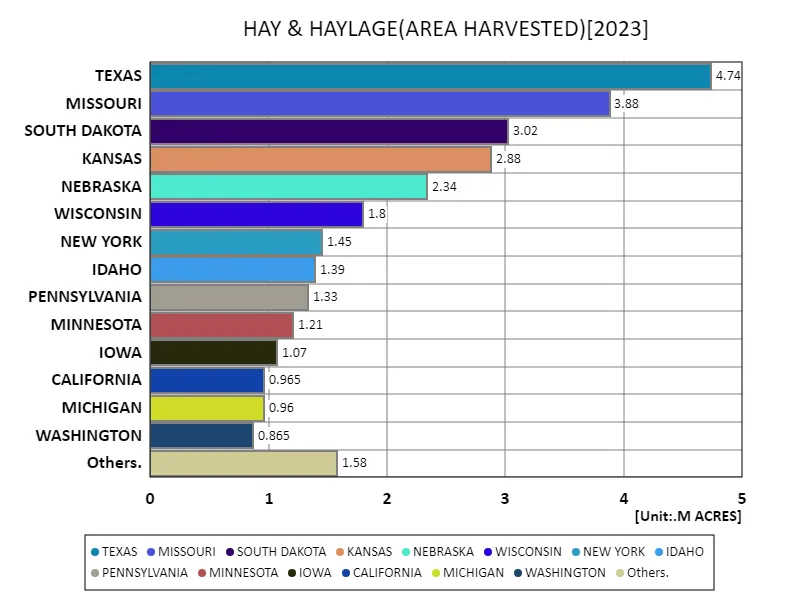
Looking at the latest 2023 data for all classes of U.S. crop hay and haylage, Texas has the largest harvested area with 4.74 miles-on-acres. The average harvested area is 1.73 miles-on-acres, bringing the total harvested area to 29.5 miles-on-acres. These figures suggest that U.S. hay and haylage production varies widely across regions, with Texas being the epicenter of production. The average harvested area of 1.73 miles-on-acres may suggest that some states have large-scale production, while others have relatively small-scale production. The total harvested area of 29.5 miles-on-acres further indicates the importance of hay and haylage across the U.S., suggesting widespread production to meet demand for livestock feed.


The maximum is 4.74M ACRES of TEXAS, the average is 1.73M ACRES, and the total is 29.5M ACRES
Hay and Haylage All Classes (latest year, each state)
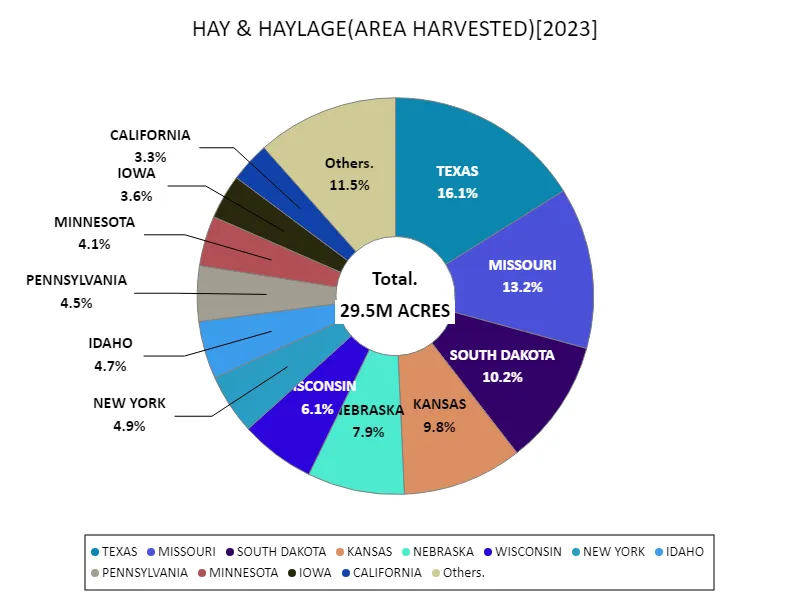
Looking at the data for 2023, the largest harvested area in all classes of agricultural hay and haylage in the United States is in Texas, reaching 4.74 miles-on-acres, which is the current maximum. This suggests that Texas is the center of hay and haylage production and is produced on a large scale. In addition, while the average harvested area for the entire United States is unknown, it is expected that the large harvested area in Texas will raise the overall value. As a trend so far, American agriculture has improved productivity through technological advances and efficiency, and production has been carried out in response to demand. There is a strong demand for hay as livestock feed for cattle and sheep, and the production of hay and haylage has increased accordingly. In addition, production varies depending on the climate and regional conditions. In general, the production of agricultural hay and haylage in the United States tends to expand, supported by demand and technological advances, although there are regional differences.


The maximum is 4.74M ACRES of TEXAS, the average is 1.73M ACRES, and the total is 29.5M ACRES
Main data
| HAY & HAYLAGE(ALL CLASSES, ALL PRODUCTION PRACTICES, ALL UTILIZATION PRACTICES, AREA HARVESTED, UNITED STATES) [M ACRES] | ||||||||||
|---|---|---|---|---|---|---|---|---|---|---|
| US TOTAL | TEXAS | MISSOURI | SOUTH DAKOTA | OKLAHOMA | MONTANA | NORTH DAKOTA | KANSAS | NEBRASKA | WISCONSIN | |
| 2023 | 29.47 | 4.74 | 3.88 | 3.02 | 2.88 | 2.34 | 1.8 | |||
| 2022 | 28.72 | 4.45 | 3.26 | 2.95 | 2.77 | 2.71 | 2.53 | 2.4 | 2.16 | 2.12 |
| 2021 | 30.34 | 5.64 | 3.24 | 2.43 | 2.74 | 2.6 | 2.25 | |||
| 2020 | 30.68 | 5.1 | 3.15 | 3.06 | 2.63 | 2.77 | 2.36 | |||
| 2019 | 30.39 | 4.95 | 3.49 | 3.43 | 2.3 | 2.52 | 2.33 | |||
| 2018 | 30.24 | 4.75 | 3.17 | 3.33 | 2.4 | 2.67 | 2.21 | |||
| 2017 | 56.86 | 4.44 | 3.37 | 2.85 | 2.84 | 2.68 | 2.58 | 2.57 | 2.54 | 2.17 |
| 2016 | 31.19 | 4.72 | 2.92 | 3.11 | 2.7 | 2.4 | 2.4 | |||
| 2015 | 32.69 | 4.84 | 3.04 | 3.45 | 2.54 | 2.72 | 2.6 | |||
| 2014 | 34.41 | 5.55 | 3.54 | 3.28 | 2.42 | 2.61 | 2.7 | |||
| 2013 | 35.21 | 5.74 | 4.09 | 3.09 | 2.78 | 2.53 | 2.65 | |||
| 2012 | 33.64 | 5.07 | 3.35 | 2.62 | 2.71 | 2.27 | 2.17 | 2.74 | 2.49 | 2.4 |
| 2011 | 32.88 | 3.79 | 3.77 | 3.43 | 2.48 | 2.5 | 2.58 | |||
| 2010 | 35.69 | 5.3 | 3.86 | 3.66 | 2.6 | 2.71 | 2.65 | |||
| 2009 | 35.76 | 4.74 | 3.91 | 3.87 | 2.62 | 2.72 | 2.8 | |||
| 2008 | 36.51 | 4.55 | 4.26 | 3.9 | 2.84 | 2.59 | 2.9 | |||
| 2007 | 37.49 | 5.5 | 4.11 | 3.24 | 3.23 | 2.82 | 2.53 | 3.03 | 2.67 | 2.85 |
| 2006 | 37.51 | 5.23 | 4.16 | 3.13 | 3.08 | 2.77 | 3 | |||
| 2005 | 38.26 | 5.12 | 4.02 | 4.06 | 2.95 | 2.87 | 3.05 | |||
| 2004 | 11.96 | 3 | ||||||||
| 2003 | 12.56 | 3 | ||||||||
| 2002 | 12.6 | 4.98 | 4.14 | 3.66 | 3.08 | 2.59 | 2.83 | 3.09 | 2.86 | 3.05 |
| 2001 | 12.55 | 3 | ||||||||
| 2000 | 12.83 | 3.1 | ||||||||
| 1999 | 3.6 | |||||||||
| 1998 | 3.5 | |||||||||
| 1997 | 3.5 | |||||||||
| 1996 | 3.51 | |||||||||
| 1995 | 3.9 | |||||||||
| 1994 | 4 | |||||||||


Comments