Abstract
American agriculture is a global leader in terms of rice harvest area. According to 2023 data, the US rice harvest area is about 2.85 million acres (Macres), the largest in the world. This figure shows how important a role the US plays in rice production. American rice agriculture has been experiencing sustained growth for many years, and the introduction of advanced technology and efficient production methods has expanded the harvest area. In addition, the climatic conditions and vastness of land in the US are also cited as factors that make it suitable for rice production. In addition, agricultural policies and support for technological innovation are also important factors that support the productivity of American rice. The combination of these factors has led to the US rice harvest area reaching a level that is attracting global attention.
All classes
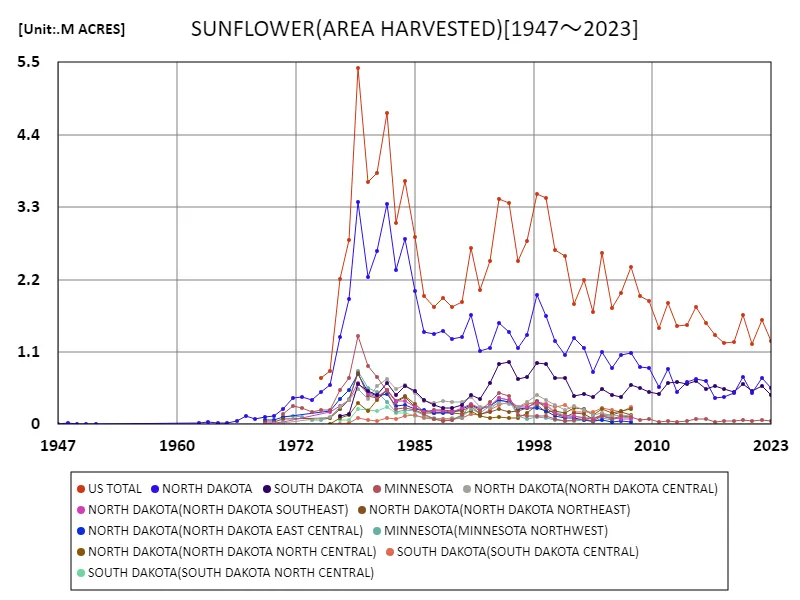
The long-term trends in American rice production are interesting. Considering data from 1895 to 2023, the area harvested for rice in the United States has fluctuated but generally increased. It reached a peak of 3.79 million acres (Macres) in 1981, but has since declined somewhat and is currently about 2.85 Macres, which is 75.2% of its peak. This fluctuation is influenced by many factors, including the evolution of agricultural techniques and production methods, climate change, and economic conditions. Another factor is the decrease in farmland in some areas due to urbanization and land use changes. However, American agriculture is always innovative and seeks sustainable productivity. For this reason, rice production may increase again in the future due to technological innovation and the promotion of sustainable agriculture.


The maximum is 5.41M ACRES[1979] of US TOTAL, and the current value is about 23.3%
All classes (each state)
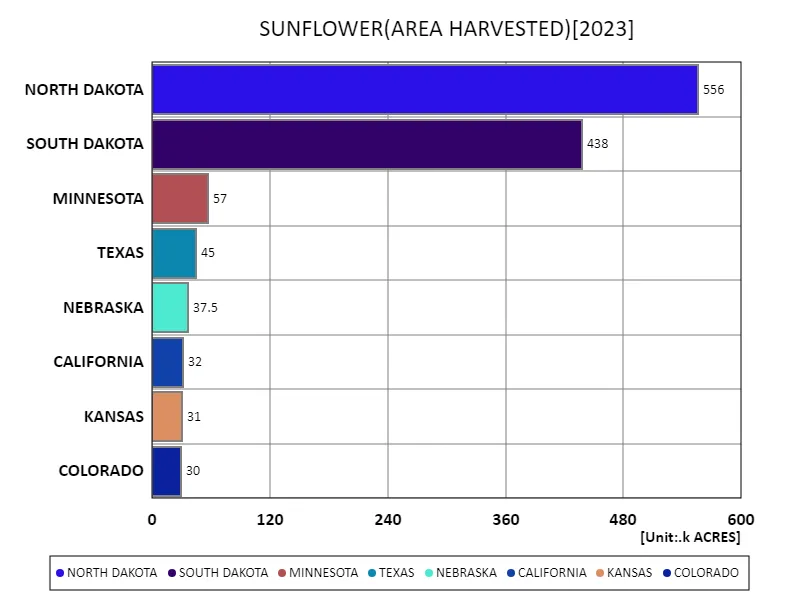
The production of agricultural rice in the United States is remarkable for its diversity and regional characteristics. Looking at the data for 2023, Arkansas has the largest amount of rice at 1.42 million acres (Macres), with the total harvested area reaching 2.84 Macres. From this data, it is clear that rice production varies by region, with major production areas in each region. The average area is 473 thousand acres (kacres), which suggests that the balance of agricultural land use in each region is maintained. American agriculture is produced in many states, each of which produces based on its own climatic conditions and land use forms. In addition, technological innovation and sustainable agricultural efforts also play an important role in improving rice productivity. Due to these regional characteristics and technological advances, rice production in the United States is stable and is expected to continue to grow sustainably in the future.


The maximum is 556k ACRES of NORTH DAKOTA, the average is 153k ACRES, and the total is 1.23M ACRES
All Classes (latest year, each state)
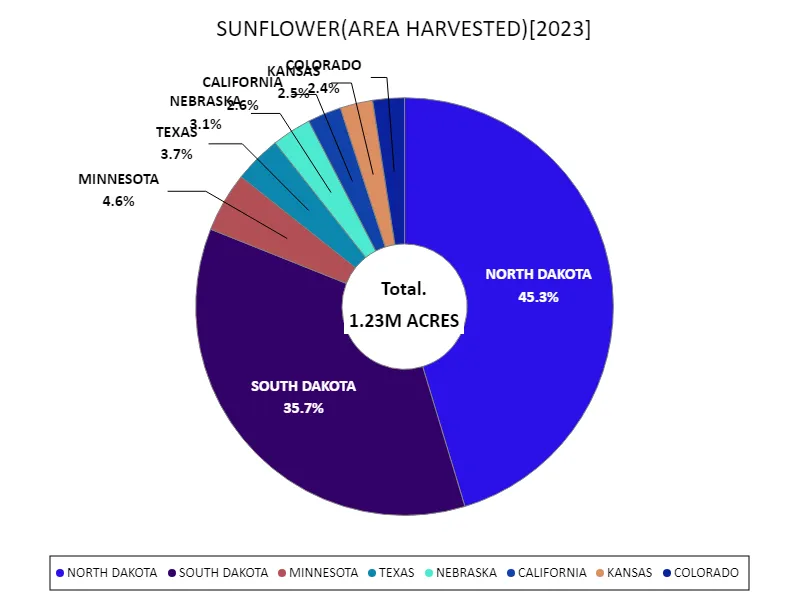
The data for 2023 is interesting for the production of rice in the United States. The largest harvested area this year was 1.42 million acres (Macres) in Arkansas, which is the current peak. This data shows that Arkansas is a particularly important region for rice production. The fact that rice production is the largest ever in the United States as a whole indicates that the evolution of agricultural technology and production methods and efforts toward sustainable agriculture have been successful. It is also possible that differences in regional characteristics, climatic conditions, and agricultural policies affect rice production and distribution. In the future, rice production is likely to increase steadily as efforts to promote sustainable agriculture and technological innovation continue.


The maximum is 556k ACRES of NORTH DAKOTA, the average is 153k ACRES, and the total is 1.23M ACRES
Main data
| SUNFLOWER(ALL CLASSES, ALL PRODUCTION PRACTICES, ALL UTILIZATION PRACTICES, AREA HARVESTED, UNITED STATES) [M ACRES] | ||||||||||
|---|---|---|---|---|---|---|---|---|---|---|
| US TOTAL | NORTH DAKOTA | SOUTH DAKOTA | SOUTH DAKOTA(SOUTH DAKOTA CENTRAL SULLY) | MINNESOTA | NORTH DAKOTA(NORTH DAKOTA SOUTH CENTRAL EMMONS) | NEBRASKA | COLORADO | SOUTH DAKOTA(SOUTH DAKOTA SOUTH CENTRAL LYMAN) | NORTH DAKOTA(NORTH DAKOTA SOUTHWEST ADAMS) | |
| 2023 | 1.26 | 0.56 | 0.44 | 0.06 | 0.04 | 0.03 | ||||
| 2022 | 1.59 | 0.7 | 0.59 | 0.09 | 0.07 | 0.06 | 0.05 | 0.05 | 0.04 | 0.04 |
| 2021 | 1.22 | 0.47 | 0.5 | 0.05 | 0.04 | 0.05 | ||||
| 2020 | 1.66 | 0.72 | 0.61 | 0.07 | 0.05 | 0.05 | ||||
| 2019 | 1.25 | 0.48 | 0.49 | 0.05 | 0.03 | 0.08 | ||||
| 2018 | 1.24 | 0.42 | 0.54 | 0.05 | 0.03 | 0.06 | ||||
| 2017 | 1.35 | 0.4 | 0.59 | 0.12 | 0.04 | 0.05 | 0.06 | 0.09 | 0.03 | 0.02 |
| 2016 | 1.53 | 0.66 | 0.54 | 0.08 | 0.04 | 0.07 | ||||
| 2015 | 1.78 | 0.69 | 0.66 | 0.08 | 0.04 | 0.05 | ||||
| 2014 | 1.51 | 0.64 | 0.61 | 0.05 | 0.03 | 0.04 | ||||
| 2013 | 1.5 | 0.49 | 0.65 | 0.04 | 0.04 | 0.05 | ||||
| 2012 | 1.84 | 0.84 | 0.62 | 0.09 | 0.05 | 0.07 | 0.04 | 0.07 | 0.05 | 0.02 |
| 2011 | 1.46 | 0.56 | 0.47 | 0.04 | 0.05 | 0.11 | ||||
| 2010 | 1.87 | 0.86 | 0.5 | 0.08 | 0.06 | 0.13 | ||||
| 2009 | 1.95 | 0.87 | 0.56 | 0.06 | 0.05 | 0.09 | ||||
| 2008 | 2.4 | 1.08 | 0.59 | 0.11 | 0.11 | 0.09 | 0.06 | 0.16 | 0.03 | |
| 2007 | 2 | 1.05 | 0.41 | 0.09 | 0.13 | 0.06 | 0.05 | 0.11 | 0.02 | 0.01 |
| 2006 | 1.77 | 0.86 | 0.45 | 0.09 | 0.06 | 0.05 | 0.09 | 0.02 | ||
| 2005 | 2.61 | 1.11 | 0.53 | 0.1 | 0.13 | 0.07 | 0.1 | 0.21 | 0.03 | |
| 2004 | 1.71 | 0.79 | 0.42 | 0.09 | 0.05 | 0.06 | 0.05 | 0.12 | 0.02 | 0 |
| 2003 | 2.2 | 1.17 | 0.46 | 0.08 | 0.09 | 0.06 | 0.06 | 0.12 | 0.03 | 0.01 |
| 2002 | 1.83 | 1.32 | 0.43 | 0.07 | 0.06 | 0.05 | 0.04 | 0.07 | 0.04 | 0.01 |
| 2001 | 2.56 | 1.05 | 0.71 | 0.13 | 0.06 | 0.06 | 0.08 | 0.18 | 0.06 | 0.01 |
| 2000 | 2.65 | 1.27 | 0.7 | 0.11 | 0.09 | 0.07 | 0.08 | 0.18 | 0.05 | 0.02 |
| 1999 | 3.44 | 1.65 | 0.91 | 0.12 | 0.12 | 0.06 | 0.1 | 0.27 | 0.05 | 0.02 |
| 1998 | 3.49 | 1.96 | 0.92 | 0.11 | 0.13 | 0.05 | 0.07 | 0.15 | 0.05 | 0.01 |
| 1997 | 2.79 | 1.35 | 0.72 | 0.08 | 0.13 | 0.02 | 0.05 | 0.08 | 0.04 | 0 |
| 1996 | 2.48 | 1.17 | 0.69 | 0.06 | 0.15 | 0.02 | 0.04 | 0.11 | 0.03 | 0 |
| 1995 | 3.37 | 1.4 | 0.94 | 0.08 | 0.43 | 0.01 | 0.09 | 0.11 | 0.02 | 0 |
| 1994 | 3.43 | 1.54 | 0.92 | 0.07 | 0.48 | 0.01 | 0.07 | 0.1 | 0.01 | 0 |
| 1993 | 2.49 | 1.17 | 0.62 | 0.06 | 0.34 | 0 | 0.06 | 0.08 | 0.01 | 0 |
| 1992 | 2.04 | 1.12 | 0.39 | 0.04 | 0.21 | 0 | 0.04 | 0.07 | 0 | 0 |
| 1991 | 2.67 | 1.67 | 0.44 | 0.05 | 0.29 | 0.01 | 0.05 | 0.06 | 0.01 | 0 |
| 1990 | 1.85 | 1.33 | 0.3 | 0.03 | 0.14 | 0 | 0 | 0 | ||
| 1989 | 1.79 | 1.29 | 0.25 | 0.03 | 0.07 | 0.01 | 0 | 0 | ||
| 1988 | 1.92 | 1.41 | 0.25 | 0.03 | 0.05 | 0.01 | 0 | 0 | ||
| 1987 | 1.78 | 1.38 | 0.3 | 0.03 | 0.09 | 0.01 | 0 | 0.01 | ||
| 1986 | 1.96 | 1.41 | 0.37 | 0.03 | 0.15 | 0 | 0 | 0.01 | ||
| 1985 | 2.84 | 2.03 | 0.5 | 0.05 | 0.22 | 0.01 | 0.01 | 0.02 | ||
| 1984 | 3.69 | 2.82 | 0.59 | 0.05 | 0.25 | 0.02 | 0 | 0.03 | ||
| 1983 | 3.06 | 2.34 | 0.45 | 0.03 | 0.24 | 0.01 | 0 | 0.02 | ||
| 1982 | 4.72 | 3.35 | 0.62 | 0.03 | 0.51 | 0.03 | 0 | 0.02 | ||
| 1981 | 3.81 | 2.63 | 0.44 | 0.02 | 0.71 | 0.01 | 0.01 | |||
| 1980 | 3.68 | 2.24 | 0.5 | 0.02 | 0.89 | 0.01 | 0 | 0.01 | ||
| 1979 | 5.41 | 3.38 | 0.62 | 0.05 | 1.35 | 0.01 | 0.01 | 0.01 | ||
| 1978 | 2.8 | 1.91 | 0.16 | 0.01 | 0.7 | 0 | 0 | 0.01 | ||
| 1977 | 2.21 | 1.32 | 0.13 | 0 | 0.52 | 0 | 0 | |||
| 1976 | 0.81 | 0.6 | 0.21 | 0 | ||||||
| 1975 | 0.71 | 0.5 | 0.21 | |||||||
| 1974 | 0.37 | 0.18 | ||||||||
| 1973 | 0.41 | 0.26 | ||||||||
| 1972 | 0.41 | 0.29 | ||||||||
| 1971 | 0.24 | 0.16 | ||||||||
| 1970 | 0.12 | |||||||||
| 1969 | 0.11 | |||||||||
| 1968 | 0.09 | |||||||||
| 1967 | 0.13 | |||||||||
| 1966 | 0.05 | |||||||||
| 1965 | 0.03 | |||||||||
| 1964 | 0.02 | |||||||||
| 1963 | 0.03 | |||||||||
| 1962 | 0.01 | |||||||||
| 1951 | 0 | |||||||||
| 1950 | 0 | |||||||||
| 1949 | 0.01 | |||||||||
| 1948 | 0.02 | |||||||||
| 1947 | 0 | |||||||||


Comments