Abstract
The area of soybean harvested in American agriculture is the largest in the world, reaching 82.8 million acres in 2023. This soybean cultivation occupies an important position in the American agricultural economy, and its scale is showing great growth. Behind this growth is the increase in demand for soybeans, especially for uses such as livestock feed and food processing. In addition, improvements in American agricultural technology and efficiency are also a major factor, and the introduction of sustainable agricultural production systems has increased yields. On the other hand, soybean cultivation involves certain risks due to factors such as climate change and changes in trade policies. Despite this, American farmers continue to expand soybean production while adopting innovative methods and technologies.
Soybean All Classes
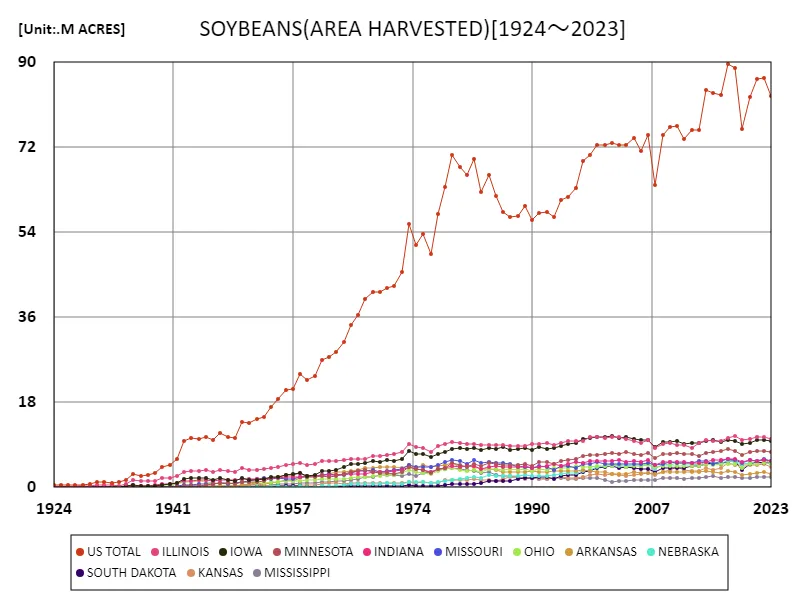
Soybean production in the United States has a long history, and data from 1924 to 2023 reveals its growth and transition. At its peak in 2017, it reached 89.5 million acres, but has since declined somewhat and is now at 92.5% of that level. This decline is likely due to a variety of factors, including regional changes in agriculture, fluctuations in demand, and the effects of climate change. Trade policy changes may also be a factor. On the other hand, the United States’ soybean production remains one of the world’s leading producers, and sustainable agricultural techniques and improved efficiency are expected to increase yields and productivity. In the future, production may expand again due to increased demand and the introduction of new technologies, but agricultural policies that take these factors into account will be necessary from the perspective of environmental considerations and sustainability.


The maximum is 89.5M ACRES[2017] of US TOTAL, and the current value is about 92.5%
Soybean all classes (each state)
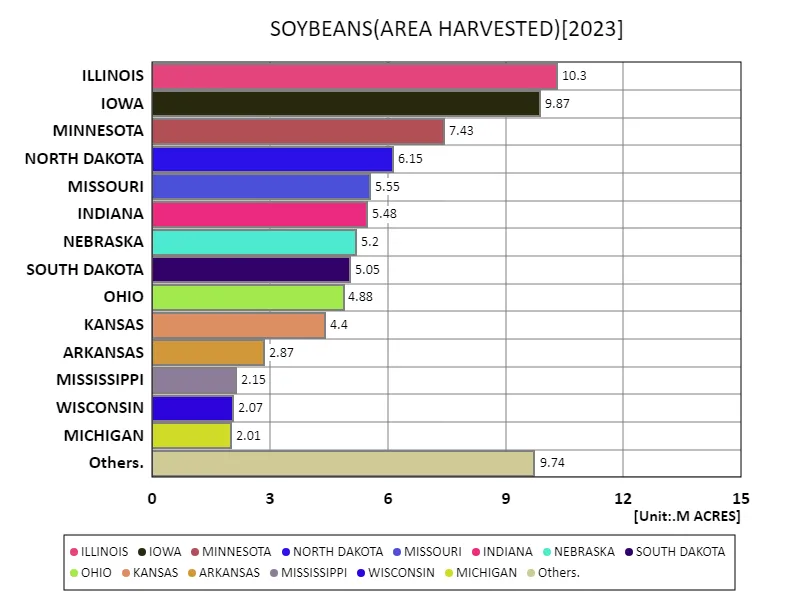
In soybean production in the United States, different states and regions have different characteristics and trends. Looking at the data for 2023, Illinois is the largest overall, with a harvested area of 10.3 million acres, the average of which is 2.87 million acres, for a total of 83.1 million acres. From this data, we can see that Illinois is the center of soybean production and its production volume dominates other states. On the other hand, the average harvested area of each state is 2.87 million acres, which indicates that soybean cultivation is widespread throughout the United States. Soybean production is influenced by regional soil and climatic conditions, developments in agricultural technology, etc., so different trends are seen in each state. In addition, American agriculture is constantly changing, and production volume and regional importance may change due to factors such as fluctuations in demand and climate change. In the future, the regional distribution and scale of soybean production may change due to the introduction of sustainable agricultural technologies and changes in agricultural policies.


The maximum is 10.3M ACRES of ILLINOIS, the average is 2.87M ACRES, and the total is 83.1M ACRES
Soybean All Classes (latest year, each state)
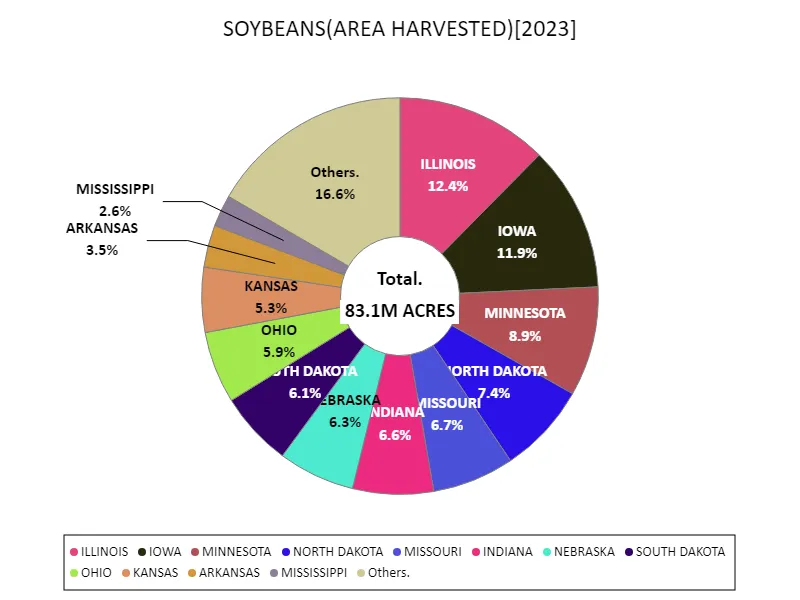
Soybean production in American agriculture has different characteristics for each state, but looking at the data for 2023, Illinois is the largest overall, boasting a harvested area of 10.3 million acres. This figure is the highest ever, showing that Illinois is the center of soybean production. Soybeans are one of the major agricultural products in the United States, and their production has a significant impact on the national economy. Meanwhile, soybeans are also cultivated in other states, totaling 83.1 million acres. This shows that soybeans are cultivated over a wide area of the United States. Soybeans are an important part of the field crop culture and are widely used for livestock feed and food processing industries. American agriculture is constantly changing, and production volume and regional importance may change due to the effects of climate change and trade policies. In the future, the introduction of sustainable agricultural technologies and reform of agricultural policies will be important factors in supporting the expansion of soybean production and stable supply.


The maximum is 10.3M ACRES of ILLINOIS, the average is 2.87M ACRES, and the total is 83.1M ACRES
Main data
| SOYBEANS(ALL CLASSES, ALL PRODUCTION PRACTICES, ALL UTILIZATION PRACTICES, AREA HARVESTED, UNITED STATES) [M ACRES] | ||||||||||
|---|---|---|---|---|---|---|---|---|---|---|
| US TOTAL | ILLINOIS | IOWA | MINNESOTA | NORTH DAKOTA | MISSOURI | INDIANA | NEBRASKA | SOUTH DAKOTA | OHIO | |
| 2023 | 82.79 | 10.3 | 9.87 | 7.43 | 6.15 | 5.55 | 5.48 | 5.2 | 5.05 | 4.88 |
| 2022 | 86.63 | 10.7 | 10.02 | 7.6 | 5.65 | 6.05 | 5.83 | 5.7 | 5.05 | 5.08 |
| 2021 | 86.44 | 10.55 | 10.02 | 7.63 | 7.25 | 5.64 | 5.64 | 5.57 | 5.39 | 4.83 |
| 2020 | 82.6 | 10.25 | 9.37 | 7.38 | 5.7 | 5.81 | 5.73 | 5.16 | 4.92 | 4.92 |
| 2019 | 75.87 | 9.94 | 9.13 | 6.82 | 5.55 | 5.23 | 5.36 | 4.95 | 3.56 | 4.17 |
| 2018 | 88.86 | 10.85 | 9.84 | 7.74 | 6.55 | 5.73 | 5.93 | 5.45 | 5.66 | 4.94 |
| 2017 | 89.54 | 10.34 | 9.95 | 8.14 | 7.15 | 5.91 | 5.94 | 5.67 | 5.63 | 4.99 |
| 2016 | 83.05 | 9.84 | 9.5 | 7.75 | 5.87 | 5.54 | 5.68 | 5.25 | 4.87 | 4.84 |
| 2015 | 83.55 | 9.83 | 9.92 | 7.58 | 5.77 | 4.95 | 5.69 | 5.15 | 5.06 | 4.79 |
| 2014 | 84.06 | 10.05 | 9.89 | 7.27 | 5.95 | 5.65 | 5.44 | 5.35 | 4.91 | 4.94 |
| 2013 | 75.69 | 9.48 | 9.43 | 6.63 | 4.61 | 5.64 | 5.19 | 4.75 | 4.58 | 4.43 |
| 2012 | 75.69 | 8.35 | 9.44 | 7.01 | 4.55 | 5.25 | 5.14 | 4.99 | 4.45 | 4.58 |
| 2011 | 73.78 | 8.91 | 9.23 | 7.04 | 3.96 | 5.21 | 5.29 | 4.84 | 4.07 | 4.54 |
| 2010 | 76.61 | 9.05 | 9.73 | 7.31 | 4.07 | 5.07 | 5.33 | 5.1 | 4.14 | 4.59 |
| 2009 | 76.37 | 9.35 | 9.53 | 7.12 | 3.87 | 5.3 | 5.44 | 4.76 | 4.19 | 4.53 |
| 2008 | 74.68 | 9.12 | 9.67 | 6.97 | 3.76 | 5.03 | 5.43 | 4.86 | 4.06 | 4.48 |
| 2007 | 63.92 | 8.28 | 8.61 | 6.27 | 3.06 | 4.67 | 4.78 | 3.83 | 3.24 | 4.24 |
| 2006 | 74.6 | 10.05 | 10.1 | 7.25 | 3.87 | 5.11 | 5.68 | 5.01 | 3.85 | 4.62 |
| 2005 | 71.25 | 9.45 | 10 | 6.8 | 2.9 | 4.91 | 5.38 | 4.66 | 3.85 | 4.48 |
| 2004 | 73.96 | 9.9 | 10.15 | 7.05 | 3.57 | 4.96 | 5.52 | 4.75 | 4.12 | 4.42 |
| 2003 | 72.48 | 10.26 | 10.55 | 7.45 | 3.05 | 4.95 | 5.37 | 4.5 | 4.2 | 4.28 |
| 2002 | 72.4 | 10.55 | 10.42 | 7.1 | 2.63 | 5 | 5.77 | 4.57 | 4.09 | 4.72 |
| 2001 | 72.98 | 10.62 | 10.92 | 7.2 | 2.11 | 4.9 | 5.59 | 4.9 | 4.47 | 4.58 |
| 2000 | 72.41 | 10.45 | 10.68 | 7.15 | 1.85 | 5 | 5.48 | 4.58 | 4.37 | 4.44 |
| 1999 | 72.45 | 10.55 | 10.75 | 6.9 | 1.34 | 5.35 | 5.55 | 4.25 | 4.07 | 4.5 |
| 1998 | 70.44 | 10.55 | 10.35 | 6.8 | 1.48 | 5 | 5.5 | 3.75 | 3.4 | 4.39 |
| 1997 | 69.11 | 9.87 | 10.26 | 6.55 | 1.14 | 4.85 | 5.04 | 3.55 | 3.25 | 4.34 |
| 1996 | 63.35 | 9.85 | 9.45 | 5.9 | 0.85 | 4.05 | 5.36 | 3.01 | 2.67 | 4.49 |
| 1995 | 61.54 | 9.7 | 9.26 | 5.8 | 0.64 | 4.5 | 4.98 | 3.06 | 2.5 | 4.03 |
| 1994 | 60.81 | 9.43 | 8.77 | 5.6 | 0.61 | 4.56 | 4.58 | 2.86 | 2.4 | 3.99 |
| 1993 | 57.31 | 9 | 8.3 | 5 | 0.54 | 3.6 | 4.85 | 2.5 | 1.75 | 4.11 |
| 1992 | 58.23 | 9.43 | 8.17 | 5.4 | 0.69 | 4.25 | 4.52 | 2.46 | 2.25 | 3.68 |
| 1991 | 58.01 | 9.1 | 8.63 | 5.35 | 0.63 | 4.43 | 4.4 | 2.46 | 2.16 | 3.77 |
| 1990 | 56.51 | 9.1 | 7.9 | 4.6 | 0.5 | 4.15 | 4.18 | 2.36 | 1.92 | 3.48 |
| 1989 | 59.54 | 8.85 | 8.28 | 5 | 0.63 | 4.35 | 4.55 | 2.56 | 1.88 | 3.98 |
| 1988 | 57.37 | 8.7 | 8.1 | 4.8 | 0.69 | 4.23 | 4.2 | 2.36 | 1.73 | 3.7 |
| 1987 | 57.17 | 8.7 | 7.9 | 4.65 | 0.52 | 4.93 | 4.35 | 2.35 | 1.39 | 3.9 |
| 1986 | 58.31 | 9 | 8.45 | 4.65 | 0.47 | 5.25 | 4.25 | 2.45 | 1.33 | 3.62 |
| 1985 | 61.6 | 9 | 8.15 | 5 | 0.49 | 5.23 | 4.46 | 2.36 | 1.27 | 3.87 |
| 1984 | 66.11 | 9.02 | 8.4 | 5.24 | 0.74 | 5.3 | 4.35 | 2.55 | 1.36 | 3.77 |
| 1983 | 62.53 | 9.05 | 7.96 | 4.6 | 0.53 | 5.15 | 3.95 | 2.07 | 0.99 | 3.28 |
| 1982 | 69.44 | 9.2 | 8.4 | 4.83 | 0.42 | 5.7 | 4.5 | 2.25 | 0.8 | 3.7 |
| 1981 | 66.16 | 9.15 | 8.05 | 4.35 | 0.25 | 5 | 4.6 | 2.07 | 0.77 | 3.45 |
| 1980 | 67.81 | 9.35 | 8.27 | 4.76 | 0.2 | 5.53 | 4.38 | 1.77 | 0.77 | 3.76 |
| 1979 | 70.34 | 9.62 | 8.17 | 5.08 | 0.21 | 5.83 | 4.42 | 1.61 | 0.69 | 4.08 |
| 1978 | 63.66 | 9.24 | 7.55 | 4.06 | 0.17 | 5.44 | 4.18 | 1.25 | 0.39 | 3.87 |
| 1977 | 57.83 | 8.85 | 7.08 | 3.77 | 0.18 | 4.65 | 3.9 | 1.13 | 0.32 | 3.48 |
| 1976 | 49.4 | 7.56 | 6.45 | 3.02 | 0.15 | 4.2 | 3.28 | 0.98 | 0.27 | 2.88 |
| 1975 | 53.62 | 8.32 | 6.97 | 3.65 | 0.15 | 4.37 | 3.63 | 1.2 | 0.34 | 3.1 |
| 1974 | 51.34 | 8.44 | 7.11 | 3.86 | 0.17 | 4.25 | 3.89 | 1.15 | 0.37 | 3.14 |
| 1973 | 55.67 | 9.13 | 7.65 | 4.29 | 0.22 | 4.7 | 4.29 | 1.21 | 0.4 | 3.59 |
| 1972 | 45.68 | 7.52 | 6 | 3.23 | 0.19 | 3.96 | 3.69 | 0.71 | 0.25 | 3.01 |
| 1971 | 42.71 | 7.15 | 5.5 | 2.78 | 0.21 | 3.61 | 3.38 | 0.61 | 0.23 | 2.63 |
| 1970 | 42.25 | 6.8 | 5.68 | 3.03 | 0.18 | 3.47 | 3.28 | 0.81 | 0.25 | 2.55 |
| 1969 | 41.34 | 6.73 | 5.45 | 3 | 0.2 | 3.15 | 3.31 | 0.77 | 0.24 | 2.48 |
| 1968 | 41.39 | 6.66 | 5.56 | 3.23 | 0.22 | 3.66 | 3.25 | 0.78 | 0.3 | 2.33 |
| 1967 | 39.81 | 6.01 | 5.25 | 3.59 | 0.29 | 3.42 | 2.9 | 0.78 | 0.37 | 2.23 |
| 1966 | 36.55 | 5.94 | 5 | 3.36 | 0.24 | 3.36 | 2.81 | 0.75 | 0.35 | 2.11 |
| 1965 | 34.45 | 6.02 | 4.85 | 3.17 | 0.21 | 3.05 | 2.87 | 0.7 | 0.33 | 2.04 |
| 1964 | 30.79 | 5.73 | 4.25 | 2.85 | 0.19 | 2.68 | 2.73 | 0.52 | 0.25 | 1.83 |
| 1963 | 28.62 | 5.58 | 3.58 | 2.38 | 0.15 | 2.65 | 2.65 | 0.36 | 0.15 | 1.74 |
| 1962 | 27.61 | 5.58 | 3.41 | 2.2 | 0.07 | 2.73 | 2.71 | 0.31 | 0.12 | 1.76 |
| 1961 | 27 | 5.52 | 3.41 | 2.34 | 0.19 | 2.6 | 2.68 | 0.29 | 0.13 | 1.72 |
| 1960 | 23.66 | 4.97 | 2.6 | 2.09 | 0.18 | 2.34 | 2.42 | 0.16 | 0.1 | 1.5 |
| 1959 | 22.63 | 4.8 | 2.37 | 2.22 | 0.21 | 2.27 | 2.29 | 0.15 | 0.13 | 1.46 |
| 1958 | 23.99 | 5.07 | 3.12 | 3.08 | 0.26 | 2.13 | 2.25 | 0.21 | 0.26 | 1.43 |
| 1957 | 20.86 | 4.91 | 2.83 | 2.55 | 0.18 | 1.72 | 2.17 | 0.14 | 0.19 | 1.4 |
| 1956 | 20.62 | 4.65 | 2.5 | 2.63 | 0.18 | 1.82 | 2.14 | 0.15 | 0.22 | 1.3 |
| 1955 | 18.62 | 4.33 | 2.26 | 2.25 | 0.09 | 1.9 | 2.04 | 0.18 | 0.24 | 1.19 |
| 1954 | 17.05 | 4.14 | 2.13 | 1.96 | 0.05 | 1.83 | 1.94 | 0.19 | 0.17 | 1.12 |
| 1953 | 14.83 | 3.85 | 1.66 | 1.35 | 0.02 | 1.92 | 1.81 | 0.11 | 0.09 | 1.01 |
| 1952 | 14.44 | 3.72 | 1.53 | 1.16 | 0.03 | 1.72 | 1.68 | 0.09 | 0.09 | 0.94 |
| 1951 | 13.62 | 3.73 | 1.58 | 1.08 | 0.03 | 1.29 | 1.71 | 0.06 | 0.06 | 1.12 |
| 1950 | 13.81 | 3.99 | 1.93 | 1.11 | 0.04 | 1.21 | 1.65 | 0.05 | 0.07 | 1.09 |
| 1949 | 10.48 | 3.29 | 1.34 | 0.77 | 0.02 | 0.89 | 1.44 | 0.02 | 0.03 | 0.88 |
| 1948 | 10.68 | 3.35 | 1.56 | 0.9 | 0.01 | 0.8 | 1.46 | 0.02 | 0.03 | 0.91 |
| 1947 | 11.41 | 3.64 | 1.88 | 0.96 | 0.01 | 0.83 | 1.5 | 0.03 | 0.05 | 0.95 |
| 1946 | 9.93 | 3.32 | 1.55 | 0.63 | 0.01 | 0.72 | 1.37 | 0.02 | 0.02 | 0.9 |
| 1945 | 10.74 | 3.76 | 1.91 | 0.46 | 0.01 | 0.72 | 1.47 | 0.02 | 0.01 | 1.08 |
| 1944 | 10.25 | 3.47 | 1.91 | 0.26 | 0 | 0.6 | 1.47 | 0.02 | 0.01 | 1.24 |
| 1943 | 10.4 | 3.44 | 1.87 | 0.24 | 0.01 | 0.56 | 1.4 | 0.07 | 0.02 | 1.21 |
| 1942 | 9.89 | 3.24 | 1.82 | 0.27 | 0 | 0.47 | 1.32 | 0.04 | 0.01 | 1.05 |
| 1941 | 5.89 | 2.34 | 0.94 | 0.08 | 0.19 | 0.82 | 0.02 | 0 | 0.66 | |
| 1940 | 4.81 | 2 | 0.71 | 0.05 | 0.11 | 0.72 | 0 | 0 | 0.56 | |
| 1939 | 4.32 | 1.89 | 0.55 | 0.03 | 0.09 | 0.74 | 0 | 0.5 | ||
| 1938 | 3.04 | 1.43 | 0.31 | 0.01 | 0.06 | 0.47 | 0 | 0.28 | ||
| 1937 | 2.59 | 1.36 | 0.23 | 0.01 | 0.06 | 0.34 | 0.17 | |||
| 1936 | 2.36 | 1.28 | 0.19 | 0.01 | 0.05 | 0.3 | 0.13 | |||
| 1935 | 2.92 | 1.51 | 0.41 | 0.01 | 0.14 | 0.41 | 0.12 | |||
| 1934 | 1.56 | 0.72 | 0.18 | 0 | 0.14 | 0.19 | 0.04 | |||
| 1933 | 1.04 | 0.36 | 0.1 | 0.17 | 0.12 | 0.03 | ||||
| 1932 | 1 | 0.39 | 0.05 | 0.11 | 0.14 | 0.03 | ||||
| 1931 | 1.14 | 0.43 | 0.05 | 0.12 | 0.18 | 0.05 | ||||
| 1930 | 1.07 | 0.41 | 0.07 | 0.14 | 0.15 | 0.03 | ||||
| 1929 | 0.71 | 0.23 | 0.04 | 0.09 | 0.1 | 0.02 | ||||
| 1928 | 0.58 | 0.19 | 0.02 | 0.08 | 0.07 | 0.02 | ||||
| 1927 | 0.57 | 0.18 | 0.02 | 0.06 | 0.07 | 0.02 | ||||
| 1926 | 0.47 | 0.14 | 0.01 | 0.05 | 0.04 | 0.02 | ||||
| 1925 | 0.42 | 0.11 | 0.01 | 0.04 | 0.04 | 0.02 | ||||
| 1924 | 0.45 | 0.12 | 0.01 | 0.05 | 0.07 | 0.02 | ||||


Comments