Abstract
The area of tobacco harvested in American agriculture is expected to remain at 165kacres in 2024, the latest figure. Considering past trends, this figure can be said to be relatively stable. The American tobacco industry has a long history and has been cultivated mainly in the southern part of the country, but in recent years, demand has declined due to increased health awareness and stricter legal regulations, and the area of harvested tobacco has also decreased. However, there is still demand, and tobacco farmers are making a living. In addition, American tobacco is known for its high quality and wide variety, and some areas maintain high demand. The American tobacco industry will continue to change in the future, influenced by changes in demand and legal regulations.
All tobacco classes
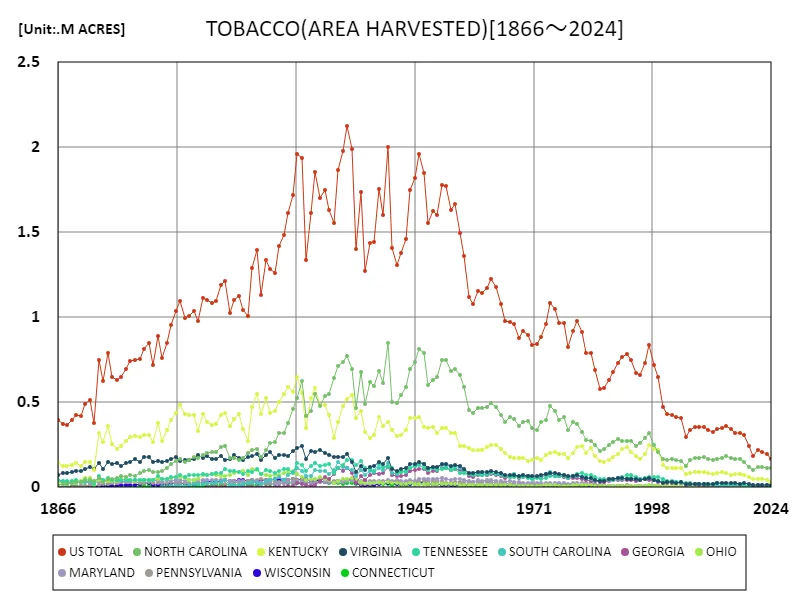
The American tobacco industry has a long history and has undergone changes over the past few decades. At its peak in 1930, the harvested area recorded 2.12 Macres, but it has now fallen to about 8% of that amount. The reasons for this decline include increased health awareness and stricter smoking regulations. This has led to a decrease in demand for tobacco and a reduction in the production area. There has also been a decrease in the number of tobacco farmers and a shift to other crops. On the other hand, American tobacco maintains a certain demand due to its high quality and unique brand value. In this situation, the tobacco industry is seeking to survive and change while responding to changes in demand and legal regulations.


The maximum is 2.12M ACRES[1930] of US TOTAL, and the current value is about 7.78%
All tobacco classes (each state)
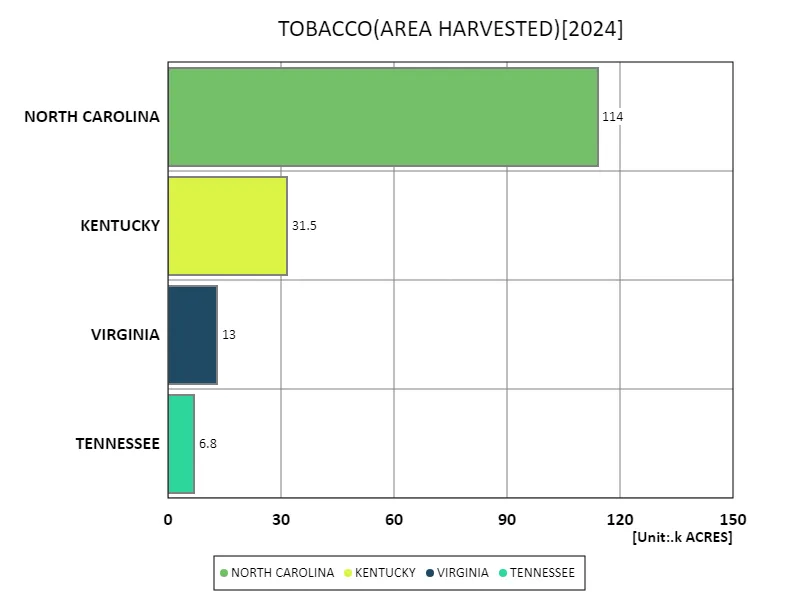
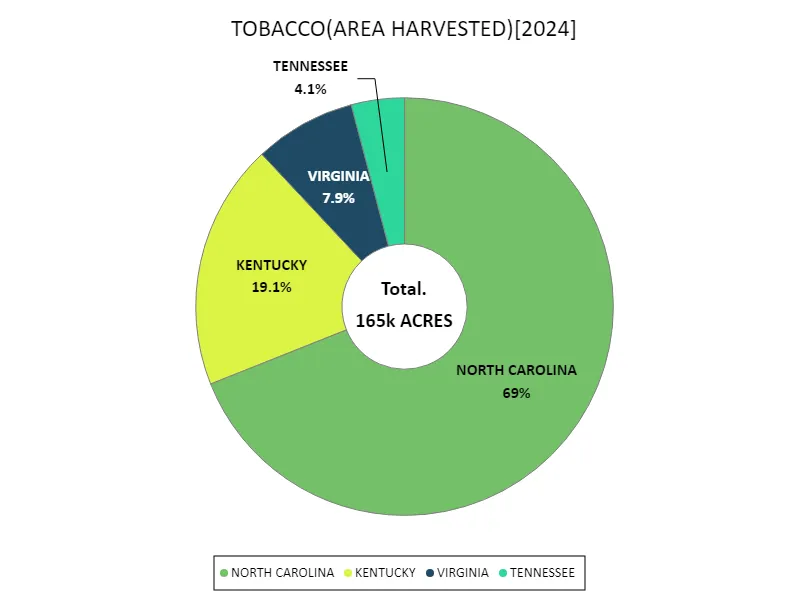
American crop tobacco production is mainly concentrated in North Carolina. According to 2024 data, the harvested area in North Carolina is 114k acres, with the overall average being 41.3k acres. This accounts for about 70% of the total tobacco harvested area in the United States. North Carolina has long been known as a major tobacco producing region, partly because its climate and soil are suitable for tobacco cultivation. On the other hand, tobacco is also cultivated in other states, but on a smaller scale than North Carolina, as reflected in the total figure of 165k acres. These characteristics also show that American crop tobacco production has a strong tendency for regional concentration, with North Carolina at the center.


The maximum is 114k ACRES of NORTH CAROLINA, the average is 41.3k ACRES, and the total is 165k ACRES
Tobacco All Classes (latest year, each state)
In the production of American agricultural tobacco, North Carolina has the largest harvested area according to 2024 data. The state has been known as a major tobacco producing region for many years. Therefore, the figure of 114k acres indicates that North Carolina plays a pivotal role in the American tobacco industry. The fact that this data is the largest is also noteworthy when compared to past trends. This may be due to various factors, such as changes in demand for tobacco production and agricultural policies. In addition, tobacco production trends in other states must also be taken into account. While tobacco cultivation may be decreasing in some states, it may be increasing in others. It is important to analyze the current state and future prospects of the American tobacco industry in light of these changes and regional disparities.


The maximum is 114k ACRES of NORTH CAROLINA, the average is 41.3k ACRES, and the total is 165k ACRES
Main data
| TOBACCO(ALL CLASSES, ALL PRODUCTION PRACTICES, ALL UTILIZATION PRACTICES, AREA HARVESTED, UNITED STATES) [k ACRES] | ||||||||||
|---|---|---|---|---|---|---|---|---|---|---|
| US TOTAL | NORTH CAROLINA | KENTUCKY | VIRGINIA | TENNESSEE | NORTH CAROLINA(NORTH CAROLINA CENTRAL COASTAL WILSON) | NORTH CAROLINA(NORTH CAROLINA SOUTHERN COASTAL SAMPSON) | NORTH CAROLINA(NORTH CAROLINA CENTRAL COASTAL JOHNSTON) | NORTH CAROLINA(NORTH CAROLINA NORTHERN COASTAL NASH) | NORTH CAROLINA(NORTH CAROLINA SOUTHERN COASTAL HARNETT) | |
| 2024 | 165.3 | 114 | 31.5 | 13 | 6.8 | |||||
| 2023 | 193.18 | 111.11 | 41.4 | 13.11 | 12.2 | |||||
| 2022 | 205.6 | 120.2 | 47 | 12.9 | 12.38 | 10.81 | 8.04 | 8.04 | 7.93 | 7.37 |
| 2021 | 221.2 | 118.2 | 46 | 15.61 | 11.6 | |||||
| 2020 | 186.38 | 99.35 | 46.1 | 12.23 | 11.1 | |||||
| 2019 | 244.04 | 118.4 | 58 | 18.02 | 13.8 | |||||
| 2018 | 304.98 | 148.6 | 71.2 | 23.28 | 16.4 | |||||
| 2017 | 318 | 163.9 | 80.54 | 22.35 | 21.1 | 11.79 | 10.45 | 12.05 | 9.49 | 8.82 |
| 2016 | 319.66 | 166 | 75.3 | 22.45 | 20.2 | |||||
| 2015 | 345.28 | 171.1 | 72.9 | 22.65 | 20.8 | |||||
| 2014 | 358.88 | 183.8 | 86.3 | 24.58 | 21.8 | |||||
| 2013 | 349.63 | 172.1 | 87.2 | 24.25 | 21.5 | |||||
| 2012 | 342.93 | 167.44 | 83.5 | 23.08 | 24 | 9.95 | 10.67 | 12.02 | 8.98 | 7.13 |
| 2011 | 325.04 | 162.3 | 77.5 | 21.9 | 22 | |||||
| 2010 | 337.5 | 168.3 | 85.2 | 19.75 | 22.3 | |||||
| 2009 | 354.04 | 177.4 | 88.7 | 20.15 | 21.6 | |||||
| 2008 | 354.49 | 174.3 | 87.8 | 19.5 | 21.8 | |||||
| 2007 | 356 | 170.08 | 87.64 | 20.6 | 19.98 | 7.79 | 10.86 | 11.23 | 8.81 | 6.18 |
| 2006 | 339 | 158.9 | 83 | 19.65 | 19.8 | |||||
| 2005 | 297.08 | 126 | 79.7 | 17.14 | 22.95 | |||||
| 2004 | 408.05 | 156.1 | 114.95 | 29.68 | 30.26 | |||||
| 2003 | 411.15 | 159.7 | 111.65 | 25.11 | 31.14 | |||||
| 2002 | 427.31 | 168.3 | 111.1 | 30.31 | 34.9 | 6.28 | 5.42 | 8.53 | 6.48 | 5.32 |
| 2001 | 432.49 | 161.7 | 115.7 | 29.5 | 39.69 | |||||
| 2000 | 469.42 | 167.4 | 132.7 | 25.9 | 46.02 | |||||
| 1999 | 647.16 | 207.8 | 221.65 | 38.3 | 63.17 | |||||
| 1998 | 717.62 | 251.1 | 226.26 | 45 | 59.42 | |||||
| 1997 | 837.36 | 317.99 | 250.5 | 53.77 | 59.48 | 10.75 | 10.07 | 16.71 | 13.41 | 9.89 |
| 1996 | 733.06 | 287.8 | 195.7 | 48.37 | 54.56 | |||||
| 1995 | 663.53 | 261.1 | 166.2 | 44.17 | 51.69 | |||||
| 1994 | 671.07 | 243.2 | 187 | 46.42 | 60.35 | |||||
| 1993 | 746.41 | 271 | 207.3 | 49.1 | 69.94 | |||||
| 1992 | 784.44 | 270.2 | 234.7 | 51.1 | 72.2 | |||||
| 1991 | 763.68 | 275 | 223.1 | 53.5 | 61.73 | |||||
| 1990 | 733.31 | 284.2 | 194.15 | 53.18 | 53.59 | |||||
| 1989 | 678.2 | 266.7 | 178.05 | 49.59 | 45.5 | |||||
| 1988 | 634.03 | 249.9 | 158 | 46.71 | 48.52 | |||||
| 1987 | 586.29 | 224.9 | 148.3 | 39.43 | 49.44 | |||||
| 1986 | 580.55 | 214.6 | 153.3 | 38.43 | 49.24 | |||||
| 1985 | 688.02 | 250.7 | 186.3 | 43.3 | 61.71 | |||||
| 1984 | 791.7 | 271.6 | 228.5 | 53.84 | 74.99 | |||||
| 1983 | 789.16 | 277.7 | 203.3 | 54.19 | 72.91 | |||||
| 1982 | 912.73 | 325.74 | 244.1 | 61.67 | 82.61 | |||||
| 1981 | 976.58 | 374.3 | 234.6 | 73.34 | 78.65 | |||||
| 1980 | 921.02 | 384.2 | 200.9 | 65.38 | 64.76 | |||||
| 1979 | 827.7 | 338.3 | 173.7 | 67.24 | 60.09 | |||||
| 1978 | 963.73 | 412.1 | 194.5 | 73.13 | 66.85 | |||||
| 1977 | 965.8 | 398.6 | 196.75 | 79.7 | 68.46 | |||||
| 1976 | 1046.92 | 448 | 207 | 86.78 | 68.45 | |||||
| 1975 | 1086.65 | 479.5 | 200.7 | 84.53 | 66.03 | |||||
| 1974 | 962.62 | 398 | 189.05 | 77.88 | 56.54 | |||||
| 1973 | 886.59 | 383.5 | 161.75 | 74.4 | 51.42 | |||||
| 1972 | 842.42 | 339.7 | 172.25 | 66.8 | 57.39 | |||||
| 1971 | 837.59 | 346 | 159.2 | 67.3 | 51.76 | |||||
| 1970 | 898.33 | 391.1 | 157.1 | 68.3 | 53.83 | |||||
| 1969 | 918.32 | 386.4 | 173.4 | 73 | 59.16 | |||||
| 1968 | 879.28 | 358.4 | 172.5 | 66.6 | 58.74 | |||||
| 1967 | 959.77 | 403.2 | 173 | 70.1 | 57.8 | |||||
| 1966 | 971.89 | 415.4 | 176.9 | 72.5 | 61.25 | |||||
| 1965 | 976.93 | 383.9 | 203.4 | 75.2 | 69.15 | |||||
| 1964 | 1077.81 | 425.7 | 225.1 | 82.9 | 75.6 | |||||
| 1963 | 1175.72 | 471.5 | 248.4 | 89 | 84.1 | |||||
| 1962 | 1224.08 | 494 | 248.9 | 95.4 | 84.5 | |||||
| 1961 | 1174.39 | 473.4 | 235.1 | 91.4 | 80.3 | |||||
| 1960 | 1141.53 | 467 | 219.5 | 89.3 | 73.9 | |||||
| 1959 | 1152.78 | 468.3 | 222.3 | 90.8 | 77.5 | |||||
| 1958 | 1077.9 | 438.3 | 220.2 | 83.6 | 73.8 | |||||
| 1957 | 1121.8 | 452.6 | 230 | 86.9 | 79.2 | |||||
| 1956 | 1363.5 | 588.4 | 241.4 | 110 | 84.4 | |||||
| 1955 | 1495.4 | 662.8 | 242 | 122.7 | 85.1 | |||||
| 1954 | 1667.5 | 698.7 | 321.9 | 131.2 | 105.9 | |||||
| 1953 | 1632.9 | 685.4 | 322.3 | 128.2 | 103.4 | |||||
| 1952 | 1771.8 | 747 | 350.2 | 137.4 | 114.2 | |||||
| 1951 | 1779.9 | 747.2 | 348.8 | 136.5 | 110.1 | |||||
| 1950 | 1599 | 650.5 | 320.4 | 118.8 | 103.1 | |||||
| 1949 | 1623.2 | 631.8 | 356.9 | 119.5 | 111.9 | |||||
| 1948 | 1553.6 | 604.3 | 351.2 | 113.2 | 106.2 | |||||
| 1947 | 1851.6 | 792.6 | 356.5 | 139.3 | 115.6 | |||||
| 1946 | 1960.8 | 811.8 | 415.7 | 147.9 | 129.1 | |||||
| 1945 | 1820.7 | 735 | 410.2 | 137.3 | 124.2 | |||||
| 1944 | 1749.9 | 696 | 407.6 | 135.1 | 112.3 | |||||
| 1943 | 1458 | 588.5 | 338.6 | 113.4 | 94 | |||||
| 1942 | 1377.3 | 545.6 | 308.7 | 107.1 | 88.6 | |||||
| 1941 | 1306.5 | 494.2 | 301.2 | 97.5 | 89 | |||||
| 1940 | 1410.2 | 504.5 | 338 | 108.3 | 115.7 | |||||
| 1939 | 1999.7 | 851.1 | 381.7 | 172.1 | 121.7 | |||||
| 1938 | 1600.7 | 612.1 | 361.4 | 135.4 | 118.4 | |||||
| 1937 | 1752.8 | 684 | 411.5 | 148 | 137.8 | |||||
| 1936 | 1440.9 | 597 | 306.7 | 125.3 | 93.1 | |||||
| 1935 | 1439.1 | 617.7 | 291 | 119.9 | 105.3 | |||||
| 1934 | 1273.1 | 492 | 323 | 103.4 | 113 | |||||
| 1933 | 1739.4 | 677 | 449 | 127.6 | 156.1 | |||||
| 1932 | 1404.6 | 469 | 410 | 92.6 | 130.9 | |||||
| 1931 | 1988.1 | 695.6 | 545 | 151.1 | 158.2 | |||||
| 1930 | 2124.2 | 775.2 | 519 | 193 | 161.5 | |||||
| 1929 | 1980 | 734.8 | 480 | 177.2 | 134.1 | |||||
| 1928 | 1864.4 | 716 | 383 | 181 | 111 | |||||
| 1927 | 1555.9 | 642 | 290 | 179 | 85 | |||||
| 1926 | 1628.4 | 550 | 426 | 189 | 135 | |||||
| 1925 | 1750.7 | 540 | 484 | 202 | 129 | |||||
| 1924 | 1702.3 | 477 | 486 | 220 | 126 | |||||
| 1923 | 1855 | 548 | 587 | 209 | 143 | |||||
| 1922 | 1616.2 | 447 | 525 | 214 | 124 | |||||
| 1921 | 1339.5 | 417 | 350 | 167 | 98 | |||||
| 1920 | 1934.8 | 625 | 555 | 242 | 129 | |||||
| 1919 | 1958.5 | 524 | 648 | 230 | 140 | |||||
| 1918 | 1720 | 460 | 559 | 215 | 84 | |||||
| 1917 | 1616 | 380 | 590 | 185 | 109 | |||||
| 1916 | 1483 | 320 | 550 | 190 | 110 | |||||
| 1915 | 1419 | 320 | 500 | 192 | 98 | |||||
| 1914 | 1258 | 265 | 450 | 170 | 82 | |||||
| 1913 | 1284 | 260 | 435 | 205 | 93 | |||||
| 1912 | 1335 | 220 | 525 | 190 | 102 | |||||
| 1911 | 1133 | 176 | 430 | 160 | 77 | |||||
| 1910 | 1398 | 225 | 550 | 195 | 105 | |||||
| 1909 | 1292 | 222 | 470 | 185 | 90 | |||||
| 1908 | 1009 | 200 | 275 | 180 | 93 | |||||
| 1907 | 1042 | 175 | 340 | 158 | 81 | |||||
| 1906 | 1123 | 160 | 430 | 173 | 90 | |||||
| 1905 | 1103 | 170 | 400 | 188 | 95 | |||||
| 1904 | 1026 | 172 | 360 | 165 | 94 | |||||
| 1903 | 1212 | 240 | 440 | 163 | 105 | |||||
| 1902 | 1189 | 235 | 425 | 182 | 87 | |||||
| 1901 | 1098 | 210 | 375 | 169 | 85 | |||||
| 1900 | 1086 | 205 | 365 | 164 | 77 | |||||
| 1899 | 1102 | 203 | 385 | 184 | 72 | |||||
| 1898 | 1116 | 188 | 430 | 170 | 81 | |||||
| 1897 | 978 | 170 | 330 | 188 | 70 | |||||
| 1896 | 1038 | 180 | 425 | 165 | 73 | |||||
| 1895 | 1006 | 163 | 425 | 161 | 71 | |||||
| 1894 | 993 | 146 | 430 | 159 | 63 | |||||
| 1893 | 1096 | 165 | 485 | 155 | 70 | |||||
| 1892 | 1039 | 155 | 435 | 176 | 61 | |||||
| 1891 | 955 | 135 | 395 | 166 | 58 | |||||
| 1890 | 851 | 115 | 335 | 157 | 51 | |||||
| 1889 | 758 | 97 | 275 | 147 | 51 | |||||
| 1888 | 891 | 92 | 380 | 156 | 66 | |||||
| 1887 | 722 | 90 | 265 | 148 | 44 | |||||
| 1886 | 848 | 101 | 310 | 176 | 45 | |||||
| 1885 | 815 | 95 | 305 | 179 | 44 | |||||
| 1884 | 754 | 83 | 295 | 147 | 41 | |||||
| 1883 | 750 | 67 | 300 | 165 | 41 | |||||
| 1882 | 744 | 75 | 295 | 150 | 43 | |||||
| 1881 | 698 | 63 | 270 | 140 | 41 | |||||
| 1880 | 650 | 67 | 240 | 126 | 40 | |||||
| 1879 | 633 | 57 | 226 | 141 | 42 | |||||
| 1878 | 651 | 49 | 254 | 135 | 44 | |||||
| 1877 | 789 | 48 | 358 | 149 | 56 | |||||
| 1876 | 625 | 29 | 269 | 108 | 43 | |||||
| 1875 | 746 | 52 | 320 | 142 | 64 | |||||
| 1874 | 378 | 35 | 99 | 110 | 21 | |||||
| 1873 | 513 | 44 | 150 | 118 | 35 | |||||
| 1872 | 492 | 41 | 146 | 110 | 33 | |||||
| 1871 | 420 | 34 | 126 | 98 | 31 | |||||
| 1870 | 424 | 32 | 145 | 95 | 40 | |||||
| 1869 | 395 | 26 | 132 | 90 | 38 | |||||
| 1868 | 369 | 20 | 127 | 85 | 38 | |||||
| 1867 | 370 | 19 | 125 | 82 | 37 | |||||
| 1866 | 394 | 16 | 142 | 70 | 40 | |||||


Comments