Abstract
American peanut agriculture has a long history and is supported by technological innovation. Its large scale can be seen from the harvested area of 1.6 million acres in 2023. This shows that the United States is one of the major countries in peanut production worldwide. The trend of American peanut agriculture in the past few decades has focused on technological innovation and productivity improvement. The introduction of efficient agricultural machinery and advanced cultivation techniques has increased yields and improved productivity. Another characteristic is that the climate conditions and vastness of the land in the United States are suitable for peanut cultivation. In addition, farmer organizations and government support also contribute to the growth of this industry. On the other hand, there are challenges such as climate change and changes in market demand, and the creation of a sustainable agricultural system is required. Overall, American peanut agriculture is large-scale and efficient, and continues to grow through technological innovation and continued support.
Peanuts all classes
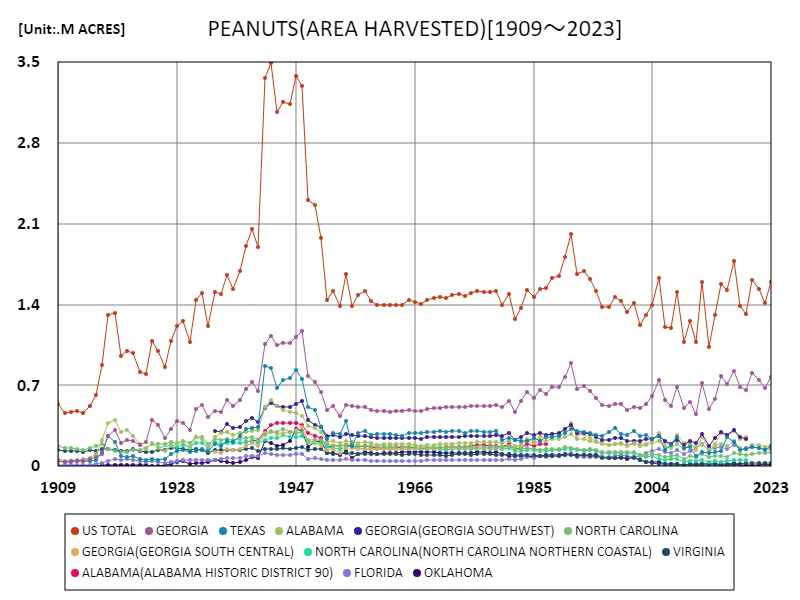
Peanut cultivation in the United States has a long history, and its harvested area has changed over time. Considering data from 1909 to 2023, the peak was reached in 1943, when the total area in the United States reached 3.49 million acres. It then declined to 45.8% compared to the peak. There are multiple factors behind this trend. During World War II, peanuts were an important food source, and it is believed that the increased demand led to the peak. However, since then, the cultivated area of peanuts has decreased due to changes in food demand and technological innovations in agriculture. Changes in agricultural policies and fluctuations in climatic conditions have also had an impact. Currently, about half of the harvested area at the peak is observed, but peanut agriculture in the United States remains important. Stable production is expected in the future due to efforts such as technological innovation and the promotion of sustainable agriculture.


The maximum is 3.49M ACRES[1943] of US TOTAL, and the current value is about 45.8%
Peanuts All Classes (each state)
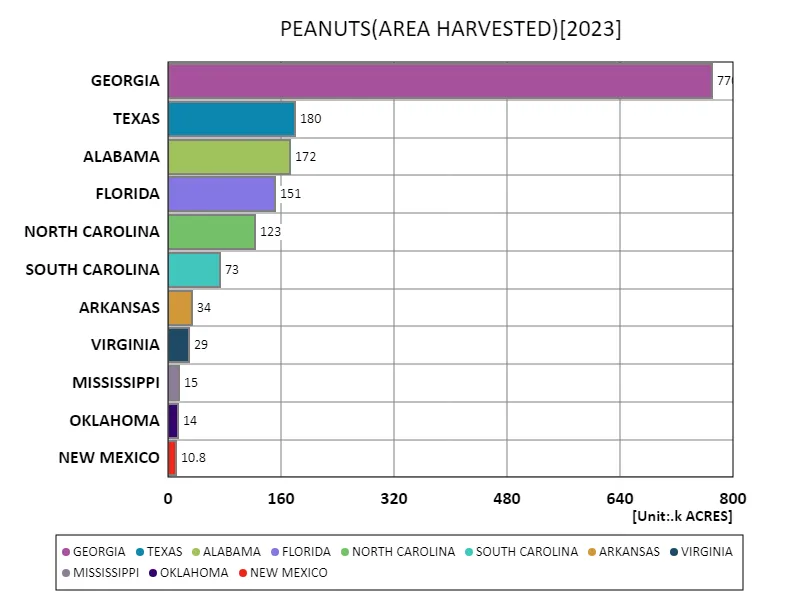
Peanut cultivation in the United States has different characteristics in different regions. According to the data for 2023, Georgia is the largest overall, with a harvested area of 770 thousand acres. This shows that Georgia is the center of peanut production in the United States. The average harvested area is 143 thousand acres, reflecting the scale of peanut cultivation in the whole United States. The total harvested area is 1.57 million acres, showing the total peanut production in the United States. As can be seen from this data, peanut cultivation in the United States has different scales and characteristics in different regions, but Georgia is the largest producer, and overall production has been stable. Farmers’ efforts, technological innovations, and regional climatic conditions have contributed to the development of this industry.


The maximum is 770k ACRES of GEORGIA, the average is 143k ACRES, and the total is 1.57M ACRES
Peanuts All Classes (latest year, each state)
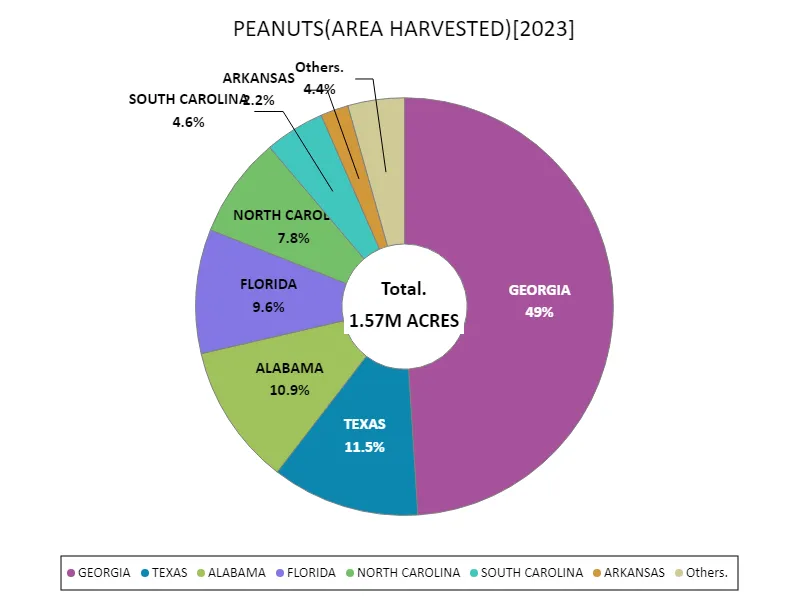
Looking at the harvested area data for the US agricultural crop peanuts in 2023, Georgia is the largest overall, covering an area of 770 thousand acres. This figure is the largest ever, indicating that Georgia is the major producer of peanuts in the US. This trend is due to a combination of Georgia’s climatic conditions, land suitability, and farmer expertise. Peanuts are also grown in other states, but Georgia boasts an overwhelming production volume. The total peanut harvested area in the US is the largest as of 2023. This is likely the result of developments in agricultural technology and improvements in cultivation methods that have increased production. In addition, peanuts are widely used in the manufacture of food and grocery products, and increased demand may also contribute to the expansion of the production area. Due to these characteristics, the production of agricultural crop peanuts in the US has continued to grow steadily, and the production system centered on Georgia is the foundation. Due to increased demand and technological advances, stable production is expected to continue in the future.


The maximum is 770k ACRES of GEORGIA, the average is 143k ACRES, and the total is 1.57M ACRES
Main data
| PEANUTS(ALL CLASSES, ALL PRODUCTION PRACTICES, ALL UTILIZATION PRACTICES, AREA HARVESTED, UNITED STATES) [M ACRES] | ||||||||||
|---|---|---|---|---|---|---|---|---|---|---|
| US TOTAL | GEORGIA | ALABAMA | FLORIDA | TEXAS | GEORGIA(GEORGIA OTHER COUNTIES) | NORTH CAROLINA | TEXAS(TEXAS OTHER COUNTIES) | SOUTH CAROLINA | FLORIDA(FLORIDA OTHER COUNTIES) | |
| 2023 | 1.6 | 0.77 | 0.17 | 0.15 | 0.18 | 0.12 | 0.07 | |||
| 2022 | 1.41 | 0.68 | 0.16 | 0.15 | 0.14 | 0.13 | 0.12 | 0.09 | 0.07 | 0.06 |
| 2021 | 1.53 | 0.75 | 0.18 | 0.16 | 0.16 | 0.17 | 0.11 | 0.07 | 0.07 | 0.06 |
| 2020 | 1.61 | 0.81 | 0.18 | 0.16 | 0.17 | 0.11 | 0.11 | 0.08 | 0.08 | 0.06 |
| 2019 | 1.32 | 0.66 | 0.15 | 0.16 | 0.15 | 0.1 | 0.06 | |||
| 2018 | 1.38 | 0.69 | 0.16 | 0.15 | 0.15 | 0.1 | 0.08 | |||
| 2017 | 1.78 | 0.83 | 0.22 | 0.18 | 0.21 | 0.12 | 0.12 | |||
| 2016 | 1.53 | 0.71 | 0.17 | 0.15 | 0.25 | 0.08 | 0.11 | |||
| 2015 | 1.58 | 0.78 | 0.2 | 0.17 | 0.13 | 0.09 | 0.11 | |||
| 2014 | 1.31 | 0.58 | 0.17 | 0.16 | 0.12 | 0.09 | 0.11 | |||
| 2013 | 1.03 | 0.5 | 0.14 | 0.13 | 0.11 | 0.08 | 0.08 | |||
| 2012 | 1.59 | 0.73 | 0.19 | 0.2 | 0.13 | 0.11 | 0.11 | |||
| 2011 | 1.08 | 0.45 | 0.17 | 0.16 | 0.09 | 0.08 | 0.07 | |||
| 2010 | 1.26 | 0.56 | 0.19 | 0.14 | 0.16 | 0.09 | 0.06 | |||
| 2009 | 1.08 | 0.51 | 0.15 | 0.11 | 0.16 | 0.07 | 0.05 | |||
| 2008 | 1.51 | 0.69 | 0.19 | 0.14 | 0.25 | 0.1 | 0.07 | |||
| 2007 | 1.2 | 0.52 | 0.16 | 0.12 | 0.19 | 0.09 | 0.06 | |||
| 2006 | 1.21 | 0.58 | 0.16 | 0.12 | 0.15 | 0.08 | 0.06 | |||
| 2005 | 1.63 | 0.75 | 0.22 | 0.15 | 0.26 | 0.1 | 0.06 | |||
| 2004 | 1.39 | 0.61 | 0.2 | 0.13 | 0.24 | 0.11 | 0.03 | |||
| 2003 | 1.31 | 0.54 | 0.19 | 0.12 | 0.27 | 0.1 | 0.02 | |||
| 2002 | 1.22 | 0.51 | 0.18 | 0.09 | 0.26 | 0.1 | 0.01 | |||
| 2001 | 1.41 | 0.51 | 0.2 | 0.08 | 0.31 | 0.12 | 0.01 | |||
| 2000 | 1.34 | 0.49 | 0.18 | 0.09 | 0.28 | 0.12 | 0.01 | |||
| 1999 | 1.44 | 0.54 | 0.21 | 0.09 | 0.28 | 0.12 | 0.01 | |||
| 1998 | 1.47 | 0.54 | 0.2 | 0.09 | 0.34 | 0.12 | 0.01 | |||
| 1997 | 1.38 | 0.52 | 0.19 | 0.08 | 0.29 | 0.12 | 0.01 | |||
| 1996 | 1.38 | 0.53 | 0.19 | 0.08 | 0.27 | 0.13 | 0.01 | |||
| 1995 | 1.52 | 0.59 | 0.21 | 0.08 | 0.27 | 0.14 | 0.01 | |||
| 1994 | 1.62 | 0.65 | 0.22 | 0.08 | 0.29 | 0.15 | 0.01 | |||
| 1993 | 1.69 | 0.7 | 0.24 | 0.08 | 0.3 | 0.14 | 0.01 | |||
| 1992 | 1.67 | 0.67 | 0.24 | 0.08 | 0.31 | 0.15 | 0.01 | |||
| 1991 | 2.02 | 0.9 | 0.28 | 0.12 | 0.33 | 0.16 | 0.01 | |||
| 1990 | 1.82 | 0.77 | 0.26 | 0.1 | 0.29 | 0.16 | 0.01 | |||
| 1989 | 1.64 | 0.69 | 0.24 | 0.09 | 0.26 | 0.15 | 0.01 | |||
| 1988 | 1.63 | 0.69 | 0.24 | 0.09 | 0.25 | 0.15 | 0.01 | |||
| 1987 | 1.55 | 0.63 | 0.22 | 0.08 | 0.25 | 0.15 | 0.01 | |||
| 1986 | 1.54 | 0.67 | 0.22 | 0.09 | 0.22 | 0.14 | 0.01 | |||
| 1985 | 1.47 | 0.59 | 0.2 | 0.07 | 0.25 | 0.15 | 0.01 | |||
| 1984 | 1.53 | 0.64 | 0.22 | 0.08 | 0.22 | 0.16 | 0.01 | |||
| 1983 | 1.37 | 0.56 | 0.18 | 0.06 | 0.22 | 0.15 | 0.01 | |||
| 1982 | 1.28 | 0.47 | 0.18 | 0.05 | 0.23 | 0.15 | 0.01 | |||
| 1981 | 1.49 | 0.57 | 0.22 | 0.06 | 0.24 | 0.17 | 0.02 | |||
| 1980 | 1.4 | 0.51 | 0.2 | 0.06 | 0.23 | 0.17 | 0.01 | |||
| 1979 | 1.52 | 0.53 | 0.21 | 0.06 | 0.31 | 0.17 | 0.02 | |||
| 1978 | 1.51 | 0.53 | 0.21 | 0.06 | 0.3 | 0.17 | 0.02 | |||
| 1977 | 1.51 | 0.53 | 0.21 | 0.06 | 0.3 | 0.17 | 0.02 | |||
| 1976 | 1.52 | 0.53 | 0.21 | 0.06 | 0.3 | 0.17 | 0.02 | |||
| 1975 | 1.5 | 0.52 | 0.2 | 0.06 | 0.3 | 0.17 | 0.02 | |||
| 1974 | 1.47 | 0.52 | 0.2 | 0.06 | 0.29 | 0.17 | 0.02 | |||
| 1973 | 1.5 | 0.51 | 0.2 | 0.06 | 0.31 | 0.17 | 0.02 | |||
| 1972 | 1.49 | 0.51 | 0.2 | 0.05 | 0.31 | 0.17 | 0.02 | |||
| 1971 | 1.45 | 0.51 | 0.19 | 0.05 | 0.3 | 0.16 | 0.02 | |||
| 1970 | 1.47 | 0.51 | 0.19 | 0.05 | 0.31 | 0.17 | 0.02 | |||
| 1969 | 1.46 | 0.5 | 0.19 | 0.05 | 0.3 | 0.17 | 0.02 | |||
| 1968 | 1.44 | 0.5 | 0.18 | 0.05 | 0.29 | 0.17 | 0.02 | |||
| 1967 | 1.4 | 0.48 | 0.18 | 0.05 | 0.29 | 0.17 | 0.01 | |||
| 1966 | 1.42 | 0.48 | 0.19 | 0.05 | 0.29 | 0.17 | 0.01 | |||
| 1965 | 1.44 | 0.49 | 0.19 | 0.05 | 0.29 | 0.17 | 0.01 | |||
| 1964 | 1.4 | 0.48 | 0.19 | 0.05 | 0.26 | 0.17 | 0.01 | |||
| 1963 | 1.4 | 0.48 | 0.19 | 0.05 | 0.27 | 0.17 | 0.01 | |||
| 1962 | 1.4 | 0.47 | 0.19 | 0.05 | 0.28 | 0.17 | 0.01 | |||
| 1961 | 1.4 | 0.48 | 0.19 | 0.05 | 0.28 | 0.17 | 0.01 | |||
| 1960 | 1.39 | 0.48 | 0.19 | 0.05 | 0.28 | 0.17 | 0.01 | |||
| 1959 | 1.44 | 0.49 | 0.2 | 0.05 | 0.27 | 0.18 | 0.01 | |||
| 1958 | 1.52 | 0.51 | 0.21 | 0.05 | 0.31 | 0.18 | 0.01 | |||
| 1957 | 1.48 | 0.51 | 0.21 | 0.05 | 0.29 | 0.18 | 0.01 | |||
| 1956 | 1.38 | 0.52 | 0.21 | 0.06 | 0.18 | 0.2 | 0.01 | |||
| 1955 | 1.67 | 0.53 | 0.22 | 0.06 | 0.39 | 0.19 | 0.01 | |||
| 1954 | 1.39 | 0.44 | 0.2 | 0.06 | 0.28 | 0.18 | 0.01 | |||
| 1953 | 1.52 | 0.52 | 0.22 | 0.06 | 0.29 | 0.18 | 0.01 | |||
| 1952 | 1.44 | 0.49 | 0.21 | 0.05 | 0.24 | 0.19 | 0.01 | |||
| 1951 | 1.98 | 0.64 | 0.3 | 0.07 | 0.34 | 0.23 | 0.01 | |||
| 1950 | 2.26 | 0.73 | 0.34 | 0.07 | 0.49 | 0.23 | 0.02 | |||
| 1949 | 2.31 | 0.78 | 0.35 | 0.07 | 0.51 | 0.23 | 0.02 | |||
| 1948 | 3.3 | 1.17 | 0.44 | 0.11 | 0.75 | 0.3 | 0.03 | |||
| 1947 | 3.38 | 1.12 | 0.46 | 0.11 | 0.84 | 0.29 | 0.03 | |||
| 1946 | 3.14 | 1.07 | 0.47 | 0.1 | 0.77 | 0.3 | 0.03 | |||
| 1945 | 3.16 | 1.07 | 0.49 | 0.1 | 0.75 | 0.32 | 0.04 | |||
| 1944 | 3.07 | 1.05 | 0.52 | 0.1 | 0.68 | 0.3 | 0.04 | |||
| 1943 | 3.49 | 1.13 | 0.57 | 0.11 | 0.85 | 0.3 | 0.06 | |||
| 1942 | 3.36 | 1.06 | 0.52 | 0.12 | 0.87 | 0.27 | 0.04 | |||
| 1941 | 1.9 | 0.65 | 0.32 | 0.09 | 0.34 | 0.23 | 0.01 | |||
| 1940 | 2.05 | 0.73 | 0.31 | 0.09 | 0.34 | 0.26 | 0.02 | |||
| 1939 | 1.91 | 0.67 | 0.3 | 0.09 | 0.32 | 0.25 | 0.02 | |||
| 1938 | 1.69 | 0.57 | 0.29 | 0.08 | 0.26 | 0.24 | 0.01 | |||
| 1937 | 1.54 | 0.52 | 0.27 | 0.07 | 0.21 | 0.23 | 0.01 | |||
| 1936 | 1.66 | 0.58 | 0.3 | 0.07 | 0.22 | 0.24 | 0.01 | |||
| 1935 | 1.5 | 0.47 | 0.29 | 0.06 | 0.18 | 0.22 | 0.01 | |||
| 1934 | 1.51 | 0.48 | 0.26 | 0.06 | 0.19 | 0.24 | 0.01 | |||
| 1933 | 1.22 | 0.43 | 0.17 | 0.05 | 0.14 | 0.19 | 0.01 | |||
| 1932 | 1.5 | 0.54 | 0.24 | 0.06 | 0.15 | 0.26 | 0.02 | |||
| 1931 | 1.44 | 0.5 | 0.25 | 0.06 | 0.13 | 0.25 | 0.01 | |||
| 1930 | 1.07 | 0.32 | 0.16 | 0.05 | 0.12 | 0.21 | 0.01 | |||
| 1929 | 1.26 | 0.38 | 0.21 | 0.05 | 0.14 | 0.22 | 0.01 | |||
| 1928 | 1.21 | 0.39 | 0.19 | 0.05 | 0.13 | 0.2 | 0.01 | |||
| 1927 | 1.09 | 0.32 | 0.17 | 0.04 | 0.11 | 0.21 | 0.01 | |||
| 1926 | 0.86 | 0.25 | 0.13 | 0.03 | 0.06 | 0.2 | 0.01 | |||
| 1925 | 1 | 0.36 | 0.16 | 0.04 | 0.05 | 0.19 | 0.01 | |||
| 1924 | 1.08 | 0.4 | 0.2 | 0.04 | 0.06 | 0.19 | 0.02 | |||
| 1923 | 0.8 | 0.21 | 0.15 | 0.04 | 0.06 | 0.16 | 0.01 | |||
| 1922 | 0.82 | 0.18 | 0.19 | 0.04 | 0.07 | 0.15 | 0.01 | |||
| 1921 | 0.98 | 0.22 | 0.26 | 0.06 | 0.09 | 0.14 | 0.01 | |||
| 1920 | 1 | 0.23 | 0.32 | 0.06 | 0.08 | 0.13 | 0.01 | |||
| 1919 | 0.96 | 0.2 | 0.3 | 0.06 | 0.09 | 0.13 | 0.01 | |||
| 1918 | 1.33 | 0.32 | 0.4 | 0.06 | 0.21 | 0.14 | 0.01 | |||
| 1917 | 1.31 | 0.26 | 0.38 | 0.05 | 0.26 | 0.15 | 0.01 | |||
| 1916 | 0.88 | 0.11 | 0.23 | 0.03 | 0.12 | 0.2 | 0.01 | |||
| 1915 | 0.62 | 0.08 | 0.11 | 0.02 | 0.06 | 0.17 | 0.01 | |||
| 1914 | 0.53 | 0.07 | 0.07 | 0.02 | 0.05 | 0.16 | 0.01 | |||
| 1913 | 0.47 | 0.05 | 0.06 | 0.01 | 0.05 | 0.14 | 0.01 | |||
| 1912 | 0.48 | 0.05 | 0.06 | 0.01 | 0.05 | 0.15 | 0.01 | |||
| 1911 | 0.47 | 0.04 | 0.05 | 0.01 | 0.05 | 0.16 | 0.01 | |||
| 1910 | 0.46 | 0.04 | 0.05 | 0.01 | 0.04 | 0.16 | 0.01 | |||
| 1909 | 0.54 | 0.05 | 0.06 | 0.02 | 0.05 | 0.18 | 0.01 | |||


Comments