Abstract
Sunflower production in the United States has experienced significant growth over the years, with 2023 reaching a record 2.26 billion pounds. Historically, sunflower farming was concentrated in the northern Great Plains, with North Dakota being the leading state. Over time, production has expanded due to increased demand for sunflower oil and seeds, driven by health trends and biodiesel production. Sunflowers are resilient crops, adaptable to varying climates, and thrive in areas with moderate rainfall. This growth in sunflower farming has supported both the food and energy industries.
All Himawari classes (from all over the world).
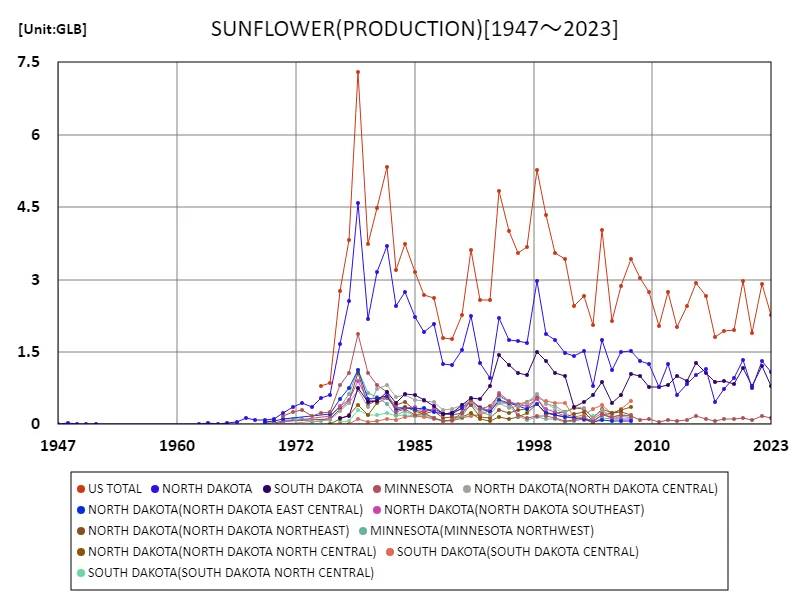
Sunflower production in the U.S. has fluctuated significantly from 1947 to 2023, with a peak in 1979 at £7.3 billion. Since then, total production has declined to 31% of that peak, reflecting shifts in agricultural priorities and market dynamics. The U.S. has faced challenges such as changing crop demands, fluctuating prices, and competition from other oilseed crops. Despite this decline, sunflower farming remains an important industry, with the U.S. continuing to be a key global producer, especially in oil and seed markets. The crop’s resilience and diverse uses sustain its relevance.


The maximum is 7.3GLB[1979] of US TOTAL, and the current value is about 31%
All sunflower classes (latest year, worldwide).
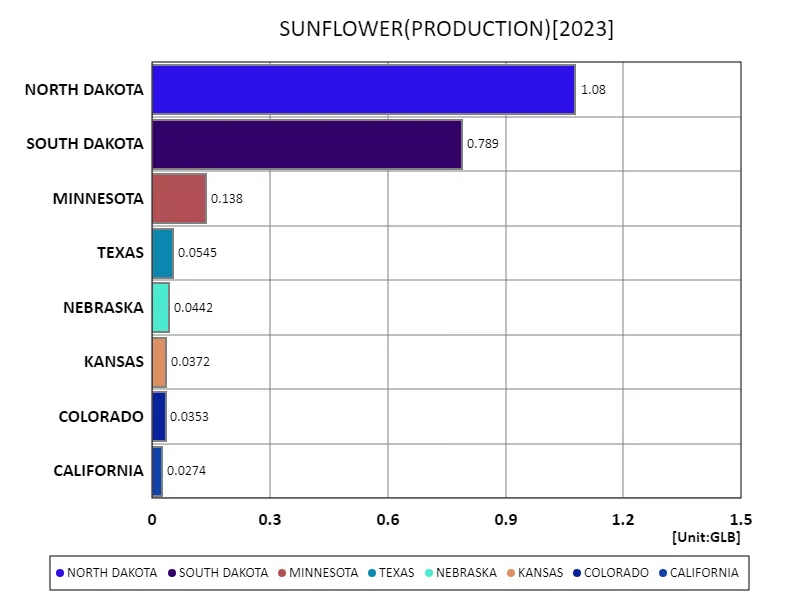
In 2023, North Dakota led U.S. sunflower production with 1.08 billion pounds, a significant share of the national total of 2.2 billion pounds. Historically, North Dakota has been the dominant producer, contributing a substantial portion of the nation’s sunflower output, with average state production around 275 million pounds. Sunflower farming in the U.S. has been shaped by the state’s favorable climate and soil conditions. Over time, production has fluctuated, influenced by market demand, especially for sunflower oil and seeds, making it a key crop for both food and industrial uses.


The maximum is 1.08GLB of NORTH DAKOTA, the average is 275MLB, and the total is 2.2GLB
All sunflower classes (continent).
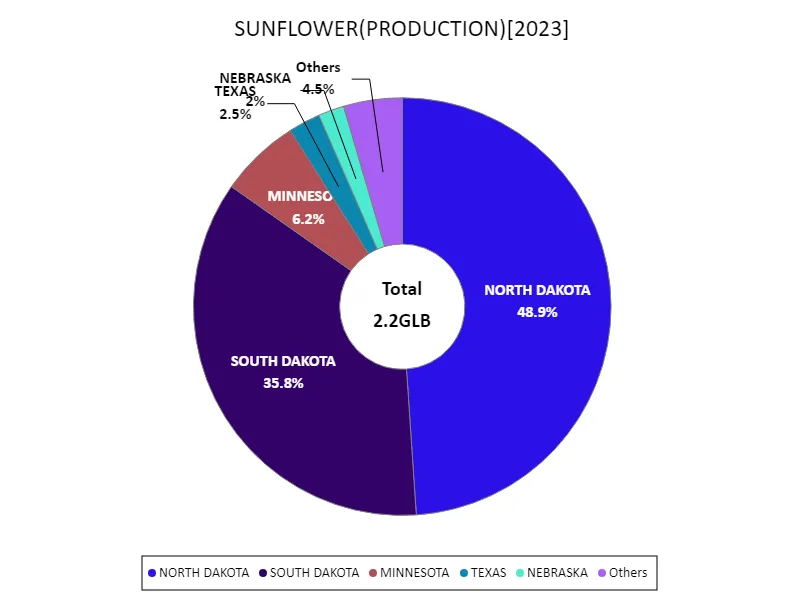
In 2023, North Dakota led U.S. sunflower production with 1.08 billion pounds, representing a significant share of the national total of 2.2 billion pounds. Sunflowers thrive in the state’s favorable growing conditions, including its climate and soil, which have made it the dominant producer for decades. The U.S. sunflower industry has evolved with increased demand for sunflower oil and seeds, particularly for food and biodiesel production. Despite fluctuations in production, North Dakota’s consistent leadership highlights the state’s pivotal role in shaping national sunflower farming trends.今のところ、この会話は役に立ちましたか?


The maximum is 1.08GLB of NORTH DAKOTA, the average is 275MLB, and the total is 2.2GLB
Main data
| SUNFLOWER(ALL CLASSES, ALL PRODUCTION PRACTICES, ALL UTILIZATION PRACTICES, PRODUCTION, UNITED STATES) [GLB] | ||||||||||
|---|---|---|---|---|---|---|---|---|---|---|
| US TOTAL | NORTH DAKOTA | SOUTH DAKOTA | SOUTH DAKOTA(SOUTH DAKOTA CENTRAL SULLY) | MINNESOTA | NORTH DAKOTA(NORTH DAKOTA SOUTH CENTRAL EMMONS) | NORTH DAKOTA(NORTH DAKOTA SOUTH CENTRAL MORTON) | NEBRASKA | SOUTH DAKOTA(SOUTH DAKOTA NORTH CENTRAL POTTER) | NORTH DAKOTA(NORTH DAKOTA SOUTHWEST ADAMS) | |
| 2023 | 2.26 | 1.08 | 0.79 | 0.14 | 0.04 | |||||
| 2022 | 2.91 | 1.31 | 1.2 | 0.18 | 0.17 | 0.13 | 0.08 | 0.08 | 0.08 | 0.08 |
| 2021 | 1.9 | 0.76 | 0.79 | 0.09 | 0.03 | |||||
| 2020 | 2.98 | 1.34 | 1.17 | 0.14 | 0.05 | |||||
| 2019 | 1.95 | 0.96 | 0.83 | 0.11 | 0.04 | |||||
| 2018 | 1.93 | 0.74 | 0.9 | 0.11 | 0.05 | |||||
| 2017 | 1.81 | 0.46 | 0.88 | 0.24 | 0.08 | 0.11 | 0.04 | 0.06 | 0.09 | 0.02 |
| 2016 | 2.65 | 1.14 | 1.06 | 0.11 | 0.06 | |||||
| 2015 | 2.93 | 1.02 | 1.27 | 0.17 | 0.05 | |||||
| 2014 | 2.45 | 0.84 | 0.9 | 0.09 | 0.04 | |||||
| 2013 | 2.02 | 0.6 | 1 | 0.07 | 0.03 | |||||
| 2012 | 2.74 | 1.25 | 0.82 | 0.15 | 0.09 | 0.11 | 0.09 | 0.03 | 0.09 | 0.03 |
| 2011 | 2.04 | 0.77 | 0.78 | 0.05 | 0.08 | |||||
| 2010 | 2.74 | 1.25 | 0.77 | 0.12 | 0.08 | |||||
| 2009 | 3.04 | 1.32 | 1 | 0.09 | 0.06 | |||||
| 2008 | 3.42 | 1.51 | 1.05 | 0.2 | 0.16 | 0.14 | 0.08 | |||
| 2007 | 2.87 | 1.5 | 0.61 | 0.15 | 0.19 | 0.11 | 0.03 | 0.06 | 0.07 | 0.01 |
| 2006 | 2.14 | 1.11 | 0.44 | 0.15 | 0.04 | 0.06 | 0.03 | |||
| 2005 | 4.02 | 1.75 | 0.88 | 0.18 | 0.18 | 0.15 | 0.02 | 0.14 | 0.09 | |
| 2004 | 2.05 | 0.79 | 0.61 | 0.14 | 0.06 | 0.06 | 0.05 | 0.09 | 0 | |
| 2003 | 2.67 | 1.52 | 0.46 | 0.08 | 0.14 | 0.06 | 0.01 | 0.06 | 0.05 | 0 |
| 2002 | 2.45 | 1.41 | 0.36 | 0.06 | 0.08 | 0.07 | 0.04 | 0.03 | 0.03 | 0.01 |
| 2001 | 3.42 | 1.47 | 1 | 0.19 | 0.07 | 0.1 | 0.05 | 0.08 | 0.11 | 0.02 |
| 2000 | 3.54 | 1.74 | 1.06 | 0.19 | 0.13 | 0.12 | 0.06 | 0.06 | 0.11 | 0.02 |
| 1999 | 4.34 | 1.87 | 1.3 | 0.2 | 0.16 | 0.08 | 0.04 | 0.12 | 0.11 | 0.02 |
| 1998 | 5.27 | 2.97 | 1.51 | 0.18 | 0.16 | 0.09 | 0.02 | 0.08 | 0.13 | 0.02 |
| 1997 | 3.68 | 1.68 | 1.02 | 0.11 | 0.13 | 0.02 | 0.01 | 0.06 | 0.07 | 0 |
| 1996 | 3.56 | 1.73 | 1.06 | 0.09 | 0.18 | 0.02 | 0.01 | 0.05 | 0.08 | 0 |
| 1995 | 4.01 | 1.75 | 1.22 | 0.11 | 0.46 | 0.02 | 0.01 | 0.08 | 0.07 | 0 |
| 1994 | 4.84 | 2.2 | 1.43 | 0.09 | 0.6 | 0.01 | 0.01 | 0.07 | 0.05 | 0 |
| 1993 | 2.57 | 0.97 | 0.79 | 0.08 | 0.38 | 0 | 0 | 0.07 | 0.03 | 0 |
| 1992 | 2.56 | 1.27 | 0.53 | 0.06 | 0.31 | 0 | 0 | 0.05 | 0.02 | 0 |
| 1991 | 3.61 | 2.24 | 0.55 | 0.05 | 0.51 | 0 | 0 | 0.04 | 0.01 | 0 |
| 1990 | 2.27 | 1.54 | 0.4 | 0.04 | 0.23 | 0 | 0 | 0.01 | 0 | |
| 1989 | 1.76 | 1.23 | 0.24 | 0.02 | 0.1 | 0 | 0.01 | 0.01 | 0 | |
| 1988 | 1.79 | 1.26 | 0.2 | 0.02 | 0.06 | 0 | 0.01 | 0.01 | 0 | |
| 1987 | 2.61 | 2.08 | 0.39 | 0.03 | 0.13 | 0.01 | 0.03 | 0.01 | 0.01 | |
| 1986 | 2.68 | 1.9 | 0.51 | 0.05 | 0.23 | 0.01 | 0.02 | 0.02 | 0.01 | |
| 1985 | 3.15 | 2.22 | 0.61 | 0.06 | 0.2 | 0.01 | 0.02 | 0.02 | 0.02 | |
| 1984 | 3.74 | 2.75 | 0.63 | 0.06 | 0.31 | 0.02 | 0.02 | 0.02 | 0.03 | |
| 1983 | 3.2 | 2.45 | 0.45 | 0.04 | 0.26 | 0.01 | 0.02 | 0.01 | 0.02 | |
| 1982 | 5.33 | 3.7 | 0.66 | 0.04 | 0.68 | 0.02 | 0.02 | 0.01 | 0.02 | |
| 1981 | 4.49 | 3.16 | 0.47 | 0.02 | 0.82 | 0.01 | 0.01 | 0.01 | 0.01 | |
| 1980 | 3.74 | 2.18 | 0.46 | 0.01 | 1.05 | 0 | 0 | 0 | 0 | |
| 1979 | 7.3 | 4.58 | 0.76 | 0.06 | 1.87 | 0.01 | 0 | 0.01 | 0.01 | |
| 1978 | 3.82 | 2.55 | 0.18 | 0.01 | 1.07 | 0 | 0 | 0 | 0.01 | |
| 1977 | 2.76 | 1.66 | 0.13 | 0 | 0.81 | 0 | 0 | 0 | ||
| 1976 | 0.86 | 0.6 | 0.26 | 0 | ||||||
| 1975 | 0.79 | 0.55 | 0.24 | |||||||
| 1974 | 0.35 | 0.17 | ||||||||
| 1973 | 0.43 | 0.29 | ||||||||
| 1972 | 0.37 | 0.26 | ||||||||
| 1971 | 0.24 | 0.17 | ||||||||
| 1970 | 0.11 | |||||||||
| 1969 | 0.1 | |||||||||
| 1968 | 0.09 | |||||||||
| 1967 | 0.13 | |||||||||
| 1966 | 0.04 | |||||||||
| 1965 | 0.02 | |||||||||
| 1964 | 0.01 | |||||||||
| 1963 | 0.03 | |||||||||
| 1962 | 0.01 | |||||||||
| 1951 | 0 | |||||||||
| 1950 | 0 | |||||||||
| 1949 | 0.01 | |||||||||
| 1948 | 0.02 | |||||||||
| 1947 | 0 | |||||||||


Comments