Abstract
Historically, lentil yields in the U.S. have fluctuated, with regions like Washington showing notable peaks. Over the past decade, Washington has consistently led in yield efficiency, reflecting advances in agricultural practices and favorable growing conditions. Despite this, overall U.S. lentil production remains modest compared to global outputs, with countries like Canada dominating the market. The trend towards higher yields in Washington indicates improvements in crop management and technology, potentially setting a benchmark for other regions to follow.
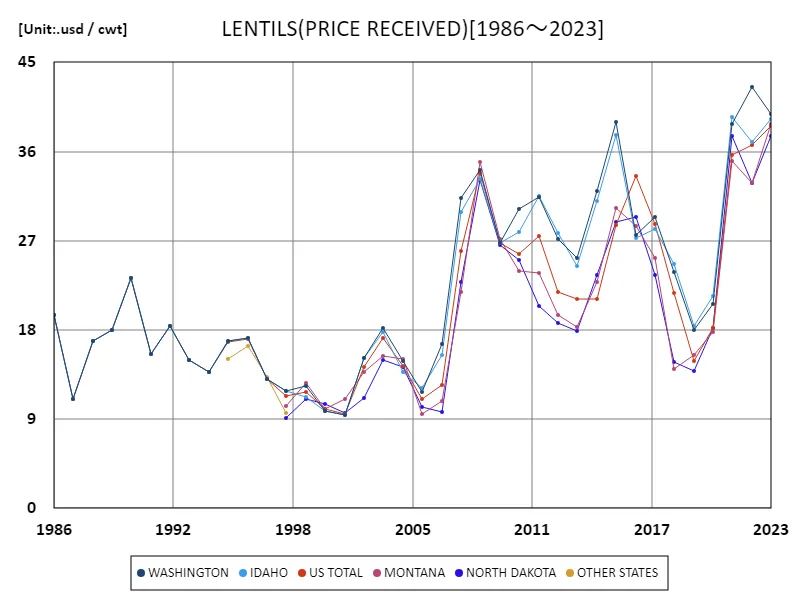
Lentil production Annual crop measured in cwt
Since 1986, Washington state has led U.S. lentil yields, reaching a peak of $42.5/cwt in 2022. As of 2023, the yield is at 93.6% of this peak, showcasing consistent high performance. This trend reflects Washington’s advancements in agricultural technology and efficient crop management. Despite a slight decline from the peak, the state remains a top producer, with its yields setting a high benchmark in the global lentil market. This stability underscores Washington’s role as a key player in U.S. lentil production and its ability to adapt and innovate.


The maximum is 42.5usd / cwt[2022] of WASHINGTON, and the current value is about 93.6%
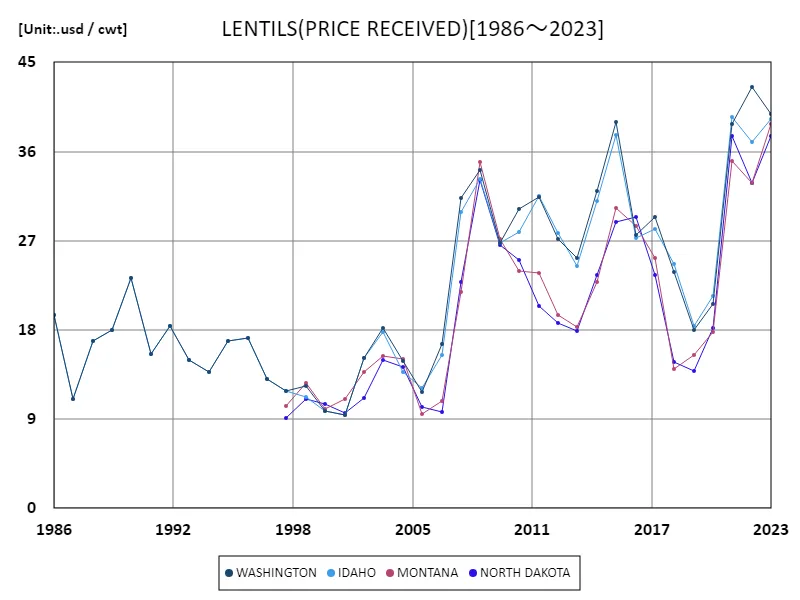
Lentil Production Annual crop measured in cwt (50 US states)
Since 1986, Washington state has led U.S. lentil yields, reaching a peak of $42.5/cwt in 2022. As of 2023, the yield is at 93.6% of this peak, showcasing consistent high performance. This trend reflects Washington’s advancements in agricultural technology and efficient crop management. Despite a slight decline from the peak, the state remains a top producer, with its yields setting a high benchmark in the global lentil market. This stability underscores Washington’s role as a key player in U.S. lentil production and its ability to adapt and innovate.


The maximum is 42.5usd / cwt[2022] of WASHINGTON, and the current value is about 93.6%
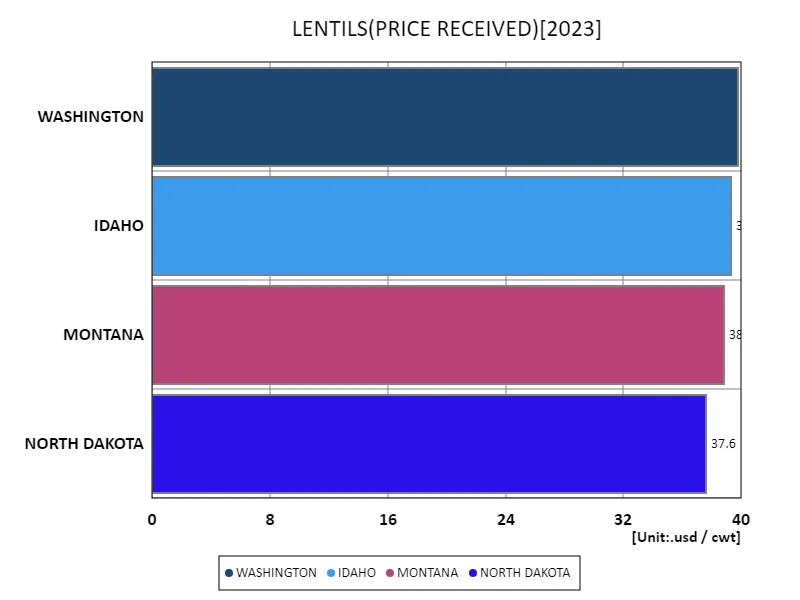
Lentil production Annual crop measured in cwt (latest year, 50 US states)
In 2023, Washington state led U.S. lentil yields with a notable $39.8/cwt, surpassing the national average of $38.9/cwt. Despite this, the total global yield averaged $156/cwt, highlighting Washington’s significant but relative position in the global market. This peak reflects Washington’s effective cultivation practices and favorable growing conditions. The state’s high yield underscores ongoing advancements in agricultural techniques, maintaining its strong performance and setting a benchmark for the U.S. lentil industry amid varied global production levels.


The maximum is 39.8usd / cwt of WASHINGTON, the average is 38.9usd / cwt, and the total is 156usd / cwt
Main data
| LENTILS(ALL CLASSES, ALL PRODUCTION PRACTICES, ALL UTILIZATION PRACTICES, PRICE RECEIVED, UNITED STATES) [usd / cwt] | |||||
|---|---|---|---|---|---|
| WASHINGTON | IDAHO | MONTANA | US TOTAL | NORTH DAKOTA | |
| 2023 | 39.8 | 39.3 | 38.8 | 38.6 | 37.6 |
| 2022 | 42.5 | 37 | 32.8 | 36.7 | 32.8 |
| 2021 | 38.8 | 39.5 | 35 | 35.6 | 37.6 |
| 2020 | 20.6 | 21.4 | 17.8 | 18.2 | 18.2 |
| 2019 | 18 | 18.4 | 15.5 | 14.9 | 13.9 |
| 2018 | 23.8 | 24.6 | 14.1 | 21.7 | 14.8 |
| 2017 | 29.4 | 28.2 | 25.3 | 28.7 | 23.5 |
| 2016 | 27.6 | 27.3 | 28.5 | 33.5 | 29.4 |
| 2015 | 39 | 37.7 | 30.3 | 28.6 | 28.9 |
| 2014 | 32 | 31 | 22.8 | 21.1 | 23.5 |
| 2013 | 25.3 | 24.4 | 18.3 | 21.1 | 17.9 |
| 2012 | 27.2 | 27.8 | 19.5 | 21.8 | 18.7 |
| 2011 | 31.4 | 31.5 | 23.7 | 27.5 | 20.4 |
| 2010 | 30.2 | 27.9 | 23.9 | 25.7 | 25.1 |
| 2009 | 26.8 | 26.8 | 27.2 | 26.8 | 26.6 |
| 2008 | 34.1 | 33.2 | 34.9 | 33.8 | 33.1 |
| 2007 | 31.3 | 29.9 | 21.8 | 26 | 22.8 |
| 2006 | 16.6 | 15.5 | 10.8 | 12.4 | 9.72 |
| 2005 | 11.7 | 12.1 | 9.54 | 11 | 10.2 |
| 2004 | 14.9 | 13.8 | 15.1 | 14.4 | 14.3 |
| 2003 | 18.2 | 17.8 | 15.4 | 17.2 | 15 |
| 2002 | 15.2 | 15.2 | 13.8 | 14.3 | 11.1 |
| 2001 | 9.4 | 9.4 | 11 | 9.56 | 9.6 |
| 2000 | 9.8 | 9.8 | 10 | 10 | 10.5 |
| 1999 | 12.3 | 11.2 | 12.6 | 11.7 | 11 |
| 1998 | 11.8 | 11.8 | 10.3 | 11.3 | 9.1 |
| 1997 | 13 | 13 | 13 | ||
| 1996 | 17.2 | 17.2 | 17.1 | ||
| 1995 | 16.9 | 16.9 | 16.8 | ||
| 1994 | 13.8 | 13.8 | 13.8 | ||
| 1993 | 15 | 15 | 15 | ||
| 1992 | 18.4 | 18.4 | 18.4 | ||
| 1991 | 15.6 | 15.6 | 15.6 | ||
| 1990 | 23.2 | 23.2 | 23.2 | ||
| 1989 | 18 | 18 | 18 | ||
| 1988 | 16.9 | 16.9 | 16.9 | ||
| 1987 | 11 | 11 | 11 | ||
| 1986 | 19.5 | 19.5 | 19.5 | ||


Comments