Abstract
Looking at data on annual safflower crop prices in the United States, Idaho has the highest price in 2023, at $39.5/cwt. Based on historical trends, safflower prices vary by region and year, particularly depending on the balance of supply and demand in major producing regions. Idaho’s high prices are likely due to higher local production costs and improved quality. In the past, prices have often been unstable and have seen large fluctuations in price due to changes in market demand. In particular, increased demand for its use as an oil and fat and as a health food may be affecting prices.
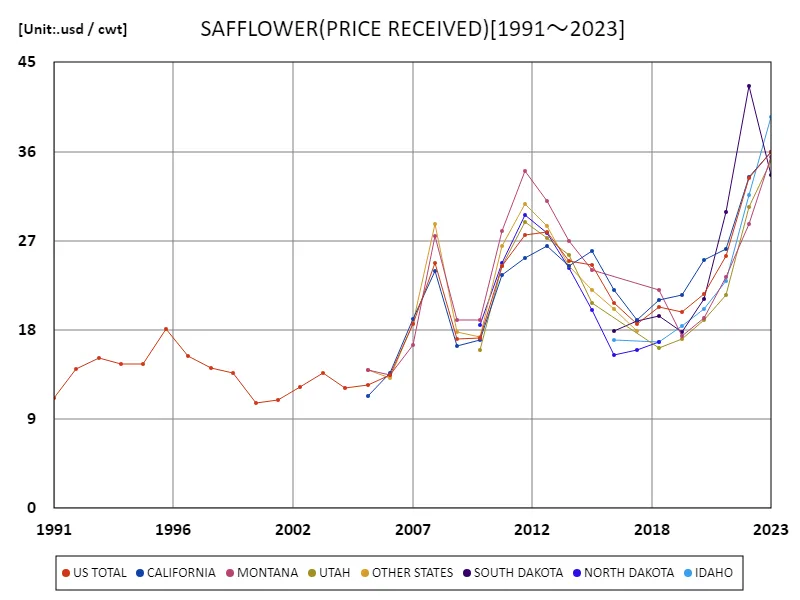
Safflower production Annual crop measured in cwt
Based on data from 1991 to 2023, safflower prices in the United States have shown significant regional variation. Notably, South Dakota recorded the highest price in 2022, at $42.6/cwt, but current prices are only 78.9% of the peak. This variation is due to changes in supply and demand, regional production costs, weather conditions and fluctuating market demand. South Dakota’s price peak was likely driven by specific production conditions and increased market demand, but prices subsequently declined due to increased supply and price adjustments. Overall, safflower prices fluctuate from year to year, with notable price peaks in certain years and regions.


The maximum is 42.6usd / cwt[2022] of SOUTH DAKOTA, and the current value is about 78.9%
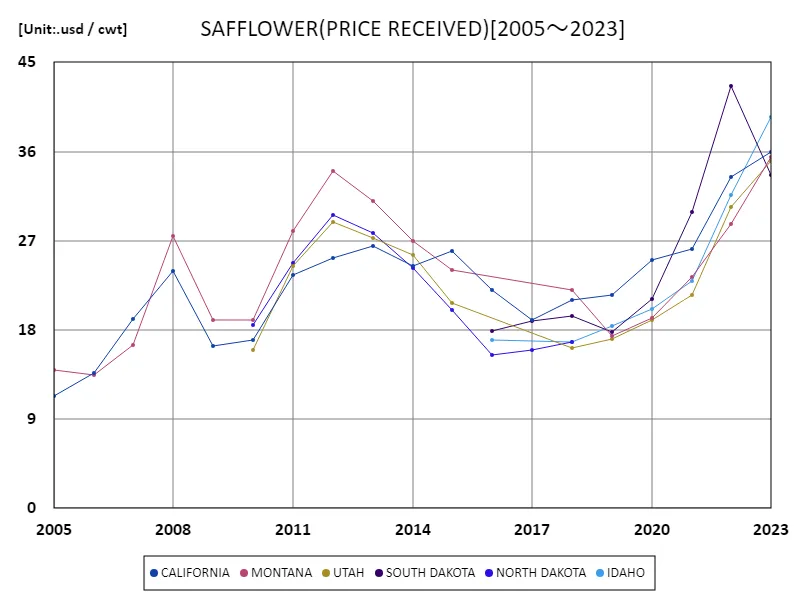
Safflower Production Annual crop measured in cwt (50 US states)
Data from 2005 to 2023 shows that safflower prices in the United States have shown large fluctuations. The highest price of $42.6/cwt was recorded in South Dakota in 2022, but current prices are down to 78.9% of that peak. This price fluctuation is driven by several factors including shifts in supply and demand, weather conditions, regional production costs and market trends. The price peak in South Dakota in particular was likely influenced by localized production conditions and sudden fluctuations in supply and demand. However, the price decline is said to be due to increased supply, market maturity, and the introduction of new production technologies. Overall, safflower prices have shown some fluctuation over the past few years, marked by notable price peaks in certain years and regions.


The maximum is 42.6usd / cwt[2022] of SOUTH DAKOTA, and the current value is about 78.9%
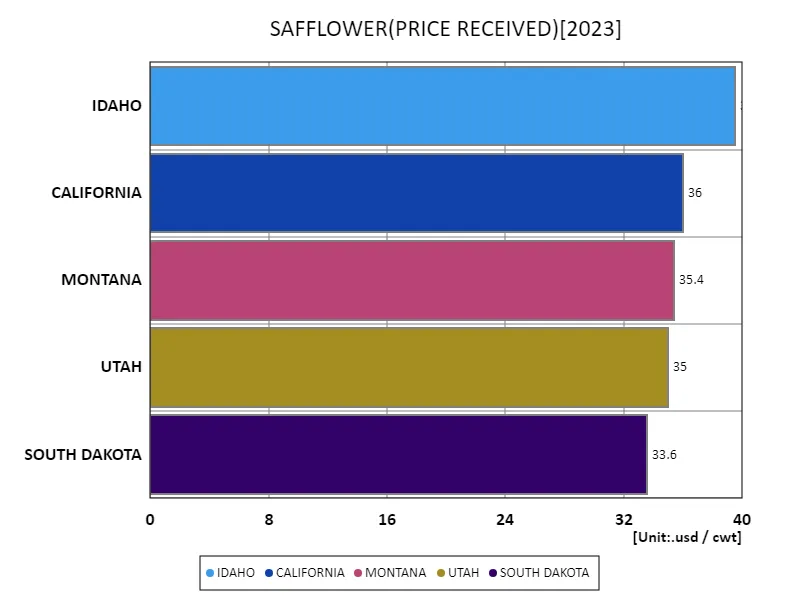
Safflower production Annual crop measured in cwt (latest year, 50 US states)
According to 2023 U.S. safflower data, Idaho recorded the highest price at $39.5/cwt, with an overall average price of $35.9/cwt and a total price of $180/cwt. The data shows that while Idaho has higher prices, average prices overall remain relatively stable. Idaho’s higher prices may be due to higher local production costs and improved quality. Additionally, price fluctuations are caused by multiple factors, including supply and demand balance, market demand, and weather conditions. Overall, prices vary from region to region, and it can be seen that the characteristics of each production region are reflected in the prices.


The maximum is 39.5usd / cwt of IDAHO, the average is 35.9usd / cwt, and the total is 180usd / cwt
Main data
| SAFFLOWER(ALL CLASSES, ALL PRODUCTION PRACTICES, ALL UTILIZATION PRACTICES, PRICE RECEIVED, UNITED STATES) [usd / cwt] | ||||||
|---|---|---|---|---|---|---|
| IDAHO | US TOTAL | CALIFORNIA | MONTANA | UTAH | SOUTH DAKOTA | |
| 2023 | 39.5 | 36 | 36 | 35.4 | 35 | 33.6 |
| 2022 | 31.6 | 33.3 | 33.4 | 28.7 | 30.4 | 42.6 |
| 2021 | 22.9 | 25.5 | 26.2 | 23.3 | 21.5 | 29.9 |
| 2020 | 20.1 | 21.6 | 25.1 | 19.2 | 19 | 21.1 |
| 2019 | 18.4 | 19.8 | 21.5 | 17.4 | 17.1 | 17.8 |
| 2018 | 16.8 | 20.3 | 21 | 22 | 16.2 | 19.4 |
| 2017 | 18.6 | 19 | 18.9 | |||
| 2016 | 17 | 20.7 | 22 | 17.9 | ||
| 2015 | 24.5 | 26 | 24 | 20.7 | ||
| 2014 | 25 | 24.4 | 27 | 25.6 | ||
| 2013 | 27.9 | 26.5 | 31 | 27.3 | ||
| 2012 | 27.6 | 25.3 | 34 | 28.9 | ||
| 2011 | 24.4 | 23.5 | 28 | 24.4 | ||
| 2010 | 17.2 | 17 | 19 | 16 | ||
| 2009 | 17.1 | 16.4 | 19 | |||
| 2008 | 24.8 | 23.9 | 27.5 | |||
| 2007 | 18.6 | 19.1 | 16.5 | |||
| 2006 | 13.5 | 13.7 | 13.5 | |||
| 2005 | 12.4 | 11.3 | 14 | |||
| 2004 | 12.1 | |||||
| 2003 | 13.7 | |||||
| 2002 | 12.2 | |||||
| 2001 | 10.9 | |||||
| 2000 | 10.6 | |||||
| 1999 | 13.7 | |||||
| 1998 | 14.2 | |||||
| 1997 | 15.4 | |||||
| 1996 | 18.1 | |||||
| 1995 | 14.6 | |||||
| 1994 | 14.6 | |||||
| 1993 | 15.2 | |||||
| 1992 | 14.1 | |||||
| 1991 | 11.1 | |||||


Comments