Abstract
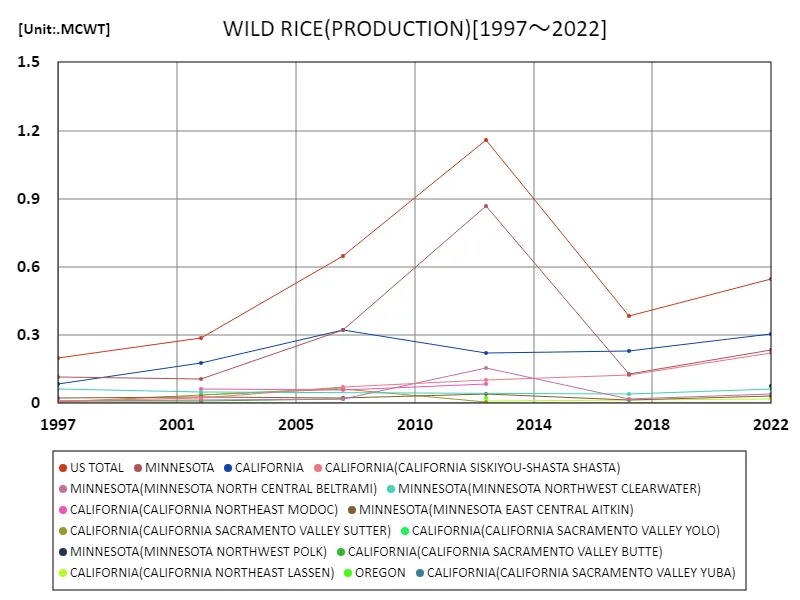
The United States plays a key role in wild rice production. Looking specifically at the data for cultivated wild rice, total U.S. production in 2022 could reach a maximum of 545,000 cwt (centiwts). This figure is the highest in recent years and indicates that wild rice production is stable. Looking back at data from the past few years, wild rice production in the United States has shown a consistent trend, with production varying by region but remaining consistent overall. The main production areas, Minnesota and Wisconsin, have ideal climate and soil conditions, which results in little fluctuation in production and allows for a stable supply. Factors that affect production volumes include climate change, market demand, and government policies, but the U.S. wild rice industry appears to be able to establish a sustainable production system despite these influences.
Wild rice production
Based on data from 1997 to 2022, there is significant variation in U.S. wild rice production. Notably, the peak annual crop total of 1.16 million cwt was recorded in 2012, whereas the 2022 production volume is 47.1% of that figure, or approximately 545,000 cwt. This decline is likely the result of a combination of factors, including production instability, market changes, and climate change. Data dating back to 1997 shows that production volumes tend to fluctuate cyclically, with large increases and decreases in certain years. Wild rice production has been declining, especially since it peaked in 2012. This may be due to climate change, with extreme weather, droughts and floods impacting production. Changes in market demand and rising production costs are also cited as contributing factors. Despite the decline in production, the wild rice industry in the United States remains important and production remains stable in some areas. In the future, climate adaptation measures and improved production technologies will be the key to restoring production volumes.


The maximum is 1.16MCWT[2012] of US TOTAL, and the current value is about 47.1%
Wild rice production (50 states)
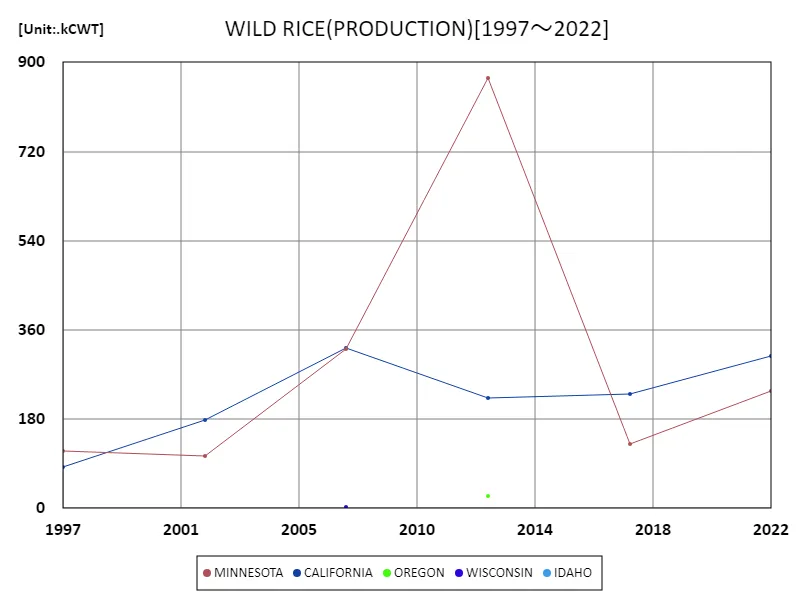
Based on data from 1997 to 2022, wild rice production in Minnesota has shown notable fluctuations. In particular, the annual crop total peaked at 867,000 cwt (centi-irs) in 2012, but by 2022 had declined to about 236,000 cwt, or 27.2% of that figure. This downward trend is driven by several factors. Minnesota is the wild rice production center of the United States, and the state’s climate and topography are ideal for growing wild rice. However, in recent years, climate change has had a major impact on production. Extreme weather, drought and extreme weather events have a direct impact on production, resulting in reduced yields. Environmental protection policies and water quality issues may also be affecting production volumes. In addition, fluctuations in market demand and rising production costs are also thought to be contributing factors. Economic pressures and technical challenges faced by producers may also be contributing to the decline in wild rice production. In order to stabilize wild rice production in Minnesota in the future, measures to adapt to climate change and improvements in production techniques will be required. Additionally, the implementation of sustainable management practices will contribute to the recovery of production.


The maximum is 867kCWT[2012] of MINNESOTA, and the current value is about 27.2%
Wild rice production (latest year, 50 US states)
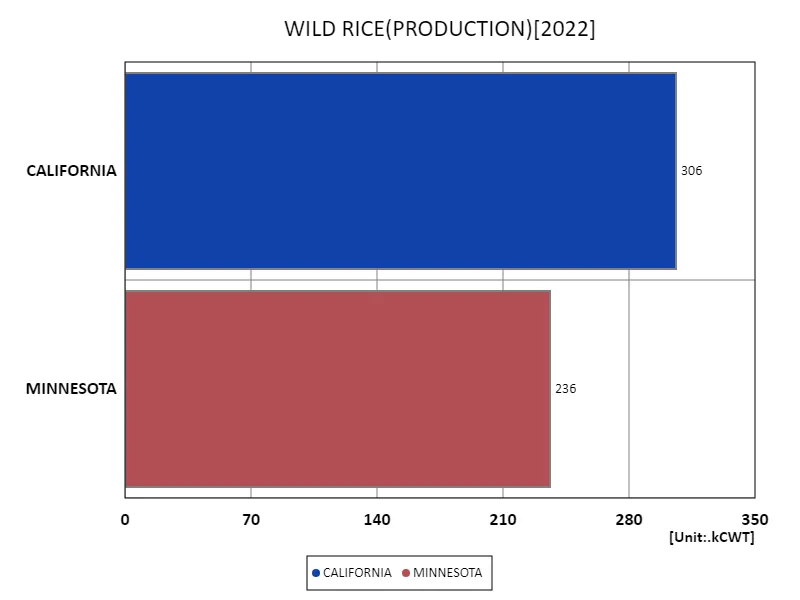
According to 2022 data, overall U.S. wild rice production reached 543,000 cwt (centiwt). The data for that year highlights that California recorded the largest production, reaching 306,000 cwt. On the other hand, the overall average production was 271,000 cwt, with California accounting for the majority of total production. The data show that wild rice production in the United States varies greatly by region. California’s mild climate and proper water management contribute to production, allowing it to maintain high production volumes. On the other hand, compared to other major producing states such as Minnesota and Wisconsin, production volumes have remained stable but tend to be relatively small compared to California. In recent years, wild rice production has been affected by climate change, water resource management, and economic factors, resulting in fluctuations in overall production, but California’s high production levels are currently pushing up the average. In order to stabilize and increase production in the future, appropriate measures will be required that are tailored to the characteristics of each region.


The maximum is 306kCWT of CALIFORNIA, the average is 271kCWT, and the total is 543kCWT
Main data
| WILD RICE(ALL CLASSES, ALL PRODUCTION PRACTICES, ALL UTILIZATION PRACTICES, PRODUCTION, UNITED STATES) [kCWT] | |||||||||
|---|---|---|---|---|---|---|---|---|---|
| US TOTAL | CALIFORNIA | MINNESOTA | CALIFORNIA(CALIFORNIA SISKIYOU-SHASTA SHASTA) | MINNESOTA(MINNESOTA NORTHWEST POLK) | MINNESOTA(MINNESOTA NORTHWEST CLEARWATER) | MINNESOTA(MINNESOTA NORTH CENTRAL BELTRAMI) | MINNESOTA(MINNESOTA EAST CENTRAL AITKIN) | CALIFORNIA(CALIFORNIA NORTHEAST LASSEN) | |
| 2022 | 545.11 | 306.37 | 236.37 | 222.68 | 75 | 62.5 | 40.32 | 31.71 | 16.74 |
| 2017 | 383 | 229.66 | 129.4 | 122.6 | 39.51 | 16.78 | 16.61 | ||
| 2012 | 1156.23 | 221.64 | 867.47 | 102.62 | 156.05 | 43 | 8.24 | ||
| 2007 | 646.6 | 322.69 | 320.7 | 71.18 | 17.39 | 21.38 | |||
| 2002 | 285.59 | 178.19 | 106.52 | 24.67 | 49.02 | 15.66 | 26.7 | ||
| 1997 | 200.44 | 83.76 | 115.78 | 9.83 | 64.08 | 8.88 | 21.83 | ||


Comments