
Abstract
The area planted to hazelnuts in the United States is largely produced in Oregon, so agricultural trends there have a major impact on the overall area. According to 2022 data, the total planted area in the United States reached 93.2 thousand acres. Looking at trends over the past few years, hazelnut production in the United States has been on the rise, with yields improving, especially in Oregon, thanks to improved varieties and the introduction of efficient cultivation techniques. This increase indicates that hazelnuts are an attractive crop for farmers due to their high demand and market value. However, the effects of climate change and pests and diseases cannot be ignored, and sustainable agricultural practices are required. Overall, the U.S. hazelnut industry is expected to continue to grow, but adapting and innovating will be key.
Hazelnut plantation area
The overall hazelnut acreage in the United States from 1997 to 2022 is on the rise. Notably, in 2022, it reached 93.2 thousand acres, 100% of the size of the previous peak. The increase is due to rising market value and increasing demand for hazelnuts. Oregon is the main production area, where technological innovation and improved varieties have improved production efficiency. Additionally, the increase in crop acreage across the United States is a testament to the success of adaptation strategies in response to changing climate conditions and land use. However, climate change and the risks of pests and diseases remain challenges, calling for sustainable agricultural practices. Overall, the U.S. hazelnut industry is experiencing strong growth and is expected to continue to thrive in the future.
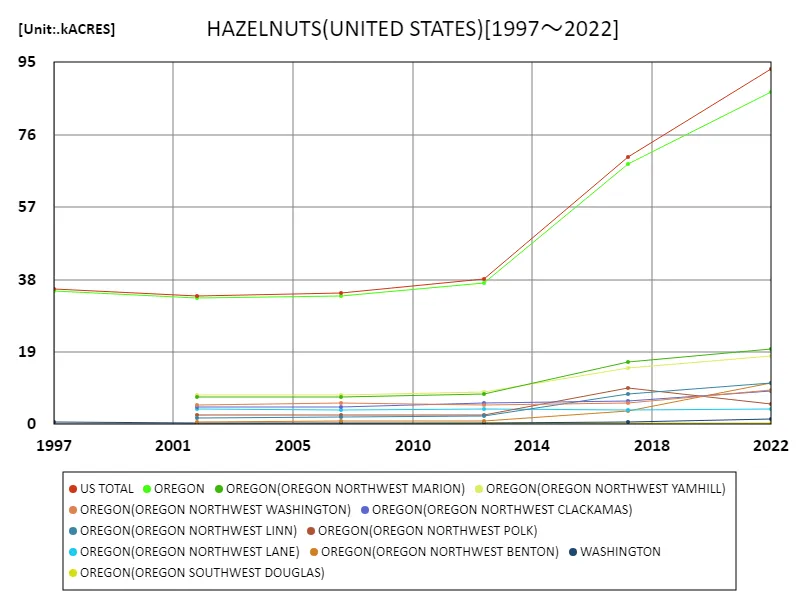
The maximum is the latest one, 93.2kACRES of US TOTAL
Hazelnut planted area (50 US states)
Hazelnut planted area in Oregon from 1997 to 2022 shows a notable increasing trend. In 2022, it reached 87.1 thousand acres, a historic peak for Oregon. This growth is due in large part to Oregon being the leading hazelnut producing state in the United States, with improved varieties and agricultural techniques playing a major role. In particular, increased yields and growing market demand are making it an attractive crop for farmers. In addition, climatic conditions that are suitable for growing hazelnuts have also contributed to the expansion of the area planted with them. However, there are also risks from climate change and pests and diseases, making sustainable agricultural practices increasingly important. Overall, Oregon’s hazelnut industry is showing steady growth and is one to watch.
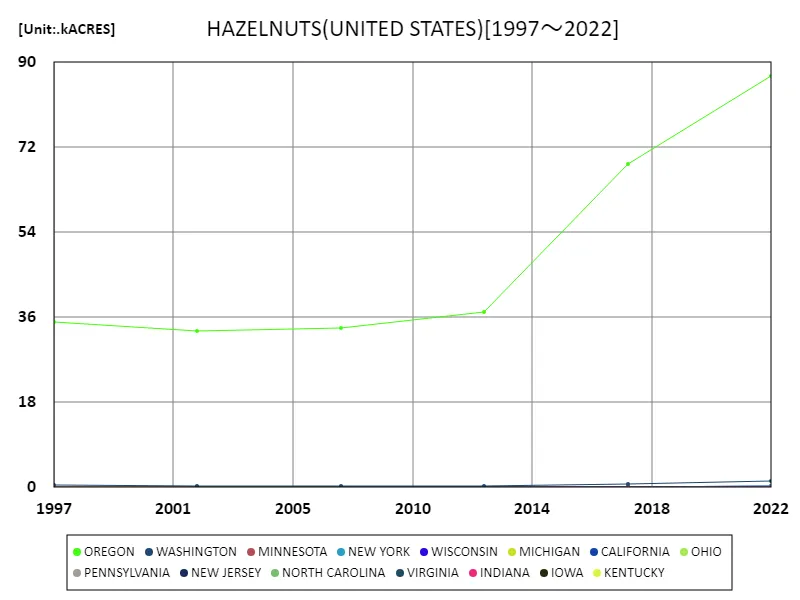
The maximum is the latest one, 87.1kACRES of OREGON
Hazelnut planted area (latest year, US 50 states)
According to 2022 data, the total area planted to hazelnuts in the United States is 89.9 thousand acres, with the majority concentrated in Oregon. Oregon alone accounts for 87.1 thousand acres, or about 97 percent of the total. The state’s planted acreage has been trending upward for many years, with the latest figures marking a historic peak for the state. The average planted area is 2.57 thousand acres, showing a slight dispersion among a few states. In Oregon, improved varieties and cultivation techniques have increased productivity and made agriculture more efficient. Oregon’s dominant position is underscored as demand for hazelnuts increases and their market value rises. It is expected that the state’s production will continue to play an important role in the future, but climate change and pest control will continue to pose challenges.
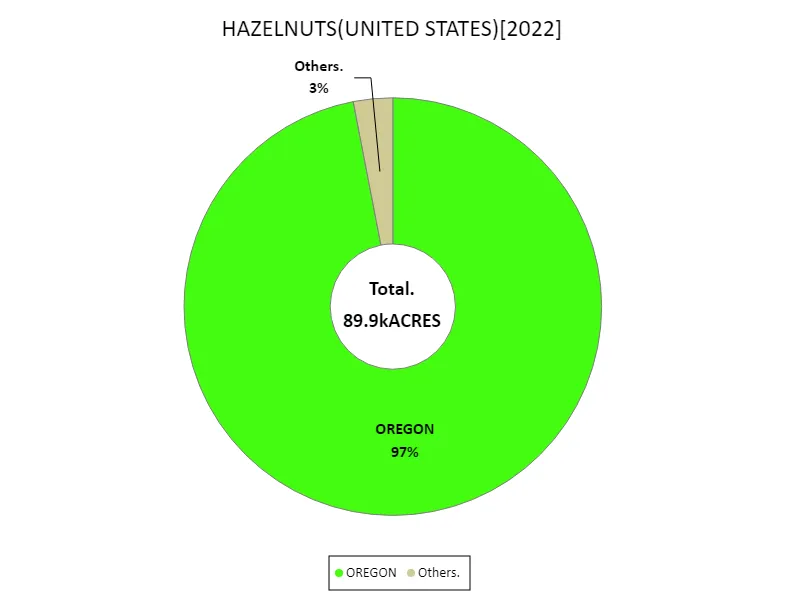
The maximum is 87.1kACRES of OREGON, the average is 2.57kACRES, and the total is 89.9kACRES
Main data
| HAZELNUTS(ALL CLASSES, ALL PRODUCTION PRACTICES, ALL UTILIZATION PRACTICES, AREA BEARING & NON-BEARING, UNITED STATES) [kACRES] | ||||||||||
|---|---|---|---|---|---|---|---|---|---|---|
| US TOTAL | OREGON | OREGON(OREGON NORTHWEST MARION) | OREGON(OREGON NORTHWEST YAMHILL) | OREGON(OREGON NORTHWEST LINN) | OREGON(OREGON NORTHWEST BENTON) | OREGON(OREGON NORTHWEST WASHINGTON) | OREGON(OREGON NORTHWEST CLACKAMAS) | OREGON(OREGON NORTHWEST POLK) | OREGON(OREGON NORTHWEST LANE) | |
| 2022 | 93.17 | 87.13 | 19.87 | 17.94 | 10.92 | 10.88 | 8.9 | 8.77 | 5.37 | 3.96 |
| 2017 | 70.09 | 68.38 | 16.37 | 14.71 | 7.97 | 3.55 | 5.72 | 6.22 | 9.58 | 3.82 |
| 2012 | 38.08 | 37.1 | 8.04 | 8.35 | 2.31 | 0.98 | 4.99 | 5.58 | 2.49 | 3.98 |
| 2007 | 34.47 | 33.66 | 7.09 | 7.57 | 1.79 | 0.85 | 5.61 | 4.47 | 2.35 | 3.7 |
| 2002 | 33.8 | 33.15 | 7.22 | 7.6 | 1.61 | 0.65 | 4.99 | 4.45 | 2.41 | 4 |
| 1997 | 35.61 | 35.02 | ||||||||


Comments