Abstract
The area of pear cultivation in the United States has been steadily increasing in recent years. According to data for 2022, the total area planted to cultivated pears in the United States has reached 51,300 acres (about 208,000 hectares). This is thought to be due to demand in the fruit market and improvements in cultivation techniques. The main producing areas are Washington and Oregon, where the climate and soil conditions are ideal for growing pears, ensuring a stable supply. Pears are a relatively rare fruit in the United States, and the area planted to them is small compared to apples and grapes, but their quality and variety are popular with consumers. It is predicted that the area planted will likely continue to increase in the future depending on changing consumer preferences and market demand. Pear cultivation is also an area where further growth is expected due to climate change and advances in agricultural technology.
Area under pear cultivation
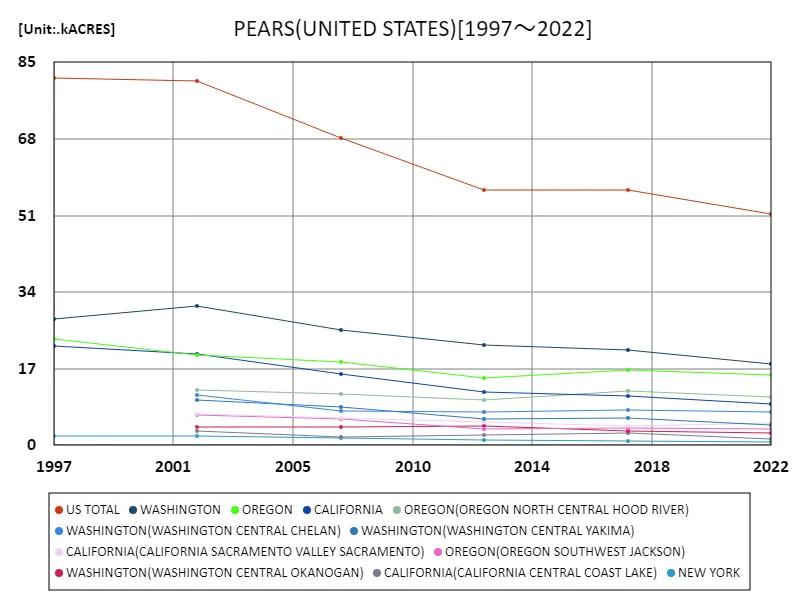
The area planted to pears in the United States has declined from a peak of 81.6 thousand acres in 1997 to 51.3 thousand acres in 2022, currently about 62.9% of its peak. This decline may be due to changes in demand for pears, fluctuations in the market, or a shift to other fruit crops. In particular, states like Washington and Oregon, where pear cultivation is popular, may also be affected by climate change and more efficient agricultural management. In addition, thanks to improvements in pear varieties and advances in cultivation techniques, yields per unit area have increased, so production volumes tend to be maintained even if the cultivated area decreases. Additionally, changing consumer tastes and increased competition are also contributing factors, with the decline in pear cultivation area reflecting market diversification and competition from other fruits. Going forward, market trends for pears and agricultural policies will likely influence changes in area.


The maximum is 81.6kACRES[1997] of US TOTAL, and the current value is about 62.9%
Area planted to pears (50 US states)
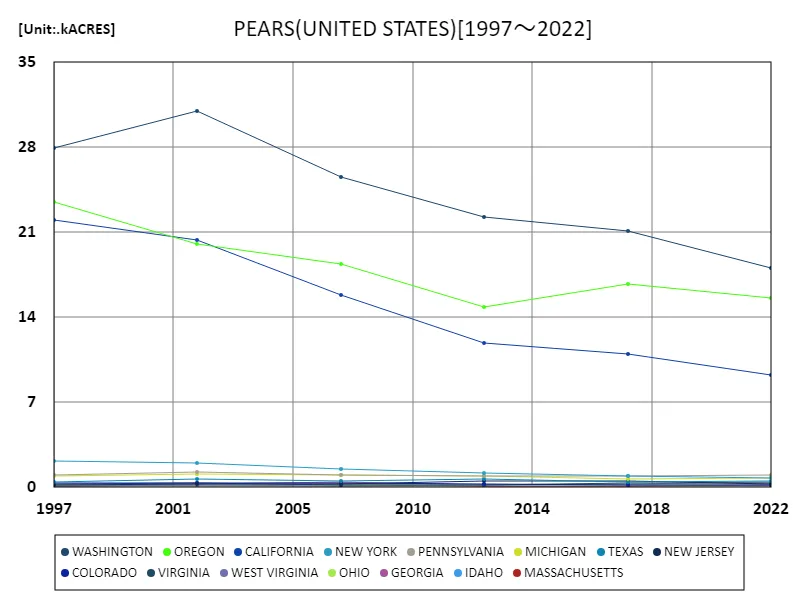
Pear acreage in Washington state has declined from a peak of 31,000 acres in 2002 to 18,100 acres today, about 58.4% of the current level. This decline may be due to declining profitability of pear cultivation, competition from other fruit crops, or changes in market demand. Washington state has long been a major producer of pears, and the climate and soil conditions were favorable for pear cultivation, so pears were once cultivated on a large scale. However, in recent years, fluctuations in the market value of pears and increasing costs of running orchards have led to a decrease in the area under cultivation. And while new agricultural techniques and improved varieties are being developed, increased productivity of other fruits and market competition are also contributing factors. This trend also reflects changes in consumer tastes and the influence of imported fruits, so future pear cultivation will need to respond to market needs and find more efficient production methods.


The maximum is 31kACRES[2002] of WASHINGTON, and the current value is about 58.4%
Pear planted area (latest year, 50 US states)
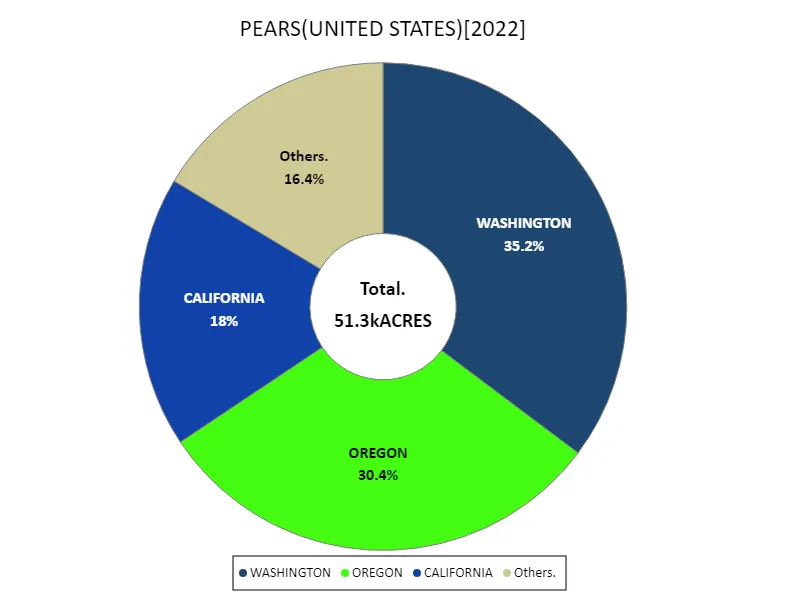
According to 2022 data, the total area planted to pears in the United States is 51.3 thousand acres, with the largest area planted in Washington state at 18.1 thousand acres. Meanwhile, the overall average planted area is relatively small at 1.07 thousand acres. Washington state continues to be a major producer of pears, accounting for 35% of the total, indicating its importance. A recent trend is that the area of land used for pear cultivation has been decreasing. From 1997 to 2022, the total U.S. planted area has declined from its peak, but Washington state’s maximum planted area has also declined from its historical peak. This is thought to be due to factors such as changing consumer preferences, competition from other fruit crops, and increasing management costs. In addition, because the average cultivated area is relatively small, it appears that pear production is not only carried out by large-scale commercial farms, but also by many small-scale farmers. In the future, it will be necessary to review production systems in response to market demand and technological innovation.


The maximum is 18.1kACRES of WASHINGTON, the average is 1.07kACRES, and the total is 51.3kACRES
Main data
| PEARS(ALL CLASSES, ALL PRODUCTION PRACTICES, ALL UTILIZATION PRACTICES, AREA BEARING & NON-BEARING, UNITED STATES) [kACRES] | ||||||||||
|---|---|---|---|---|---|---|---|---|---|---|
| US TOTAL | WASHINGTON | OREGON | OREGON(OREGON NORTH CENTRAL HOOD RIVER) | CALIFORNIA | WASHINGTON(WASHINGTON CENTRAL CHELAN) | CALIFORNIA(CALIFORNIA SACRAMENTO VALLEY SACRAMENTO) | WASHINGTON(WASHINGTON CENTRAL YAKIMA) | OREGON(OREGON SOUTHWEST JACKSON) | WASHINGTON(WASHINGTON CENTRAL OKANOGAN) | |
| 2022 | 51.3 | 18.08 | 15.59 | 10.65 | 9.23 | 7.33 | 5 | 4.49 | 3.68 | 2.67 |
| 2017 | 56.72 | 21.13 | 16.77 | 12.12 | 11.01 | 7.82 | 4.3 | 6.17 | 3.82 | 3.26 |
| 2012 | 56.75 | 22.23 | 14.88 | 9.97 | 11.91 | 7.47 | 5.14 | 5.92 | 3.71 | 4.27 |
| 2007 | 68.22 | 25.51 | 18.42 | 11.31 | 15.86 | 7.65 | 6.14 | 8.39 | 5.8 | 4.02 |
| 2002 | 80.8 | 30.98 | 20.04 | 12.19 | 20.35 | 11.13 | 6.91 | 10.1 | 6.67 | 4.05 |
| 1997 | 81.57 | 27.93 | 23.53 | 21.99 | ||||||


Comments