Abstract
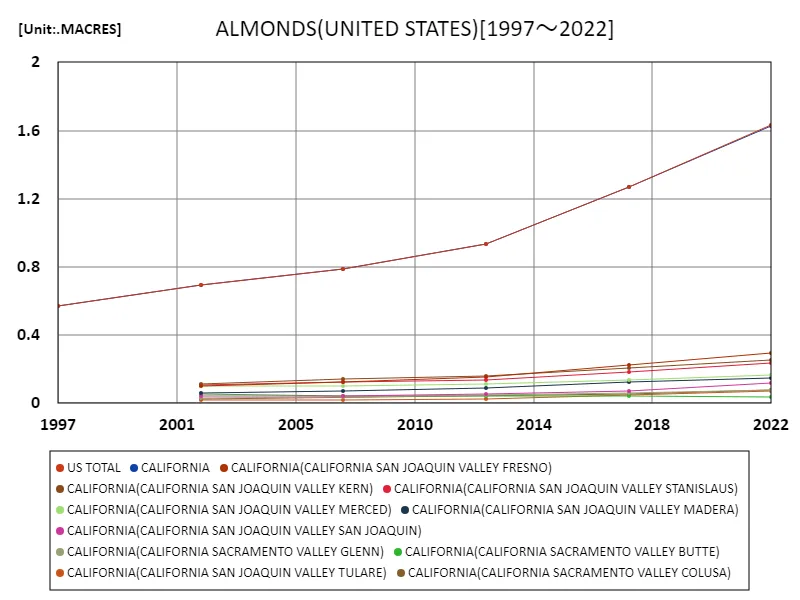
The annual U.S. almond planting area reached 1.63 million acres in 2022. Almonds are primarily grown in California, which accounts for approximately 80% of the total U.S. production. Over the past decade, the area planted has been on the rise, due to the high demand and economic value of almonds. California’s dry climate is ideal for growing almonds, and improvements in irrigation technology are helping to increase the area planted. However, water scarcity and climate change may pose challenges in the future.
Almond plantation area
From 1997 to 2022, the amount of almond acreage in the United States has increased significantly. Notably, 2022 saw the largest overall peak with an all-time high of 1.63 million acres. This is due to increased demand for almonds, especially in international markets, and optimal growing conditions in California. The area under cultivation was relatively stable from 1997 to 2007, but increased sharply from 2008 onwards. This increase is due to the high market value of almonds, increased productivity, and improved irrigation techniques. On the other hand, climate change and water resource issues may affect future growth, so finding sustainable cultivation methods is an important issue.


The maximum is the latest one, 1.63MACRES of US TOTAL
Almond planted area (50 US states)
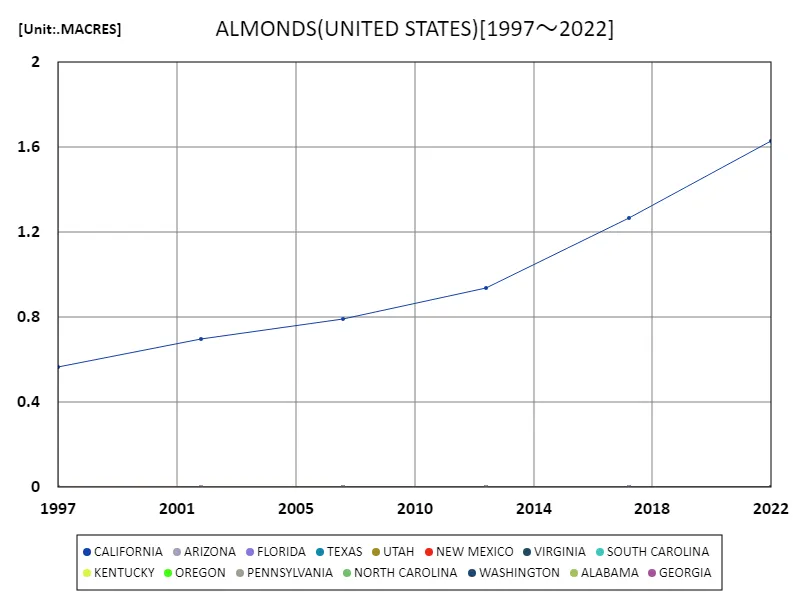
Between 1997 and 2022, the amount of almond acreage planted in the United States has changed significantly. California, in particular, set a new record for planted acreage in 2022, at 1.63 million acres. The data indicates that almond cultivation in California has peaked. From 1997 to 2007, the area under cultivation remained relatively stable, but has increased sharply since 2008. This is due to increasing international demand for almonds as well as increased consumption within the United States. Improvements in California’s climate conditions and irrigation techniques also contributed to the increase in planted area. This is especially true in California, where the dry climate and steady water supply provided by irrigation make it ideal for growing almonds. On the other hand, water resource issues and climate change due to rapid growth may affect cultivation in the future. Addressing these challenges and finding sustainable cultivation methods will be a key issue for the almond industry going forward.


The maximum is the latest one, 1.63MACRES of CALIFORNIA
Almond planted area (latest year, 50 US states)
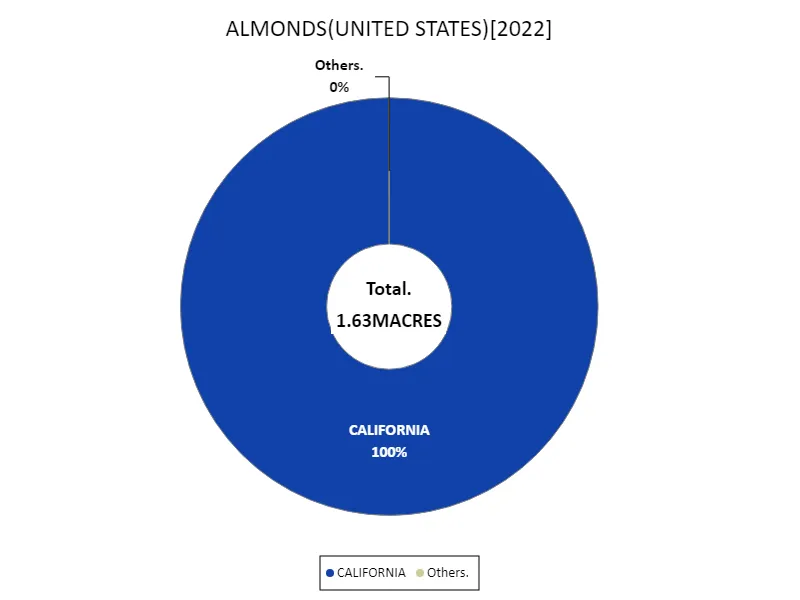
According to 2022 data, U.S. almond acreage will reach 1.63 million acres overall, with California matching that total acreage. California has the largest amount of almond acres planted at 1.63 million acres, making it the center of the almond industry. Meanwhile, the average planted area for the entire United States is 74.1 thousand acres, showing how outstanding California’s numbers are. These figures highlight the importance of California as a major producer of almonds. Since 1997, the area planted to almonds has increased gradually, with particularly rapid growth occurring since 2008 in response to increased demand. California’s dry climate and advanced irrigation techniques have supported this growth, and with demand expected to remain high, sustainable cultivation and water resource management are emerging as key issues.


The maximum is 1.63MACRES of CALIFORNIA, the average is 74.1kACRES, and the total is 1.63MACRES
Main data
| ALMONDS(ALL CLASSES, ALL PRODUCTION PRACTICES, ALL UTILIZATION PRACTICES, AREA BEARING & NON-BEARING, UNITED STATES) [MACRES] | ||||||||||
|---|---|---|---|---|---|---|---|---|---|---|
| US TOTAL | CALIFORNIA | CALIFORNIA(CALIFORNIA SAN JOAQUIN VALLEY FRESNO) | CALIFORNIA(CALIFORNIA SAN JOAQUIN VALLEY KERN) | CALIFORNIA(CALIFORNIA SAN JOAQUIN VALLEY STANISLAUS) | CALIFORNIA(CALIFORNIA SAN JOAQUIN VALLEY MERCED) | CALIFORNIA(CALIFORNIA SAN JOAQUIN VALLEY MADERA) | CALIFORNIA(CALIFORNIA SAN JOAQUIN VALLEY SAN JOAQUIN) | CALIFORNIA(CALIFORNIA SACRAMENTO VALLEY GLENN) | CALIFORNIA(CALIFORNIA SACRAMENTO VALLEY COLUSA) | |
| 2022 | 1.63 | 1.63 | 0.3 | 0.26 | 0.24 | 0.16 | 0.15 | 0.12 | 0.08 | 0.08 |
| 2017 | 1.27 | 1.27 | 0.23 | 0.21 | 0.18 | 0.14 | 0.13 | 0.07 | 0.06 | 0.06 |
| 2012 | 0.94 | 0.94 | 0.15 | 0.16 | 0.14 | 0.12 | 0.09 | 0.05 | 0.05 | |
| 2007 | 0.79 | 0.79 | 0.12 | 0.14 | 0.12 | 0.1 | 0.07 | 0.04 | 0.04 | |
| 2002 | 0.7 | 0.7 | 0.1 | 0.11 | 0.11 | 0.1 | 0.06 | 0.04 | 0.03 | 0.03 |
| 1997 | 0.57 | 0.57 | ||||||||


Comments