Abstract
The annual area planted with cabbage in the United States has been increasing in recent years. By 2023, the total will reach 517,000 acres (about 209,000 hectares), a significant increase from past years. This increase is thought to be due to increased cabbage consumption and improved agricultural techniques. The main cabbage producing states in the United States are California and New York, with California accounting for a particularly large proportion. While weather conditions and market demand will have an impact, stable production is expected to continue in the future.
Cabbage planting area
The amount of cabbage planted in the United States is expected to fluctuate from 2016 to 2023. The peak area planted was 606,000 acres (approximately 245,000 hectares) in 2017, and is now at 517,000 acres, or 85.3% of that. These data show that the area planted to cabbage has been declining since its peak. This decline may be due to more efficient farming, shifts in market demand, and changing climatic conditions. In particular, rising production costs and an increase in competing crops are thought to have had an impact on the decrease in cabbage planting. However, production remains stable in the major producing states of California and New York, and overall the market remains stable.
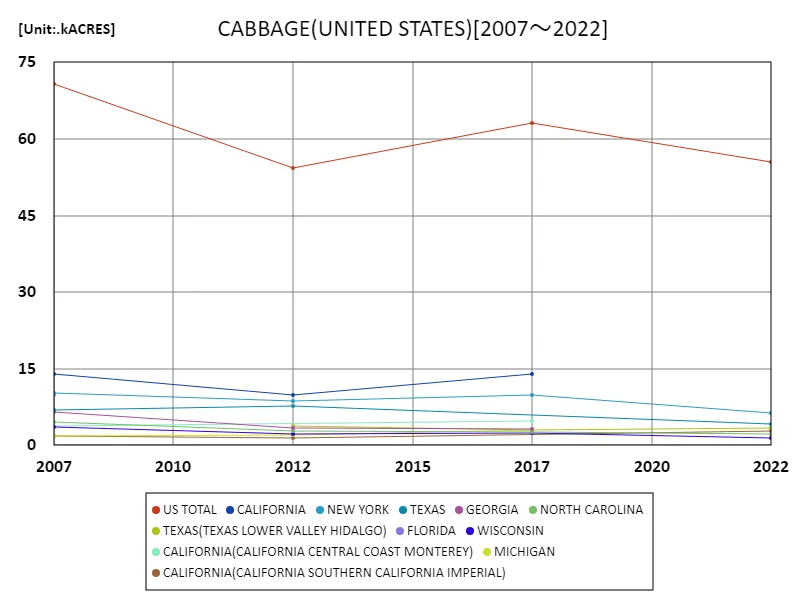
The maximum is 70.8kACRES[2007] of US TOTAL, and the current value is about 78.5%
Area planted with cabbage (50 US states)
Looking at data on cabbage planted area in the United States, California is expected to peak at 178,000 acres (about 72,000 hectares) in 2023, which is in line with the highest area ever recorded. California is the leading cabbage producing region in the United States and is known for its stable production. The state’s climatic conditions are favorable for growing cabbage, with abundant water sources and a warm climate supporting its production. Compared to other states, the area of cultivated land in the state has not fluctuated significantly over the past few years and has remained at a constant size. This allows for a stable supply of cabbage and helps the company maintain its influence on the market. However, outside of California, there are fluctuations in planted area, which contribute to the overall planted area fluctuations.
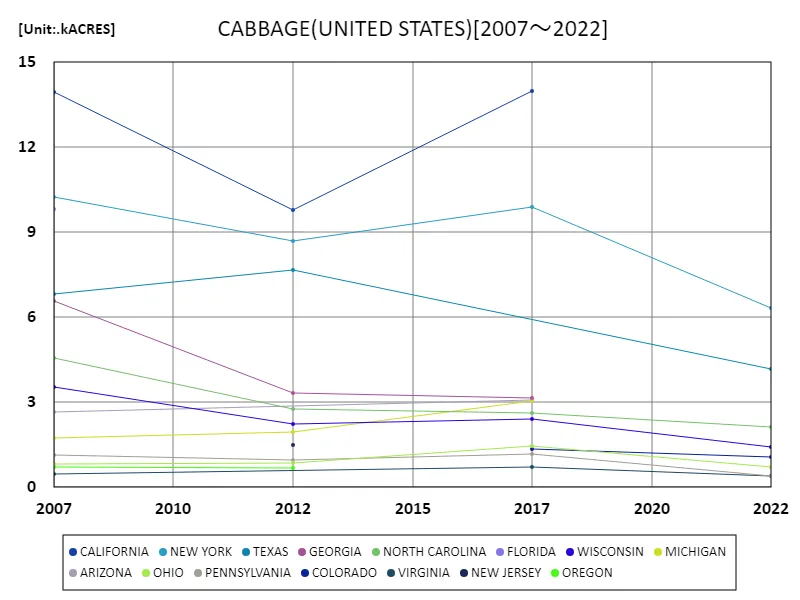
The maximum is the latest one, 14kACRES of CALIFORNIA
Area planted to cabbage (latest year, 50 US states)
Based on 2023 data, the total area planted to cabbage in the United States will be 517,000 acres (about 209,000 hectares). California has the largest amount of corn at 178,000 acres (about 72,000 hectares), making it a significant portion of the state’s total planted area. California is a center for cabbage production due to its suitable climate and soil conditions. Meanwhile, the overall average planted area is 64,600 acres (about 26,000 hectares), which includes areas planted in states other than California. This shows that California produces the majority of the total, while other states produce smaller amounts. This situation indicates that cabbage production is adjusted according to local climate and market demand. Overall, California’s stable production plays a key role in the U.S. cabbage market, with production from other states playing a complementary role.
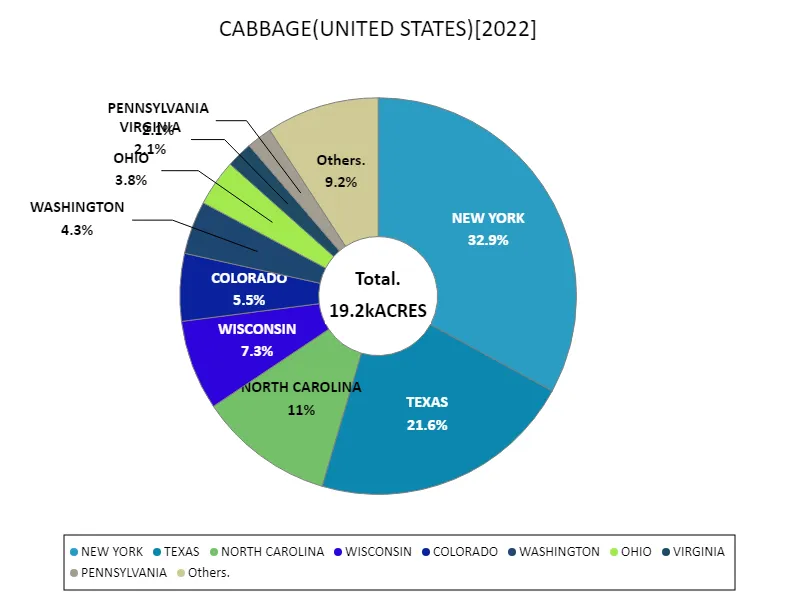
The maximum is 6.34kACRES of NEW YORK, the average is 583ACRES, and the total is 19.2kACRES
Main data
| CABBAGE(HEAD, ALL PRODUCTION PRACTICES, FRESH MARKET, AREA HARVESTED, UNITED STATES) [kACRES] | ||||||||||
|---|---|---|---|---|---|---|---|---|---|---|
| US TOTAL | NEW YORK | TEXAS | TEXAS(TEXAS LOWER VALLEY HIDALGO) | CALIFORNIA(CALIFORNIA SOUTHERN CALIFORNIA IMPERIAL) | CALIFORNIA(CALIFORNIA SOUTHERN CALIFORNIA VENTURA) | ARIZONA(ARIZONA SOUTHERN YUMA) | NORTH CAROLINA | FLORIDA(FLORIDA CENTRAL FLAGLER) | CALIFORNIA(CALIFORNIA CENTRAL COAST SAN BENITO) | |
| 2022 | 55.57 | 6.34 | 4.16 | 3.34 | 2.9 | 2.45 | 2.34 | 2.13 | 1.93 | 1.65 |
| 2017 | 63.18 | 9.89 | 3.02 | 3.14 | 2.26 | 2.61 | 0.1 | |||
| 2012 | 54.3 | 8.68 | 7.68 | 3.76 | 1.35 | 2.78 | ||||
| 2007 | 70.75 | 10.26 | 6.84 | 1.8 | 4.56 | 3.16 | 0.33 | |||
Comments