Abstract
American strawberry production has been on the rise in recent years, reaching 28.5 million cwt (about 29 million kg) of annual production in 2022. California is the main producer, accounting for about 90% of the total. California’s warm climate is ideal for growing strawberries, resulting in a long harvest season and a stable supply throughout the year. Florida is also a major producer, with most of the harvest occurring in the winter. This ensures that the US has a year-round supply of strawberries. In recent years, production has increased in response to consumers becoming more health conscious and increased demand for smoothies, desserts, and other uses. In addition, improvements in strawberry varieties and cultivation techniques have led to increased yields and reduced risk of disease. Overall, U.S. strawberry production provides a stable supply to meet domestic and international demand.
Strawberry production
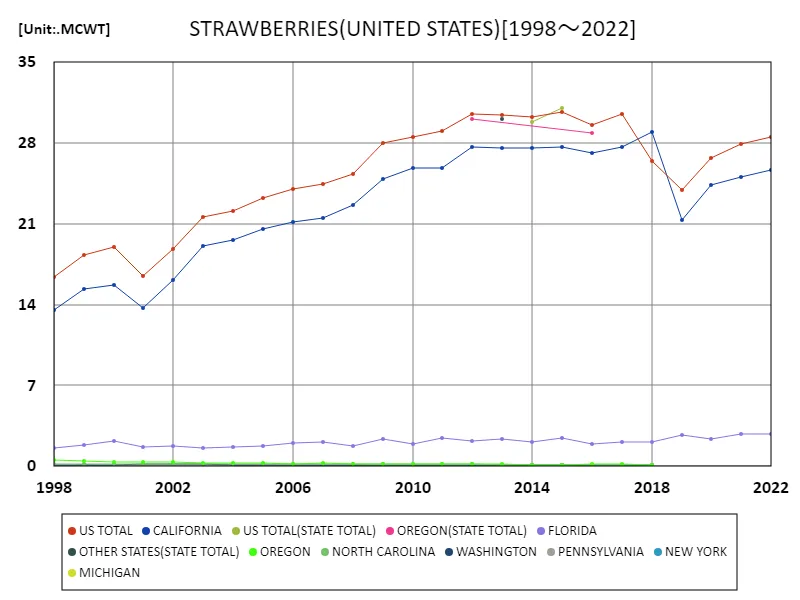
U.S. strawberry production has fluctuated between 1998 and 2022, with annual production peaking in 2015 at 31.1 million cwt. The increase in production during this period was due to expanded production, primarily in California and Florida, as well as technological innovation and improved varieties. California accounts for about 90% of the total, and its climate and soil conditions contribute to stable production. However, production has declined gradually since 2015, with 2022 showing a slight decline compared to peak levels. Factors behind this decline include changes in growing conditions due to climate change, labour shortages or rising production costs. In addition, changing consumer tastes and increased competition are also having an impact. Nevertheless, American strawberry production continues to play an important role in meeting domestic and international demand, with California’s production, in particular, remaining high. We expect to continue to maintain a stable supply in the future while adapting to advances in production technology and market fluctuations.


The maximum is the latest one, 31.1MCWT of US TOTAL(STATE TOTAL)
Strawberry production (50 US states)
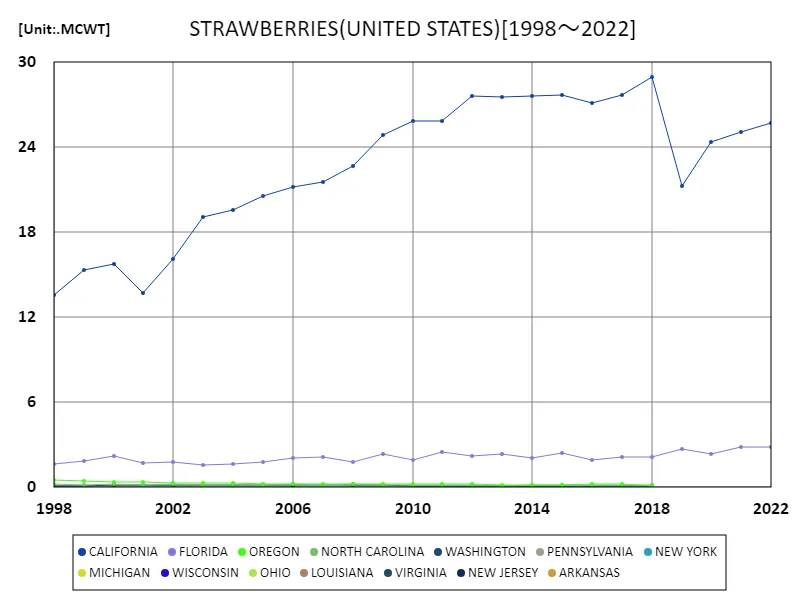
California is by far the largest strawberry producing state in the United States, with annual production peaking at 28.9 million cwt in 2018, based on data from 1998 to 2022. The high production rates at this time of year are the result of California’s warm climate, long harvest season, and advanced growing techniques. California is the major source of strawberries, accounting for approximately 90% of total production. However, in 2022, production fell to approximately 88.8% compared to this peak. Possible reasons for the decline include changes in habitat due to climate change, constraints on water resources, and labor shortages. California in particular is facing a serious water shortage, which is affecting production. Nevertheless, California remains the largest strawberry producer in the country, and there is a need for more efficient production methods through technological innovation and improved varieties. Going forward, sustainable agricultural methods and adaptation to climate change will be key to maintaining stable production.


The maximum is 28.9MCWT[2018] of CALIFORNIA, and the current value is about 88.8%
Strawberry production (latest year, 50 US states)
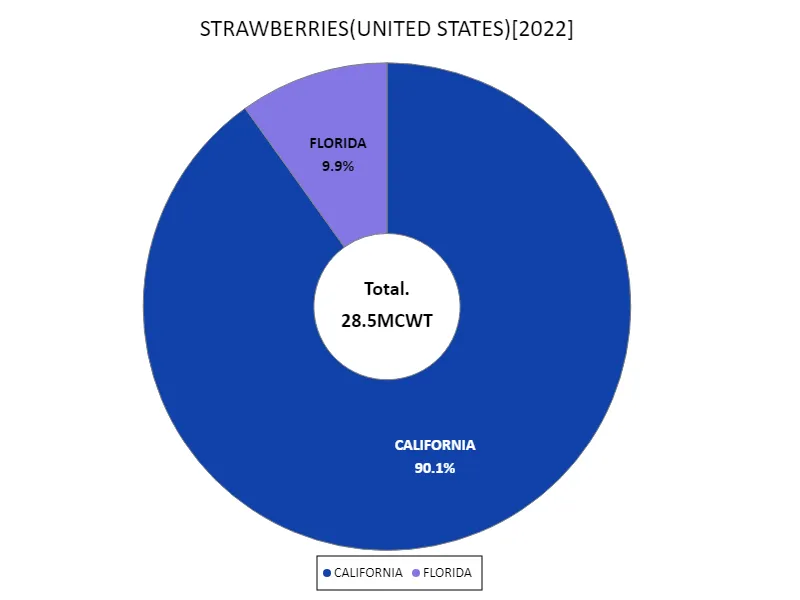
California dominated strawberry production in the United States in 2022, with annual production reaching 25.7 million cwt. This represents nearly 90% of the total production of 28.5 million cwt. California’s advantage is due to its mild climate and long harvest season, which supports high production. Meanwhile, the national average production is 14.3 million cwt, a stark difference from California’s production. States other than California also have a certain amount of production, but the amount is much less than California’s. These states, primarily Florida, are primarily harvested in the winter months, providing a steady supply year-round. While overall production has remained relatively stable, California production has fluctuated from year to year. Climate change and water resource constraints are having an impact, posing a challenge as to the sustainability of production in the future. Nonetheless, U.S. strawberry production continues to play a vital role in meeting domestic and international demand.


The maximum is 25.7MCWT of CALIFORNIA, the average is 14.3MCWT, and the total is 28.5MCWT
Main data
| STRAWBERRIES(ALL CLASSES, ALL PRODUCTION PRACTICES, ALL UTILIZATION PRACTICES, PRODUCTION, UNITED STATES) [MCWT] | ||||||||||
|---|---|---|---|---|---|---|---|---|---|---|
| US TOTAL(STATE TOTAL) | US TOTAL | CALIFORNIA | FLORIDA | OREGON | NORTH CAROLINA | WASHINGTON | WISCONSIN | PENNSYLVANIA | NEW YORK | |
| 2022 | 28.52 | 25.7 | 2.82 | |||||||
| 2021 | 27.93 | 25.1 | 2.83 | |||||||
| 2020 | 26.74 | 24.4 | 2.34 | |||||||
| 2019 | 23.98 | 21.3 | 2.68 | |||||||
| 2018 | 26.48 | 28.94 | 2.12 | 0.11 | 0.13 | 0.09 | 0.03 | |||
| 2017 | 30.53 | 27.69 | 2.14 | 0.2 | 0.14 | 0.08 | 0.05 | |||
| 2016 | 29.61 | 27.12 | 1.95 | 0.23 | 0.13 | 0.12 | 0.05 | |||
| 2015 | 31.05 | 30.66 | 27.7 | 2.44 | 0.16 | 0.14 | 0.07 | 0.03 | 0.03 | 0.03 |
| 2014 | 29.8 | 30.24 | 27.59 | 2.07 | 0.16 | 0.15 | 0.1 | 0.04 | 0.03 | 0.03 |
| 2013 | 30.47 | 27.57 | 2.33 | 0.17 | 0.11 | 0.09 | 0.04 | 0.05 | 0.04 | |
| 2012 | 30.52 | 27.65 | 2.23 | 0.21 | 0.16 | 0.1 | 0.04 | 0.04 | 0.03 | |
| 2011 | 29.02 | 25.85 | 2.48 | 0.23 | 0.17 | 0.13 | 0.04 | 0.04 | 0.04 | |
| 2010 | 28.52 | 25.86 | 1.94 | 0.24 | 0.17 | 0.13 | 0.04 | 0.06 | 0.04 | |
| 2009 | 28.01 | 24.86 | 2.38 | 0.21 | 0.2 | 0.14 | 0.05 | 0.07 | 0.04 | |
| 2008 | 25.32 | 22.68 | 1.79 | 0.24 | 0.21 | 0.14 | 0.05 | 0.07 | 0.05 | |
| 2007 | 24.45 | 21.54 | 2.11 | 0.25 | 0.19 | 0.13 | 0.05 | 0.06 | 0.05 | |
| 2006 | 24.04 | 21.16 | 2.04 | 0.23 | 0.22 | 0.13 | 0.05 | 0.07 | 0.04 | |
| 2005 | 23.23 | 20.58 | 1.79 | 0.25 | 0.2 | 0.15 | 0.04 | 0.07 | 0.05 | |
| 2004 | 22.14 | 19.59 | 1.63 | 0.32 | 0.18 | 0.15 | 0.04 | 0.08 | 0.07 | |
| 2003 | 21.56 | 19.09 | 1.56 | 0.3 | 0.17 | 0.16 | 0.05 | 0.08 | 0.05 | |
| 2002 | 18.85 | 16.1 | 1.76 | 0.34 | 0.23 | 0.16 | 0.04 | 0.07 | 0.06 | |
| 2001 | 16.51 | 13.73 | 1.69 | 0.4 | 0.2 | 0.16 | 0.05 | 0.09 | 0.06 | |
| 2000 | 19.01 | 15.73 | 2.21 | 0.35 | 0.23 | 0.13 | 0.04 | 0.07 | 0.07 | |
| 1999 | 18.31 | 15.35 | 1.86 | 0.42 | 0.18 | 0.12 | 0.05 | 0.05 | 0.08 | |
| 1998 | 16.38 | 13.55 | 1.61 | 0.51 | 0.2 | 0.12 | 0.06 | 0.05 | 0.06 | |


Comments