Abstract
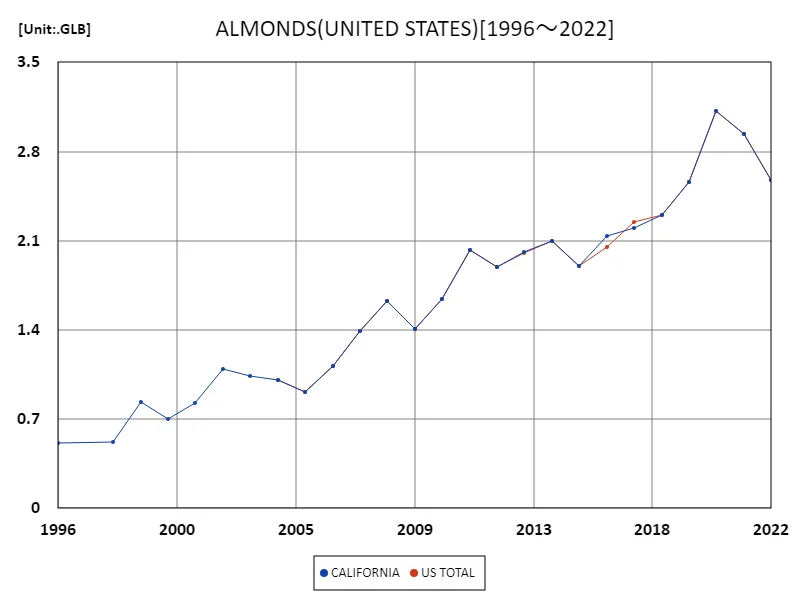
Looking at data on almond production, California is the main producer of almonds in the United States, boasting an overwhelming production of 2.58 billion pounds in 2022. This represents nearly 99% of the total almond production in the United States and means that California produces approximately 80% of the world’s almonds. California’s climate is extremely suitable for growing almonds, with a dry, warm climate and abundant irrigation facilities supporting production. Almond production has been steadily increasing in recent years, and production is expected to increase further as sustainable agricultural techniques and efficient water management advance. Consumption of almonds is growing due to their health benefits, and they are likely to maintain their position as a major agricultural commodity in the United States.
Almond production
U.S. almond production shows notable growth and fluctuations from 1996 to 2022. California, in particular, is the dominant producer, achieving a record annual production of 3.12 billion pounds in 2020. This accounts for almost all of the almond production in the United States and has a major impact on the global market. However, production declined in the following years, falling to 82.8% of its peak in 2022. The main factors behind this decline are believed to be droughts and water shortages caused by climate change, as well as the effects of pests and diseases. Nevertheless, demand for almonds is high and there is a need to stabilize production as sustainable agricultural techniques and efficient water management advance. California’s almond industry will continue to adapt to technological innovations and market changes to maintain its position as a major global supplier.


The maximum is 3.12GLB[2020] of CALIFORNIA, and the current value is about 82.8%
Almond production (50 US states)
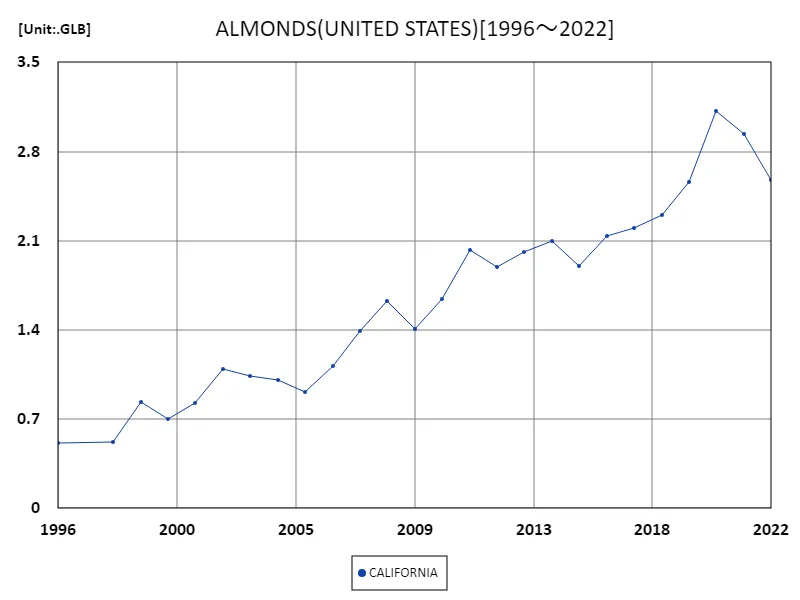
U.S. almond production shows notable growth and fluctuations from 1996 to 2022. California, in particular, is the dominant producer, achieving a record annual production of 3.12 billion pounds in 2020. This accounts for almost all of the almond production in the United States and has a major impact on the global market. However, production declined in the following years, falling to 82.8% of its peak in 2022. The main factors behind this decline are believed to be droughts and water shortages caused by climate change, as well as the effects of pests and diseases. Nevertheless, demand for almonds is high and there is a need to stabilize production as sustainable agricultural techniques and efficient water management advance. California’s almond industry will continue to adapt to technological innovations and market changes to maintain its position as a major global supplier.


The maximum is 3.12GLB[2020] of CALIFORNIA, and the current value is about 82.8%
Almond production (latest year, 50 US states)
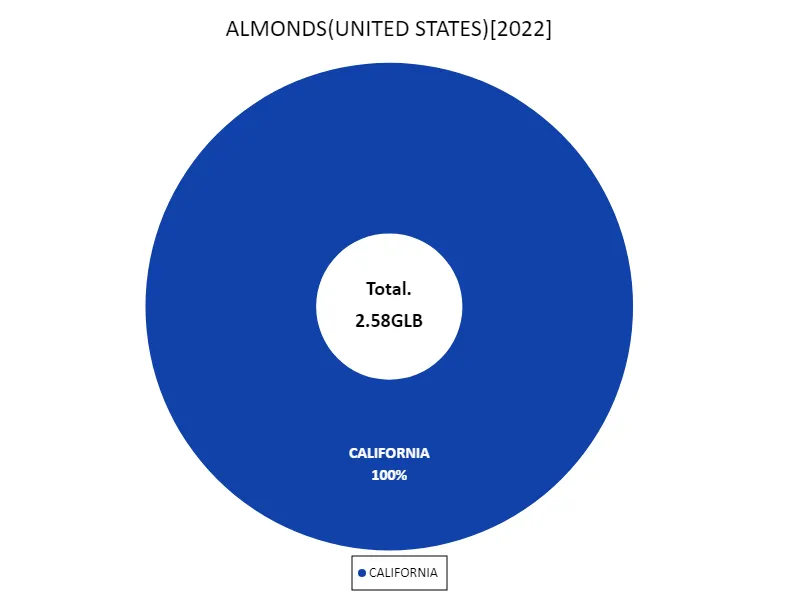
U.S. almond production in 2022 was led by California, with annual production reaching 2.58 billion pounds. This figure is in line with overall U.S. almond production and stands out when compared to historical data. California produces almost all of the almonds in the United States because the state’s climate conditions are ideal for growing almonds. In particular, the dry, warm climate and advanced irrigation technology support stable production. However, in recent years, climate change and water resource issues have had an impact, and production volumes have fluctuated. However, high market demand for almonds and the adoption of sustainable agricultural techniques will continue to support stable production.


The maximum is 2.58GLB of CALIFORNIA, the average is 2.58GLB, and the total is 2.58GLB
Main data
| ALMONDS(ALL CLASSES, ALL PRODUCTION PRACTICES, UTILIZED SHELLED, PRODUCTION, UNITED STATES) [GLB] | ||
|---|---|---|
| US TOTAL | CALIFORNIA | |
| 2022 | 2.58 | 2.58 |
| 2021 | 2.94 | 2.94 |
| 2020 | 3.12 | 3.12 |
| 2019 | 2.56 | 2.56 |
| 2018 | 2.3 | 2.3 |
| 2017 | 2.25 | 2.2 |
| 2016 | 2.05 | 2.14 |
| 2015 | 1.9 | 1.9 |
| 2014 | 2.1 | 2.1 |
| 2013 | 2 | 2.01 |
| 2012 | 1.89 | 1.89 |
| 2011 | 2.03 | 2.03 |
| 2010 | 1.64 | 1.64 |
| 2009 | 1.41 | 1.41 |
| 2008 | 1.63 | 1.63 |
| 2007 | 1.39 | 1.39 |
| 2006 | 1.12 | 1.12 |
| 2005 | 0.92 | 0.92 |
| 2004 | 1.01 | 1.01 |
| 2003 | 1.04 | |
| 2002 | 1.09 | |
| 2001 | 0.83 | |
| 2000 | 0.7 | |
| 1999 | 0.83 | |
| 1998 | 0.52 | |
| 1996 | 0.51 | |


Comments