Abstract
The annual production of apples in the United States has been increasing in recent years. According to 2023 data, the U.S. produced a total of 9.91 billion pounds of apples, the highest figure in several years. The main producing states are Washington, New York, and Michigan, with each state accounting for the majority of production. In recent years, growing health consciousness among consumers and improved productivity through improved varieties have contributed to increased production. Improvements in apple quality and the introduction of a variety of varieties are also contributing to increased production.
Apple production volume
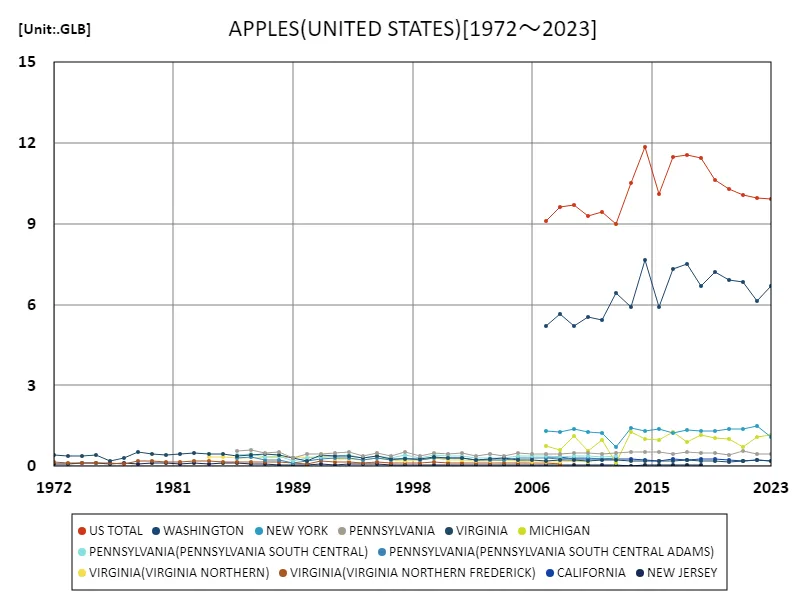
Annual U.S. apple production has shown significant fluctuations between 1972 and 2023. In particular, in 2014, production peaked at 11.9 billion pounds across the United States, but current production is about 9.91 billion pounds, or 83.5% of that amount. This downward trend is mainly due to climate change, changes in agricultural management, and labor shortages. From the 1970s to the 1990s, there was a steady increase in production, but since the 2000s, fluctuations in harvest volumes have become more noticeable. This is due to changes in weather conditions and the increased impact of pests and diseases. In recent years, productivity has increased in some areas due to improved varieties and advances in agricultural technology, but overall production volume is still declining compared to its peak. Additionally, changes in consumer tastes and growing health consciousness have led to a more diverse selection of apple varieties, reducing demand for some traditional varieties. In the future, adapting to climate change and introducing new technologies will be key to maintaining stable production volumes.


The maximum is 11.9GLB[2014] of US TOTAL, and the current value is about 83.5%
Apple production (50 US states)
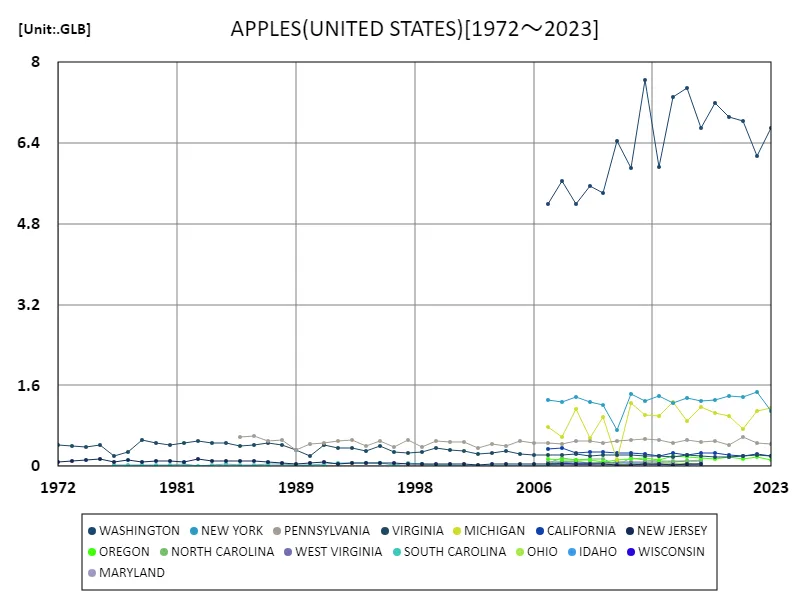
Washington state’s annual apple production has varied significantly from 1972 to 2023. In 2014, production peaked at 7.65 billion pounds, but current production is 87.6% of that amount, or about 6.71 billion pounds. This decline is due to the effects of climate change and challenges in agricultural management. Washington state is the center of apple production in the United States and accounts for the majority of the country’s apple production. The region experienced steady growth from the 1970s to the 1990s, with improvements in varieties and cultivation techniques boosting productivity. However, since the 2000s, unstable weather conditions and the increased impact of pests and diseases have led to fluctuations in harvest yields. Labor shortages and new market competition are also having an impact. For example, as other states like California and Oregon increase their apple production, Washington is pushing for more efficient growing practices and new varieties to stabilize production. Going forward, the adoption of sustainable agricultural practices and technological innovation will be key to maintaining and restoring production levels.


The maximum is 7.65GLB[2014] of WASHINGTON, and the current value is about 87.6%
Apple production (latest year, 50 US states)
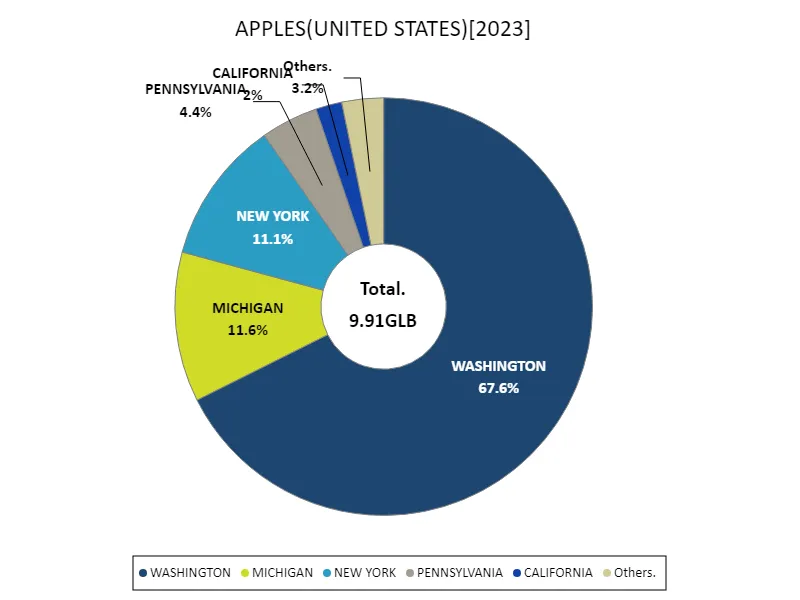
Total U.S. apple production in 2023 is expected to reach 9.91 billion pounds, with Washington state accounting for 6.7 billion pounds. This means that Washington state is responsible for approximately 67% of the apple production in the United States. The overall average production was 1.42 billion pounds, which shows that Washington State’s production is far higher than any other state. From the 1970s to the early 2000s, apple production increased steadily, but in recent years, production has become unstable due to climate change and the effects of pests and diseases. Washington State continues to account for the majority of apple production, but other states are gradually increasing production and introducing new varieties and innovations. Additionally, growing health consciousness among consumers and the development of new markets are also influencing production trends. Although Washington state production is currently slightly lower than its peak, it still plays an important role in overall U.S. apple production. Going forward, sustainable agricultural practices and climate adaptation measures will be key to maintaining production stability.


The maximum is 6.7GLB of WASHINGTON, the average is 1.42GLB, and the total is 9.91GLB
Main data
| APPLES(ALL CLASSES, ALL PRODUCTION PRACTICES, ALL UTILIZATION PRACTICES, PRODUCTION, UNITED STATES) [MLB] | ||||||||||
|---|---|---|---|---|---|---|---|---|---|---|
| PENNSYLVANIA | PENNSYLVANIA(PENNSYLVANIA SOUTH CENTRAL) | VIRGINIA | PENNSYLVANIA(PENNSYLVANIA SOUTH CENTRAL ADAMS) | VIRGINIA(VIRGINIA NORTHERN FREDERICK) | NEW JERSEY | PENNSYLVANIA(PENNSYLVANIA SOUTH CENTRAL FRANKLIN) | NEW JERSEY(NEW JERSEY SOUTH) | VIRGINIA(VIRGINIA NORTHERN CLARKE) | PENNSYLVANIA(PENNSYLVANIA CENTRAL) | |
| 2023 | 440 | 195 | ||||||||
| 2022 | 460 | 221 | ||||||||
| 2021 | 571 | 195 | ||||||||
| 2020 | 417 | 176 | ||||||||
| 2019 | 507 | 185 | ||||||||
| 2018 | 488 | 204 | 49.2 | |||||||
| 2017 | 528 | 225 | 38.5 | |||||||
| 2016 | 467 | 180 | 31.9 | |||||||
| 2015 | 519 | 195.2 | 41.7 | |||||||
| 2014 | 534 | 205 | 37 | |||||||
| 2013 | 514 | 215 | 29 | |||||||
| 2012 | 494 | 392 | 230 | 305 | 35 | 41.5 | 31 | |||
| 2011 | 458 | 354.1 | 220 | 269.1 | 36 | 43.2 | 30.2 | |||
| 2010 | 492 | 385.3 | 200 | 295.4 | 43 | 49 | 31.6 | |||
| 2009 | 510 | 391 | 245 | 299 | 43 | 23 | 31.5 | |||
| 2008 | 440 | 344.5 | 226 | 264.1 | 99.65 | 43 | 24.5 | 31.5 | ||
| 2007 | 470 | 381.8 | 215 | 299.5 | 110.49 | 42 | 47.9 | 25 | 13.9 | |
| 2006 | 467 | 377 | 220 | 291 | 111.88 | 45 | 56.1 | 23 | 8.01 | 15.3 |
| 2005 | 495 | 391.3 | 250 | 300 | 125.83 | 45 | 58.3 | 20.5 | 8.69 | 17 |
| 2004 | 400 | 291.6 | 300 | 227 | 132.43 | 40 | 33 | 22.2 | 26.27 | 14 |
| 2003 | 442 | 300.5 | 270 | 224 | 121 | 40 | 45.5 | 26.7 | 24 | 30.75 |
| 2002 | 369 | 301.31 | 250 | 239.19 | 111.45 | 35 | 34.31 | 27 | 16.97 | 17.52 |
| 2001 | 480 | 392.3 | 310 | 313.22 | 127.73 | 55 | 43.31 | 37.3 | 23.06 | 21.15 |
| 2000 | 475 | 388.45 | 320 | 310.12 | 132.38 | 50 | 42.88 | 33.5 | 22.63 | 20.73 |
| 1999 | 505 | 404.89 | 360 | 306.15 | 159.7 | 50 | 58 | 33.2 | 22.4 | 24.58 |
| 1998 | 388 | 300.81 | 280 | 228.81 | 120.25 | 55 | 41 | 35.1 | 19.5 | 23.95 |
| 1997 | 525 | 419.87 | 270 | 323.04 | 112.35 | 55 | 55 | 36.3 | 16.29 | 27.91 |
| 1996 | 391 | 301.74 | 275 | 226.41 | 121.87 | 60 | 39.63 | 40.5 | 27.14 | 24.56 |
| 1995 | 493 | 382.48 | 400 | 290.08 | 169.53 | 75 | 48.1 | 56.8 | 51.09 | 31.61 |
| 1994 | 400 | 306.45 | 305 | 233 | 123.26 | 70 | 38.99 | 49.5 | 36.77 | 25.71 |
| 1993 | 530 | 409.76 | 370 | 316 | 141.18 | 75 | 49.45 | 55 | 47.47 | 34.83 |
| 1992 | 500 | 387 | 370 | 304.1 | 150.99 | 55 | 43.45 | 36.5 | 43.59 | 34.97 |
| 1991 | 470 | 362.83 | 420 | 286.51 | 179.52 | 92 | 40.03 | 52.5 | 49.44 | 30.6 |
| 1990 | 450 | 305.9 | 210 | 214.9 | 81.67 | 60 | 57 | 40.6 | 20.95 | 40.85 |
| 1989 | 320 | 199.24 | 325 | 133.93 | 129.11 | 48 | 40.91 | 26.4 | 34.64 | 34.54 |
| 1988 | 520 | 371.46 | 425 | 252.22 | 158.61 | 65 | 77.4 | 35.1 | 54.52 | 40.74 |
| 1987 | 500 | 361.5 | 455 | 246.6 | 162.59 | 80 | 77.12 | 44.5 | 64.85 | 37.87 |
| 1986 | 600 | 448.08 | 425 | 327.46 | 171.7 | 100 | 64.29 | 55.7 | 49.69 | 40.13 |
| 1985 | 585 | 417.41 | 395 | 303.49 | 176.82 | 105 | 63.54 | 58.3 | 58.8 | 43.88 |
| 1984 | 465 | 168.42 | 110 | 70 | 53.34 | |||||
| 1983 | 455 | 180.6 | 100 | 56.5 | 56.7 | |||||
| 1982 | 500 | 197.82 | 140 | 79.9 | 52.5 | |||||
| 1981 | 465 | 166.74 | 95 | 52.6 | 56.7 | |||||
| 1980 | 420 | 166.32 | 110 | 56.4 | 36.54 | |||||
| 1979 | 470 | 191.94 | 110 | 55.7 | 49.56 | |||||
| 1978 | 515 | 191.1 | 90 | 43.3 | 50.4 | |||||
| 1977 | 290 | 102.48 | 130 | 64.5 | 23.94 | |||||
| 1976 | 212 | 111.3 | 90 | 45.2 | 20.58 | |||||
| 1975 | 430 | 138.6 | 135 | 75.6 | 56.7 | |||||
| 1974 | 380 | 122.22 | 120 | 71.2 | 42.42 | |||||
| 1973 | 400 | 137.76 | 100 | 60.1 | 54.6 | |||||
| 1972 | 420 | 142.8 | 88 | 52.8 | 46.2 | |||||


Comments